ENERGY EFFICIENT DYNAMIC ADAPTIVE
SELF-CONFIGURABLE NETWORK PROCESSOR
1SATHEESH ABIMANNAN, 2KUMAR DURAI, 3JAYAKUMAR KARUPPAIAH
1
Department of Software Engineering,
2
Department of Electronics and Communication Engineering
3
Department of Electrical and Electronics Engineering Periyar Maniammai University, Thanjavur-613 403, Tamil Nadu, India E-mail: [email protected], [email protected], [email protected]
ABSTRACT
In the current generation of network technology, the performance penalties are very severe due to poor resource allocation, especially when the traffic mix is non-uniform. Network processors, one of the recent popular network devices, inspite of their immense computing power and abundant resources, are being underutilized, especially in common applications. This paper explores the concept of self-configurable environment for the Intel IXP 2400 Network Processor (NP), which would dynamically reconfigure its resources/services based on the traffic flow. The objective of this paper is to transform the IXP2400 NP into a self-configurable environment. Microengines (MEs) are the more power hungry components of NP and IXP2400 NP consists of eight micro-engines (MEs) for packet processing. Our method involved the optimization of the usage of MEs based on network fluctuations and reduction of energy consumption by NP. The control plane constantly monitored the traffic arrival rate in the system and based on the workload, the MEs were switched on/off without any packet loss. We employed enhanced NePSim2.0 (e-NePSim) to estimate the power consumption of IXP2400 NP. Finally, our method could bring about an overall power consumption of up to 25-28% without affecting the performance of the system.
Keywords: Network Processor, Microengine, Self-configuration, power consumption, control plane,
NePSim2.0.
1. INTRODUCTION
Multicore programmable network processors (NPs) are being widely used in high-speed network routers, switches and various other network components [13]. In the fast-growing internet traffic, the present routers enable new network protocols and are also flexible for different network traffic. However, the designer need to pay utmost attention to both performance and flexibility of the router. The latest NPs architecture is proficient enough to achieve such a high performance and high flexibility through multiple micro-engines (ME), which are processed either independent or in parallel. These programmable NPs facilitate new applications of high performance rates at lower costs [2].
As NPs generally consume more power, designing NPs with low power consumption is the key challenge to the designer [8]. For instance, a router contains a group of line cards; each line card contains one or two NPs. These routers consume more power (375W per line card [7]); the operating
temperature can reach as high as 700C [3]. However, for improving the performance, the NPs are increasing the number of MEs with higher frequencies. For example, the Intel IXP2400 NPs consume approximately 13-16W and 9-12W [9] at the frequencies of 600MHz and 400MHz. Similarly, in the Intel IXP family, the Intel IXP1200 and Intel IXP 2800 NPs consume power of 4.5W and 14W at frequencies of 232 MHz and 600 MHz [20, 21].
switching on/off of MEs, which in turn depends on the traffic variation or workload.
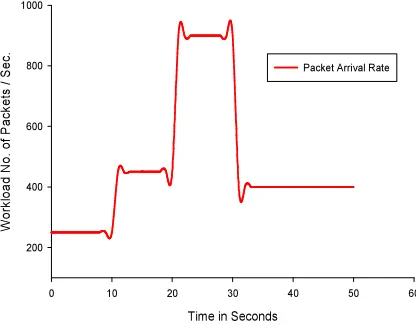
Figure 1. A Sample Traffic variation from outside Network
Time in Seconds
0 10 20 30 40 50 60
W
o
rk
lo
a
d
N
o
.
o
f
P
a
c
k
e
ts
/
S
e
c
.
200 400 600 800 1000
Packet Arrival Rate
In our previous work [1], we modelled the frame work for self-configuration of IXP2400 NP yet did not focus on energy consumption of the model. This paper solely discusses about the power consumption of our previous work. The reader can refer Paper [1] for a detailed information on self-configurable environment of IXP2400, implemented in real-time. In real-time environment, the estimation of power consumption of NP is cumbersome. Hence, we preferred to use NePSim2.0 to estimate the overall power consumption of self-configurable NPs.
An introduction of the self-configurable Intel IXP 2400 network processor is discussed in section II. In section III, the methodology for power estimation of Intel IXP2400 NP has been described. Section IV discusses the implementation details and the outcomes in. Section V demonstrates the previous works and the final section VI provides concluding remarks.
2. POWER MODEL OF
SELF-CONFIGURABLE NETWORK PROCESSOR
This section describes the overall architecture of self-configurable Intel IXP 2400 NP and e-NePsim, the power consumption estimation simulator of Intel IXP 2400 NP .
2.1 Overview of IXP 2400 NP
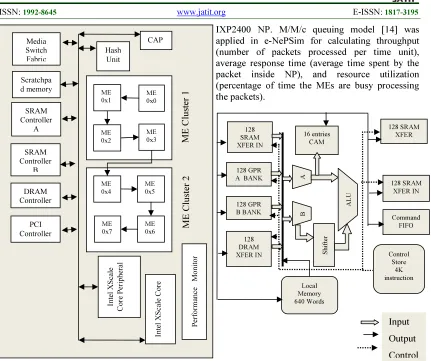
Figure 2 presents the architecture of IXP2400 NP. The primary components shown on the figure are microengines (MEs or packet-processing elements), XScale core, memory controllers (one SDRAM channel and 2 SRAM channels), media switching fabric (MSF) and SHaC (short for scratch pad, hash unit, and control & status registers).
For achieving high performance, scalability, flexibility and programmability, the networking applications such as routers, switches require this NP. The IXP 2400 architecture incorporates several hardware features, which allows the user to write a simple program to perform concurrent packet processing. The networking applications make use of MEs for data manipulation and movement owing to their fully programmable and custom processing nature . The special features of IXP architecture are: parallel processing of multiple network packets; distributed storage architecture, hardware multithreading, multilevel concurrency, active memory optimization and block data movement. Moreover, the instructions of networking processing operations such as, cyclic-redundant check (CRC) and hashing are executed in a single clock cycle. It also provides support for atomic operations and synchronization primitives.
The internal architecture of MEs is shown in Figure 3. The Arithmetic Logic Unit (ALU), a shifter and numerous storage units are combined together to constitute the data path. The executable instructions are kept in control store. The Static Random access Memory (SRAM) and Dynamic Random Access Memory (DRAM) utilize XFER(Transfer Registers) for transaction. For high-speed data storage, GPRs (General Purpose Registers) and XFERs along with local memory can be employed. Two adjacent MEs directly communicate in the data path with the help of 128 next-neighbor registers (not included in Figure 3). As the GPRs and the next-neighbor register are structurally same, they were treated alike in the simulation. For further details on ME, readers may refer IXP2400 hardware manual [12].
2.2 Overview of e-NePSim
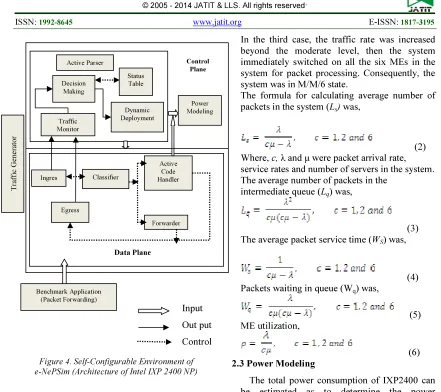
The open-source simulator NePsim2.0 [12] does not support all the functionalities of IXP2400 architecture. Notably, power consumption and StrongARM core are not modeled in NePsim2.0. Hence, we have modified the NePSim2.0 and incorporated the power modeling module and StrongARM core for energy estimation and control plane functions. The e-NePSim software architecture is depicted in Figure 4. The traffic generator generated a stream of network packets, which were fed as input to e-NePSim, within which instructions were stored as binary code.
1. Ingress –takes care of receiving the incoming packets and storing them in the SDRAM memory. 2. Classifier –classifies the network traffic into two different flows namely, active code handler and normal packet handler.
3. Active code handler –sets the flag in the predefined SRAM location, in order to indicate arrival of the active code to the X-Scale processor and move the packet content from DRAM to SRAM.
4. Normal packet handler –accomplishes the
packet forwarding function.
5. Egress –takes care of delivering the packets out through an interface.
Power supply was set as 2.0V for the MEs, which could run at two different clock rates 400MHz and 600MHz. It was also predefined that the traffic arrival and departure rates would follow Poisson Distribution. The service discipline was first-come-first service and the service rate adopted exponential distribution. Similarly, the power supply for e-NePSim was also 2.0 V, and 0.18 μm technologies were used in this model. Figure 5 illustrates the block diagram of queuing model for
[image:3.595.89.520.103.464.2]IXP2400 NP. M/M/c queuing model [14] was applied in e-NePSim for calculating throughput (number of packets processed per time unit), average response time (average time spent by the packet inside NP), and resource utilization (percentage of time the MEs are busy processing the packets).
Figure 3. Architecture of IXP2400 NP Microengine
The arrival and departure rates (λ and μ) followed Poisson Distribution. However, the packet processing revealed exponential distribution patterns. The queue service discipline was first-come-first served. Assume n ≥ c, where n and c are the number of packets received and the number servers were used by the system.
The formula for identifying the traffic intensity, ρ was,
(1) When the system was in low level traffic, the queuing model was M/M/1. Then, the traffic rate was slowly increased beyond the threshold values, so the system automatically switched on additional one ME for packet processing. Consequently, the system was in M/M/2 state.
Media Switch Fabric Scratchpa d memory SRAM Controller A DRAM Controller PCI Controller SRAM Controller B ME 0x1 ME 0x2 Hash Unit CAP ME 0x0 ME 0x3 ME 0x4 ME 0x5 ME 0x7 ME 0x6 Int el X S ca le C o re P er ip he ra l Int el X S c al e C o re P er for m anc e M oni to r M E C lu s te r 2 M E C lu s te r 1 Input Output Control 128 SRAM XFER IN 128 GPR A BANK
Figure 4. Self-Configurable Environment of e-NePSim (Architecture of Intel IXP 2400 NP)
Figure 5. Block diagram of Queuing model for IXP2400 NP.
In the third case, the traffic rate was increased beyond the moderate level, then the system immediately switched on all the six MEs in the system for packet processing. Consequently, the system was in M/M/6 state.
The formula for calculating average number of packets in the system (Ls) was,
(2) Where, c, λ and μ were packet arrival rate, service rates and number of servers in the system. The average number of packets in the
intermediate queue (Lq) was,
(3)
The average packet service time (WS) was,
(4) Packets waiting in queue (Wq) was,
(5) ME utilization,
(6) 2.3 Power Modeling
The total power consumption of IXP2400 can be estimated as to determine the power consumption of individual component at the architectural level and sum them up to derive overall power consumption. In addition, the component power estimation can be done, to sum up, into all sub-level units. Moreover, the digital circuit power consumption can be divided into static and dynamic power consumptions. All the components within the system are consuming 2% of the static power [5] when it is active. The dynamic power can be estimated as to multiply by the power consumption per voltage switch and number of voltage switches. Hence, we derived the power modelling formula for self-configurable NP at three different network traffic (low, moderate and heavy). The below equations were derived from the basic electrical power equation P = V.I,
( k = 1, low traffic)
(7)
Receiving
ME0 Transmitting
ME7
Processing ME1
To ME6
Intermediate Queue
(LQ)
Out going Packets
(μ)
Tr
af
fi
c
G
en
e
ra
to
r
Traffic Monitor
Dynamic Deployment Decision
Making
Status Table Active Parser
Ingres s
Egress
Classifier
Active Code Handler
Forwarder Power Modeling Control
Plane
Benchmark Application (Packet Forwarding)
Data Plane
Input
Out put
(k = 2, moderate traffic)
(8) (k = 3, heavy
traffic) (9)
(10)
Where Tp, Sp and Dpdram were total power
consumptions of IXP2400, static power of unit, dynamic power of a unit per access. The two SRAM units, GPR, PCI controller, X-Scale processor, Media Switch Fabric and SHaC were consuming static power. The DRAM and eight MEs were utilizing dynamic power. In e-NePSim, each unit of power consumption was calculated prior to simulation.
2.4 Tools for Power Modeling
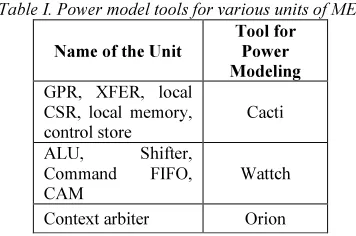
[image:5.595.99.277.526.644.2]The three existing power model tools Cacti [17], Wattch [15] and Orion [16] have been integrated and leveraged into the current power-modelling process. Each of the power modeling tools was assigned to appropriate structural units, and categorized into several types. The components’ nature and characteristics were modeled to determine the appropriate choice of tools. Cacti estimated the power of GPR, XFER, local.CSR, local memory and control store. Wattch modelled the power consumption phenomena of ALU, CAM, Shifter, queue structures and command FIFO. The power consumption model of context arbiter unit was established using Orion. The analyses of basic unit models are summarized in Table I.
Table I. Power model tools for various units of MEs
Name of the Unit
Tool for Power Modeling
GPR, XFER, local CSR, local memory, control store
Cacti
ALU, Shifter, Command FIFO, CAM
Wattch
Context arbiter Orion
The specific features of ME power models are listed in Table II. The queue model of the command FIFO was used to issue access before sending the register files to the targeted memory units from the ME and to store the DRAM, CSR and SRAM.
2.5. Determining the Threshold
Fixing a threshold value in the system is not an easy task. The value of threshold persuades the system to take a decision about shutting down one ME, without any loss of the incoming packet. For example, over a certain period of an interval, the packet arrival rate may vary in ups and downs. In such a network traffic fluctuation, the system can switch on/off the MEs. However, during this time interval, the system can monitor both the packet arrival rate and the number of packets lagging in the queue. We considered the packet arrival rate as λ and the lagging packet in the queue as Lq. Qs
denoted the queue size. We assigned the value of Qs as 1000. In addition, the system used two threshold values for a packet arrival rate, Tmin and Tmax. Similarly, the intermediate queue also had two fixed threshold values namely, Tq1 and Tq2. These
threshold values were determined based on the network trace obtained by the monitoring module. We assigned the values of Tmin and Tmax as250 and 450. The value of Tq1 was half of the Qsvalueand three-fourth (3/4) of Qs was Tq2. As discussed
earlier, the length of the queue (Lq), indicated the number of packets waiting in the queue. The system monitored the queue length and arrival rate every 0.5 Seconds. Hence, λ > Tmin and Lq > Tq1, the traffic was in moderate level. Then, the system automatically switched on one additional ME for packet processing. On the other hand, λ > Tmax and Lq > Tq2 , the traffic was heavy, then the system turned on all MEs for packet processing. When λ < Tmin and the system and was in moderate traffic, the system automatically turned off one ME. On contrary, when λ < Tmax and the system was in heavy traffic, four MEs were switched off immediately and the system was back to moderate traffic.
3. EXPERIMENT IMPLEMENTATION
In this section, the experimental environment is discussed.
3.1 e-NePSim
because he has taken more assumptions for power estimation,
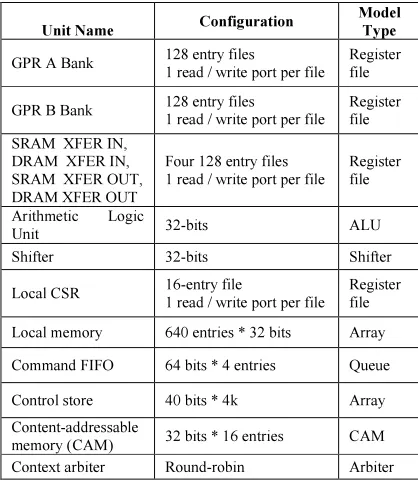
Table II. Power models for various units of ME
Unit Name Configuration
Model Type
GPR A Bank 128 entry files
1 read / write port per file
Register file
GPR B Bank 128 entry files
1 read / write port per file
Register file SRAM XFER IN,
DRAM XFER IN, SRAM XFER OUT, DRAM XFER OUT
Four 128 entry files 1 read / write port per file
Register file
Arithmetic Logic
Unit 32-bits ALU
Shifter 32-bits Shifter
Local CSR 16-entry file 1 read / write port per file Register file
Local memory 640 entries * 32 bits Array
Command FIFO 64 bits * 4 entries Queue
Control store 40 bits * 4k Array
Content-addressable
memory (CAM) 32 bits * 16 entries CAM
Context arbiter Round-robin Arbiter
For example, PCI was not modeled using NePSim2.0 and he stated that the NePSim 2.0 was a beta version. Likewise, Yan Luo et al., in [4], discussed the reduction of power consumption in various benchmark applications of different network bandwidths. Nevertheless, these researchers were unable to propose any constructive method for power modeling. Besides, they used NePSim1.0. by default, which could not support the power model. For this reason, we have modified the existing NePsim2.0 by modifying the coding of
nepsim.c and microengine.c in NePSim2.0. Then,
we developed a new power model component and integrated it into the existing NePSim2.0. In addition, the existing NePSim 2.0 is not supporting the benchmark application of ipfwdr, nat and md4.
Instead, NePSim1.0 supports these benchmark applications and architecture of IXP1200 but not the architecture of Intel IXP2400. Our modified version of simulation is named as e-NePSim, which supports the architecture of IXP 2400 NP.
3.2 Benchmark Applications
We compiled and ported three benchmark applications namely, ipfwdr, nat and md4 in e-NePSim. . ipfwdr forwards IP packets among networks, which implement an IPv4 router. The nat
is a network address translation program, which is used to compute an index of port numbers and
destination IP addresses. This index permits to replace the address and the port, retrieved from hash-table. SRAM contains the hash table for every packet access. The cryptographic algorithm md4 is used in Secure Sockets Layer (SSL) or firewall. This algorithm works on to generate 128-bit fingerprint on an arbitrary length message. These benchmark applications were considered being a sample of network domains. For example, are
ipfwdr and nat are header processing applications .
The md4 benchmark application is an example of payload-processing. The ipfwdr application was implemented in Microengine C language.
The nat was implemented in general C code to Microengine C. We used Intel’s Microengine C compiler to compile these applications to run on IXP 2400 NP.
3.3 Input Traffic Trace
The real time network traffic trace was retrieved from [18] CAIDA (The Cooperative Association for Internet Data Analysis) laboratory, for instance, Bangalore-23-10-13 trace. The e-NePSim took more than a hour to simulate 1-s of real world trace. Three different arrival rates, low, moderate and heavy were applied in our experiments. The packet range of 250, 450 and 900 were designated as low, moderate and heavy traffic accordingly. Hence, a few second of real traffic data was provided as input to the simulator.
4. EXPERIMENTAL RESULTS ANALYSIS
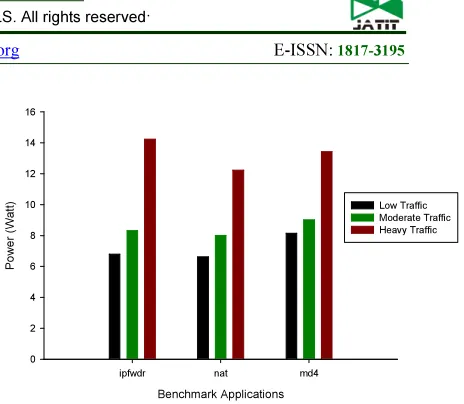
In this section, the power savings of self-configurable NP are explored. We selected three benchmark applications ipfwdr ,nat and md4 and were excuted in a different traffic mixture comprising low, moderate and heavy regimens at frequencies of 400MHz and 600MHz .
4.1 Power Savings
power savings occurred in moderate traffic. The traffic mixture applied to e-NePSim for one hour yielded about 25-28% of power savings. Therefore, the power consumption increased with an increase in frequency and the number of MEs.
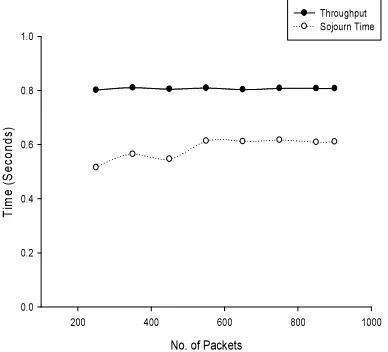
4.2 Throughput and Sojourn Time
In e-NePSim, the packets were generated and transmitted in the range of 250 to 900 packets at different time intervals in all the three benchmark applications. The result of throughput and sojourn time were more or less similar for all the traffic, low, moderate and heavy. The figure 8 explains the result of throughput and sojourn time for self-configurable NP. For instance, at a packet arrival rate of 250 to 450, the system being in low traffic used only three MEs.
The sojourn time for low traffic was 0.45 to 0.52 seconds. The packet range from 450 to 900 was considered to be moderate traffic, which had a sojourn time of 0.56 to 0.59 seconds. In such a case, the system used four MEs for packet processing. The packet range of above 900 packets was an indicator of heavy traffic, during which the system switched on all the eight MEs for packet processing. The sojourn time for heavy traffic was approximately 0.6 seconds. The throughput for all the three traffic was 0.8 seconds. These results explicitly document that the self-configuration methods used can reduce significant amount of energy consumption without affecting the system performance.
Benchmark Applications
ipfwdr nat md4
P
o
w
e
r
(W
a
tt
)
0 2 4 6 8 10 12
Low Traffic Moderate Traffic Heavy Traffic
Figure 6. Power Consumption By Different Benchmarks In Non-Uniform Traffic Mixture (Core Frequency Is
400mhz)
Benchmark Applications
ipfwdr nat md4
P
o
w
e
r (
W
a
tt
)
0 2 4 6 8 10 12 14 16
[image:7.595.305.537.90.292.2]Low Traffic Moderate Traffic Heavy Traffic
Figure 7. Power Consumption By Different Benchmark S In Non-Uniform Traffic Mixture (Core Frequency Is
600mhz)
4.3. Power Consumption by MEs
Figure 9 portrays the power consumption of individual MEs in three different traffic, low, moderate and heavy for the three benchmark applications ipfwdr, nat and md4.. In low traffic, ME0, ME1 and ME3 consumed approximately 30% of total power. In total, power consumption by all the MEs accounted to greater than 80% of the overall consumption [5]. In moderate traffic, the system turned on ME4. The power consumption of ME0, ME1 and ME2 were 70% but ME4 utilized only 50% as the number of packets received and time factors were variable. The system consumed whole 100% power in heavy traffic as the system switched on all the MEs.
5. RELATED WORKS
[image:7.595.91.293.502.646.2]mixture. Kevin Lee, Ravi Kokku et al. [6, 21, 23, 24, 25], demonstrated the run-time adaption technique methodologies for NPs. They proposed software level approaches for dynamic reconfiguration and their major contribution was in data plane. However, they did not resolve the issues on control plane and power consumption. Troxel et al. [22], demonstrated the superior performance of dynamic reconfigurable NPs in different traffic mixture. They proposed an analytical model for dynamic reconfiguration and pointed out the power saving part also but without suggesting any methodology for power estimation.
Our major contributions are in control and data planes. We proposed a software based approach to achieve the self-configuration. There is no toll available for estimating the power consumption of NPs. The existing NePSim2.0 is the open source simulator for IXP2400 NP architecture but not supportive to calculate the power consumption of IXP2400 NP. We developed a new power model component and incorporated it into NePSim2.0. In addition, the three benchmark applications, ipfwdr, nat and md4 were also incorporated into NePSim2.0.
No. of Packets
200 400 600 800 1000
T
im
e
(
S
e
c
o
n
d
s
)
0.0 0.2 0.4 0.6 0.8 1.0
[image:8.595.307.529.92.315.2]Throughput Sojourn Time
Figure 8. Throughput And Sojourn Time For Three Different Traffic (Low, Moderate And Heavy)
Power Consumption of MEs
Micro-engines in IXP2400 NP
ME0 ME1 ME2 ME3 ME4 ME5 ME6 ME7
%
o
f
P
o
w
e
r
C
o
n
s
u
m
p
tio
n
0 20 40 60 80 100
[image:8.595.89.283.423.599.2]Low Traffic Moderate Traffic Heavy Traffic
Figure 9. Percentage Of Power Consumed By Mes In Different Traffic Mixture
6. CONCLUSION
This paper addresses the power consumption of self-configurable IXP2400 NP. We enhanced the existing open source simulator NePSim2.0 and incorporated the power module component to calculate the power consumption of NPs. We tested three benchmark applications ipfwdr, nat
and md4 in a non-uniform traffic. Our methodology achieved about 25-28% of energy savings without affecting the performance of the system.
REFERENCES
[1] A. Satheesh, S. Krishnaveni, and S. Ponkarthick, “Self-configurable Environment for the Intel IXP2400 Network Processor” International Journal of Computers and Applications, Vol. 31, No. 4,pp.268-273, 2009. [2] Matthias Gries, Chidamber Kulkarni, Christian Sauer, Kurt Keutzer, ”Comparing Analytical Modeling with Simulation for Network Processors: A Case Study” presented at the proceedings of the conference on 2003 Design, Automation and Test in Europe Conference
and Exposition, 3-7 March 2003, Munich,
Germany pp: 20256-20261.
[4] Yan Luo, Jia Yu, Jun Yang, Laxmi N. Bhuyan, “Conserving network processor power consumption by exploiting traffic variability”. ACM Transactions on Architecture and Code Optimization, vol. 4, No. 1, pp.1-25, 2007. [5] S. Huang, Y. Luo, W. Feng, “Modeling and
Analysis of Power in Multicore Network Processors”, presented at the proceedings of the IEEE International Symposium on Parallel and Distributed Processing, pp.1-8, 14-18 April 2008.
[6] Ravi Kokku , Upendra B. Shevade , Nishit S. Shah , Mike Dahlin , Harrick M. Vin, “Energy-Efficient Packet Processing” University of Texas at Austin Technical Report # TR04-04, pp.1-12, 2004.
[7] Cisco. Cisco crs-1 carrier routing system 8-slot line card chassis system description.
[8] M. Franklin and T. Wolf. Power considerations in network processor design. In Workshop on Network Processors in conjunction with Ninth International Symposium on High Performance
Computer Architecture (HPCA-9), pages 10–
22, Feb. 2003.
[9] Intel. Intel ixp2400 network processor datasheet. Intel Corporation, 2004.
[10]Intel. Intel ixp2xxx network processors hardware reference manual. Intel Corporation, 2005.
[11]Y. Luo, J. Yu, J. Yang, and L. Bhuyan. Low power network processor design using clock gating. In IEEE/ACM Design Automation
Conference (DAC), Anaheim, CA, 2005.
[12]NePSim 2.0.
http://www.cs.ucr.edu/%7Eyluo/nepsim/.NePS im 2.0 Source Code, 2006.
[13]Charlie Wiseman , Jonathan Turner , Michela Becchi , Patrick Crowley , John Dehart , Mart Haitjema , Shakir James , Fred Kuhns , Jing Lu , Jyoti Parwatikar , Ritun Patney , Michael Wilson , Ken Wong , David Zar, “A Remotely Accessible Network Processor-Based Router for Network Experimentation” ANCS’08, pp.20-29, November 6–7, 2008.
[14]Jing Fu ; Sch. of Electr. Eng., R. Inst. of Technol., Stockholm ; Hagsand, O. ; Karlsson, G, “Queuing Behavior and Packet Delays in Network Processor Systems” presented at the proceeding of the conference on Modeling, Analysis, and Simulation of Computer and
Telecommunication Systems, pp.217-224,
24-26 Oct. 2007.
[15]D. Brooks, V. Tiwari, and M. Martonosi. Wattch: a framework for architectural-level power analysis and optimizations. In
Proceedings of International Symposium on
Computer Architecture, pages 83–94, 2000.
[16]H.-S. Wang, X. Zhu, L. shiuan Peh, and S. Malik. Orion: A power-performance simulator for interconnection networks. In The 35th
International Symposium on
Microarchitecture, 294–305, 2002.
[17]S. J. E. Wilton and N. P. Jouppi. Cacti: An enhanced cache access and cycle time model.
IEEE Journal of Solid-state Circuits, 31(5),
1996.
[18]OC48 trace:
https://datacaida.org/datasets/oc48/oc48-original/. Trace file: 20030424-000000-0-anon.pcap.gz
[19]Intel IXP2400 Network Processor, For OC-48/2.5Gbps network access and edge applications, Intel Corporation, 2003.
[20]http://developer.intel.com/design/network/ixa.h tml, Intel Corporation, IXP1200 Network Processor Family Hardware Reference Manual, 2001.
[21]Kevin Lee, Geoffrey Coulson “Supporting Runtime Reconfiguration on Network Processors”, Proceedings of the 20th International IEEE Conference on Advanced Information Networking and Applications
(AINA’06) Volume 1, 18-20, Aprilv2006 pp.721 – 726, 2006.
[22]I.A. Troxel, A.D. George, and S. Oral “Design and Analysis of a Dynamically Reconfigurable Network Processor” FL Proceedings of the 27th Annual IEEE Conference on Local
Computer Networks (LCN.02),pp.483 –
492,Nov. 2002.
[23]Ravi Kokku, Upendra Shevade, Nishit Shah, Harrick M. Vin, Mike Dahlin “Adaptive Processor Allocation in Packet Processing Systems” University of Texas at Austin
Technical Report # TR04-04.
[24]Ravi Kokku, Taylor L. Rich´e, Aaron Kunze , Jayaram Mudigonda , Jamie Jason , Harrick M. Vin “A Case for Run-time Adaptation in Packet Processing Systems” ACM SIGCOMM
Computer Communications Review , Volume
34, Number 1,pp.107-112, 2004.
[25]Kevin Lee, Geoff Coulson, Gordon Blair, Ackbar Joolia, Jo Ueyama “Towards a Generic Programming Model for Network Processors”
In Proc IEEE International Conference on
Networks (ICON04), vol.2,pp.504-510,