WEB DOCUMENT CLUSTERING THROUGH METAFILE
GENERATION FOR DIGRAPH STRUCTURE USING
DOCUMENT INDEX GRAPH
1BUDI, 2SRI NURDIATI, 3BIB PARUHUM SILALAHI
1
Student of Computer Science Department, Bogor Agricultural University 2Supervising Committee Chairman, lecturer of Computer Science Department,
Bogor Agricultural University
3Supervising Committee member, lecturer of Computer Science Department,
Bogor Agricultural University
E-mail: [email protected], [email protected], [email protected]
ABSTRACT
Clustering techniques are often used to cluster grouping text documents. Modeling and graph-based representation of the document clustering process can be done by using algorithms Document Index Graph (DIG). This study aims to implement the DIG algorithm for designing the structure digraphs used for graphical representation of web document clustering process. The data used is the REUTERS-21578 documents. Testing is done by determining the parameter values for the number of groups of documents to be processed and the determination of the frequency of occurrence of the word limit. Analysis performed on the stage of determining the limit frequency of occurrence of relevant words (inter-cluster) and the occurrence of the word that is not relevant (intra-cluster) on the document clustering process. Digraph structure that represents the best graph for document clustering process is achieved in inter-cluster frequency value 5 and the value of intra-cluster frequency 3 within 25 documents.
Keywords: Algorithm, Clustering, Digraph, Document Index Graph, Reuters Document
1. INTRODUCTION
Text data found in various places and life almost. When the volume of text data increases, the need for management and analysis of text data to be important. Text mining is one of the technologies that can be used to handle and anticipate the phenomenon of an increase in the volume of text data. Text clustering is one of the fundamental functions in text mining techniques [1] (Gupta, 2009).
Web documents is one of the resources on a web-based system that is found in the form of textual documents such as text, web documents, articles and papers, and so on [2](Hammouda K M, 2004). Increased volume of data, especially in the current text document triggers the use of management techniques and data analysis. The technique is referred to divide the document into different groups so that the documents contained in a group will contain the same information and are related to each other. Therefore we need a method to classify the documents in order to facilitate the retrieval of information according to user needs.
Clustering is one method that can be used to discover linkages between the documents. Clustering goal is to separate a set of documents into several groups or clusters to assess the similarity between documents in terms of content. Grouping the documents related to each other, will help users to find the information needed and increase the speed of access to that information.
pay attention to a single term only, but it should be noted phrase analysis of a document. With the phrase analysis, similarity between documents will be calculated based on phrase matching.
Document Index Graph (DIG) is a new structure in a document representing a graph-based modeling. Each document contains some sentences with words that may be repeated among the documents. If a phrase appears more than once then the frequency of individual words forming phrases will increase. DIG allows to recognize the phrase matching between documents. Quality of clusters formed from modeling DIG better results compared with the vector space based modeling[2] (Hammouda K M, 2004).
This research aims to implement the DIG algorithm to construct the structure digraph on document clustering process. limitation of this study is to determine the frequency of occurrence of the limit value of both the relevant and the irrelevant. The data used in this research were REUTERS newswire documents.
2. MATERIALS AND METHODS
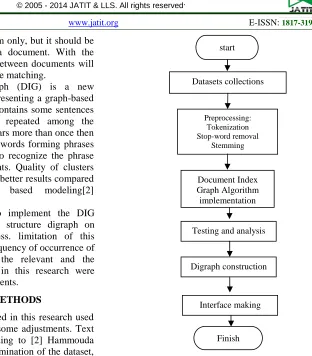
The methodology used in this research used text mining approach with some adjustments. Text mining process step according to [2] Hammouda (2004) consists of: (1) determination of the dataset, (2) pre-processing of the dataset, (3) representation of the document model, (4) implementation of the algorithms and testing, and final (5) extracting patterns from clusters are formed. Research methodology shown in Figure 1.
2.1 Datasets
Research data used to test clustering using the reuters-21578 datasets. The data is a collection of documents ever written on the Reuters newswire (SGML format) in 1987. The documents are drawn back and do indexing in several categories by the staff at Reuters. (UCI KDDI Archive, 1999).
Data contains 21,578 news documents divided into 9603 training data, 3299 test documents, and 8676 documents that are not used. As for the category, the data reuters21578 consists of 135 categories.
The data is divided into three training data based on number of title contain in one document. There are 150 titles in one document, 100 titles in one document, and 25 titles in one document.
[image:2.612.205.517.59.415.2]
Figure 1: The Research Methodology
2.2 Preprocessing
Data preprocessing stage alter the original form of textual data into a document structure that is ready for data mining process, which has been able to identify the most significant features of text that can determine the difference between certain categories [4](Srividhya V, 2010). In other words, this stage is the process of merging into a new document information retrieval system.
Stages of pre-processing in the context of text mining is as follows [4](Srividhya V, 2010): - Stop-word removal. Eliminating words that are
often used but does not contain significant information (the, of, and, to)
- Stemming. This process will search for the foundation of a word (user, used, users -> USE) - Document index. Exact keyword search
techniques of each document (graph modeling). One method is the document index term weighting. Term weighting is a weighting word on every appearance in every document and
start
Datasets collections
Document Index Graph Algorithm implementation
Testing and analysis
Finish Preprocessing:
Tokenization Stop-word removal
Stemming
Digraph construction
demonstrate the importance of the word is (counting the weight of the nodes in each edge). - Dimensional reduction. Determine the number of
documents in which there are words that frequently appear and eliminate words that rarely appear. If the word that appears not exceed n document set as the threshold value then the word may be removed.
2.3 Document Index Graph (DIG) DIG
algorithms implementation and analysis
DIG modeling is based modeling directed graph that represents the phrase in the document cluster. Graph formed from the nodes and edge-edge. nodes refer to unique words while referring to the representation of the phrase edge. A phrase is a path in the graph is modeled as an inverted list (word document). Each of these nodes has a weight information on each word occurrences in the documents that eventually combined phrases can be matched efficiently (Hammouda, 2004). Here is the algorithm proposed by Hammouda DIG.
Require: Gi-1: cumulative graph up to
document di-1 or G0 if no documents were
processed previously di ← Next Document
M ← Empty list
for each sentence sij in di do
v1 ← tij1 {Kata pertama dalam sij}
if v1 is not in Gi-1 then
Add v1 to Gi-1
end if
for each term tijk Є sij, k=2,…, lij
do
vk ← tijk ; vk-1 tij(k-1) ; ← ek = (v k-1,vk)
if vk is not in Gi-1 then
Add vk to Gi-1
end if
if ek is an edge in Gi-1 then
Retrieve a list of document entries from v
k-1 document table that have a sentence on
the edge ek
Extend previous matching phrases in M for phrases that
continue along edge ek
Add new matching phrases to M
else
Add edge ek to Gi-1
end if
Update sentence path in nodes vk-1 and vk
end for
end for Gi ← Gi-1
Output matching phrases list M
2.4 Testing and Analysis
Stage of testing means a test to generating digraph structure. The flow process of generating digraph structure phase are:
1 Implementing DIG Algorithm
2 Adding codes for determining value the amount of document that most frequently appear and determining the number of irrelevant word that frequently appears.
3 Displays the results of the algorithm with a document index graph displays the number of occurrences of the word most often in accordance with a predetermined limit value 4 Generating the digraph structure obtained from
the ooutput results and use as input to interface making process.
5 Display the output shown by graph representation.
Codes for determining value the amount of document that frequently appear and determining the number of irrelevant word that frequently appears as follows:
foreach($token as $word=>$many){ $limits = count($b)-1;
if($word != """ && $word != "reuter" && $ word != "&#;" && $word != "REUTER" && $words != "Reuter"){
if($many > ($limits-m)){ if($i > n){
$token_selection[$j] = $word; $token_selection_weight[$j] = $word." => ".$many;
echo "$token_selection_ weight[$j]<br>";
$j++; } $i++; }
} }
The research using 10 testing data and 40 training data.The analysis on the obtained results according to previous phase of testing will be carried out in this phase. The analysis will be performed based on the results of a combination of value the amount of document that frequently appear and determining the number of irrelevant word that frequently appears :
• $limits-m means the process will show the most frequently words that appear greater than $limits-m value, where $limits is the number of document. (intra-cluster value).
it looks less representative because digraphs graph will refer to itself (inter-cluster value).
2.5 Interface Making
The interface making of digraph structure is made based on the training data that produces the highest accuracy.
3. RESULTS AND DISCUSSIONS
The making of this research is using xampp server and graphviz software. DIG algorithm can handle for generating digraph structure of singe document or multiple document. In this research use REUTERS sgm’s file that contain 25 documents, 50 documents and 100 documents. Digraph structure can be generated from single document or multiple document.
During testing processs, it gives the best clustering result when we determined m as the amount of words that most frequently appear greater than $limits-m value and determined the number of irrelevant word that frequently appears as $i > n.
[image:4.612.328.509.108.457.2]Result of testing using the data testing with user defined m and n within 25 document is shown in Table 1. Result of testing using the data testing with user defined m and n within 50 document is shown in Table 2. Result of testing using the data testing with user defined m and n within 100 document is shown in Table 3.
Table 1: Testing Using User Defined M, N Within 25 Documents.
m n Result
0 0 pct(54), mln(47), year(35), billion(32), company(29), quarter(28), stock(27), bankamerica(26)
0 3 billion(32), company(29), quarter(28), stock(27), bankamerica(26)
5 3 billion(32), company(29), quarter(28), stock(27), bankamerica(26), sales(23), debt(22)
25 0 All words that appear in the document are displayed
Table 2: Testing Using User Defined M, N Within 50 Documents.
m n Result
0 0 dlrs(129), year(87), mln(84), billion(69)
0 3 billion(69)
5 3 billion(69), company(50)
10 3 billion(69), company(50), growth(43)
[image:4.612.327.507.304.471.2]15 3 billion(69), company(50), growth(43), shares(36)
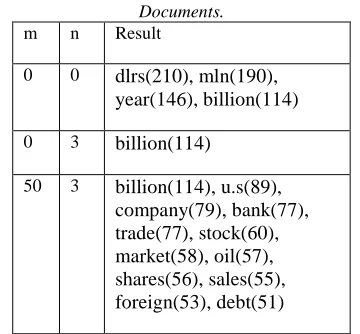
Table 3: Testing Using User Defined M, N Within 100 Documents.
m n Result
0 0 dlrs(210), mln(190), year(146), billion(114)
0 3 billion(114)
50 3 billion(114), u.s(89), company(79), bank(77), trade(77), stock(60), market(58), oil(57), shares(56), sales(55), foreign(53), debt(51)
[image:4.612.108.286.456.680.2]Figure 2: Graph Representation Generate From Digraph Structure Result For All Documents Contain 25 Document
The testing comparison of testing data and training data take place the combination between m value and n value that will give the best result of clustering result. In 25 documents process, value m set to 5 and value n set to 3. When the document combine with another 25 documents, the value of n keep set to 3 while the value of m must adjust according to $limit value as number of documents processed.
4. CONCLUSION
Digraph construction of REUTERS document based on document index graph algorithm have the best result where n=3. It explains that in REUTERS document, there are at least three words that often appear in all document but never had relationship with other words. If we include these three words in graph presentation would not suitable because their lines will refers to theirshelves. The research is just analyze the relationship among inter-cluster and intra-cluster members identified from the value of term frequent for helping clustering process. Hopefully, in the next research, the process can define the most recommend value for m and n in any number of documents. It has impact on the wisely best result as well.
REFERENCES
[1]. Gupta, V. (2009). A Survey of Text Mining Techniques and Applications. (60-76).
[2]. Hammouda K M, M. S. (2004). Efficient phrase-based document indexing for web document clustering.
[3]. Huang, C. J. (2011). Text Clustering Using a Suffix Tree Similarity Measure.
JOURNAL OF COMPUTERS, VOL. 6,
NO. 10.
[4]. Srividhya V, R. A. (2010). Evaluating Preprocessing Techniques in Text Categorization. International Journal of
Computer Science and Application Issue.
[5]. Torres, G. J. (2009). A Similarity Measure for Clustering and its Applications.
International Journal of Electrical and Electronics Engineering, 3:3.