Development and Evaluation of Valsartan Floating Microspheres for
Controlled Release
Md. Shadab Pasha
1Sumithra Devi
2Abilash. R
31,3
Assistant Professor
2Associate Professor
1,2,3
Dr. H. L. Thimmegowda College of Pharmacy Kengal Channapatnas,
Karnataka- 562161, India
Abstract— The objective of present study is to develop site-specific controlled release drug delivery system of valsartan for the treatment of hypertension. Floating microspheres of valsartan were prepared by solvent evaporation method. The drug was encapsulated with Ethyl cellulose and hydroxy methyl cellulose in various combinations of polymers ratios. The prepared microspheres are subjected to evaluate such as particle size, % buoyancy, in-vitro release and stability studies. From the results of studies shows that formulation F5 was found to be satisfactory in terms of excellent micrometric properties, yield of microsphere (88.12%), incorporation efficiency (91.01%), buoyancy (88.68%) and highest in-vitro drug release of 93.23% in a controlled manner with constant fashion over extended period of time for 12 hrs. Furthermore it was observed that concentration of ethyl cellulose affected all the evaluation parameter significantly. The present work is an attempt made to provide an alternative drug delivery system for better treatment of hypertension using Valsartan as a model drug in the form of microspheres using biocompatible polymers which will overcome the inherent drawback of existing dosage form.
Keywords: Valsartan, Floating, Microspheres, Gastro Retentive and Controlled Release
I. INTRODUCTION
Floating microspheres are one of the multiparticulate drug delivery systems and are prepared to obtain prolonged or controlled drug delivery, to improve bioavailability and to target drug to specific sites, decreasing dosing frequency, and improving patient compliance.1 Microspheres are defined as spherical microscopic particles having a size range of 1- 1000µm. Valsartan (VAL) is a potent and specific competitive antagonist of the angiotensin-II AT1-receptor2,3 by blocking the action of angiotensin. Valsartan dilates blood vessels and reduces blood pressure4. One of the very common and suitable methods to prepare these polymeric microspheres is solvent evaporation method using polymers like hydroxy propyl methyl cellulose, Ethyl cellulose5. Valsartan is already formulated for the other floating dosage forms such as, floating tablets and floating beads.6,7 The floating microspheres have many advantages over those dosage forms such as no risk of dose dumping, increase solubility due to micron size.8 in the present work Floating microspheres of valsartan were prepared by solvent evaporation method. The drug was encapsulated with Ethyl cellulose and hydroxy methyl cellulose in various combinations of polymers ratios. which is most simple and of high yield method.
II. MATERIALS AND METHODS
A. Materials:
Valsartan was procured as a gift sample from Torrent Pharmaceuticals Ltd. Nalagarh, H.P, India. Ethyl Cellulose
18-22 cps, Ethyl cellulose 7-10 cps, Hydroxy propyl Methyl Cellulose, Ethanol, Dichloromethane, Tween 20, Loba Chemie Pvt. Ltd., Mumbai India All other chemicals and reagents were of analytical grade and were used as they were procured. Distilled water was used in all experiments.
B. Method:
1) Preparation of Floating Microspheres of Valsartan: 9-11
In this work, solvent evaporation method has been employed to prepare floating microspheres of Valsartan with ethyl cellulose, hydroxyl propyl methyl cellulose. The drug and polymers in different proportions are weighed dissolved into previously cooled mixture of ethanol: dichloromethane at room temperature in different ratios were shown in Table no 1. The mixture was stir vigorously to form uniform drug polymer dispersion. The above organic phase was slowly added to 100 ml distilled water containing 0.01% tween 80 by maintain the temperature at 15 – 20°C and emulsified by stirring at 2000 rpm for 15 min. microspheres formed were filtered, washed with water and sieved between 50 and 30 mesh size, and dried overnight for 40°C.
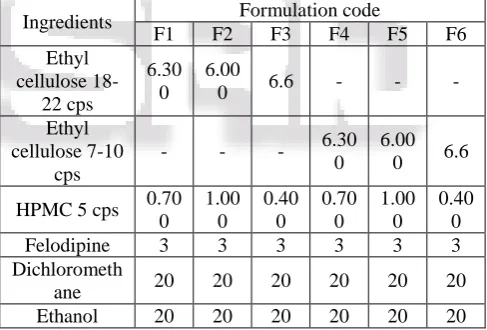
Ingredients Formulation code
F1 F2 F3 F4 F5 F6
Ethyl cellulose
18-22 cps
6.30 0
6.00
0 6.6 - - -
Ethyl cellulose 7-10
cps
- - - 6.30
0 6.00
0 6.6
HPMC 5 cps 0.70 0
1.00 0
0.40 0
0.70 0
1.00 0
0.40 0
Felodipine 3 3 3 3 3 3
Dichlorometh
ane 20 20 20 20 20 20
[image:1.595.307.551.385.550.2]Ethanol 20 20 20 20 20 20
Table 1: Formulation of floating microspheres of Valsartan
III. RESULTS AND DISCUSSION:
A. Preformulation Studies:
In the present work, preformulation studies such as solubility, determination of melting point, calibration curve, and compatibility studies were carried out. The results of the various preformulation characterizations are given below.
B. Solubility Study:
Valsartan is soluble in ethanol and methanol and slightly soluble in water.
C. Determination of Melting Point:
D. Determination of λmax:
Absorption maximum (max) was found to be 248.5 nm.
E. Development of Calibration Curve for Valsartan (max):
The concentration ranges and data are reported in Table no 2. Calibration curve of Valsartan was plotted using this data and shown in the Figure no 1.
Sl. No. Concentration (µg/ml) Absorbance
1. 0 0
2. 10 0.175± 0.003
3. 20 0.375± 0.011
4. 30 0.571± 0.021
5. 40 0.798± 0.028
6. 50 0.995± 0.040
[image:2.595.306.552.67.290.2]Table 2: Calibration curve for Valsartan in methanol
Fig. 1: Calibration curve of Valsartan in methanol at 248.5 nm
F. FT-IR study:
FT-IR study was employed to ascertain the compatibility of the drug Valsartan with EC and HPMC. Both the spectra were compared for confirmation of common peaks. Specific peaks of pure drug and formulation showed no significant variation in wavenumbers, 3196.15 cm-1 (Cyclic amines), 3043.77 cm -1 (C - H stretching (aromatic)), 2963.12 cm-1(C - H stretching
(alkenes)), 1575.99 cm-1 N - H bending, 1460.16 cm-1 (C = C aromatic (asymmetrical)), 999.16 cm-1 O-H bending (alcohol) and 761.91 cm-1 chlorine moiety, this proved that drug and excipients were compatible. There is no interaction between drug and polymer.
G. Post Formulation Studies:
1) Micromeritic Property of Valsartan Microspheres:
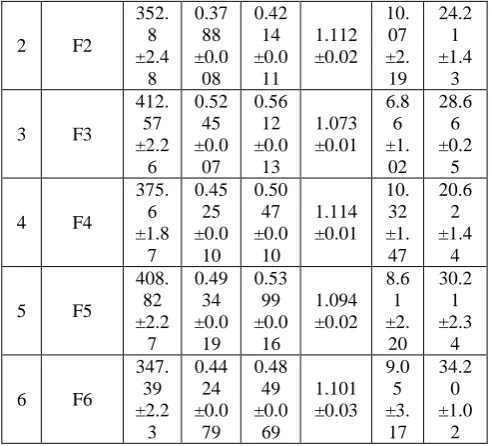
Six batches of floating microspheres of Valsartan were prepared. The prepared microspheres were evaluated for its micromeritic properties i.e. mean Particle size, Angle Repose, Bulk density, Tapped density, Hausner’s ratio, and Carr’s index. And the results which found are shown in Table no 3 respectively. Sl . N o. Formul ation Code Mea n parti cle Bulk Den sity Tap ped Den sity Hausn er’s Ratio Car r’s Ind ex (%) Angl e of Repo se* (θ)
1 F1
386. 32 ±1.6 4 0.41 52 ±0.0 06 0.45 31 ±0.0 13 1.090 ±0.01 8.3 4 ±1. 31 31.3 7 ±1.1 1
2 F2
352. 8 ±2.4 8 0.37 88 ±0.0 08 0.42 14 ±0.0 11 1.112 ±0.02 10. 07 ±2. 19 24.2 1 ±1.4 3
3 F3
412. 57 ±2.2 6 0.52 45 ±0.0 07 0.56 12 ±0.0 13 1.073 ±0.01 6.8 6 ±1. 02 28.6 6 ±0.2 5
4 F4
375. 6 ±1.8 7 0.45 25 ±0.0 10 0.50 47 ±0.0 10 1.114 ±0.01 10. 32 ±1. 47 20.6 2 ±1.4 4
5 F5
408. 82 ±2.2 7 0.49 34 ±0.0 19 0.53 99 ±0.0 16 1.094 ±0.02 8.6 1 ±2. 20 30.2 1 ±2.3 4
6 F6
347. 39 ±2.2 3 0.44 24 ±0.0 79 0.48 49 ±0.0 69 1.101 ±0.03 9.0 5 ±3. 17 34.2 0 ±1.0 2 Table 3: Micromeritic property of floating microspheres of
Valsartan *mean±SD, n=3
2) Percentage yield:
The percentage yield of floating microsphere formulation F1 to F6 containing different grades of ethyl-cellulose & formulation was in range of 75.66±0.76 to 92.36±1.18. To observe the effect of polymer concentration on the percentage yield of the floating microspheres, formulations were prepared at varying concentration of ethyl cellulose. The yield of the floating microspheres increased with increasing polymer concentration.
3) In-vitro buoyancy:
The purpose of preparing floating microspheres was to extend the gastric residence time of a drug. The buoyancy test was carried out to investigate the floatability of the prepared microspheres. The microspheres were spread over the surface of a simulated gastric fluid and the fraction of microspheres buoyant and settled down as a function of time was quantitated. The In-vitro buoyancy of formulation F1 to F6 containing different grades of ethyl-cellulose & formulation was in range from 75.38±1.71 to 92.22± 2.33 respectively. All the formulations pass in-vitro buoyancy. Among all formulations F1 shown least buoyancy duration and F4 was found to be highest in-vitro buoyancy 94.95±1.07. The results also showed a tendency that the larger the particle size, the longer floating time.
4) Incorporation efficiency:
The incorporation efficiency of formulation F1 to F6 containing different grades of ethyl-cellulose & formulation was in the range of 72.47±1.45 to 91.01± 2.75 respectively. Among all formulation F5 has shown 91.01 percentages.
[image:2.595.46.290.145.432.2]The results of determination of Percentage yield, In-vitro buoyancy, and Incorporation efficiency of the prepared Valsartan microspheres values were shown in Table no 4 and Figure no 2, 3, 4 respectively.
F3 69.09±1.17 91.37±1.55 89.08±1.29 F4 92.36±1.18 92.22±2.33 72.47±1.45 F5 88.12±2.30 88.68±1.65 91.01±2.75 F6 86.77±2.02 85.13±2.34 84.78±1.48 Table 4: Percentage yield, in-vitro buoyancy and incorporation efficiency of floating microspheres of
[image:3.595.38.536.45.613.2]Valsartan *Standard deviation (SD), n=3
Fig. 2: Comparison of yield of floating microspheres of Valsartan
[image:3.595.45.294.56.625.2]Fig. 3: Comparison of % in-vitro buoyancy of Valsartan floating microspheres
Fig. 4: Comparison of drug incorporation efficiency of floating microspheres of Valsartan
5) Scanning electron microscopy (SEM):
[image:3.595.326.518.59.368.2]Morphology of microspheres was examined by scanning electron microscopy. The outer surface of the microspheres was smooth and dense, while the internal surface was porous. The shell of the microspheres also showed some porous structure. It may be caused by the evaporation of solvent entrapped within the shell of microspheres after forming a smooth and dense skin layer. The SEM of the optimized Valsartan microspheres was shown in the Figure no 5 and 6 respectively.
[image:3.595.335.513.66.197.2]Fig. 5: Scanning electron microphotograph of floating microspheres of Valsartan F5 at 50
Fig. 6: Scanning electron microphotograph of floating microspheres of Valsartan F5 at 100X
6) In-Vitro Release Study of Valsartan Microspheres:
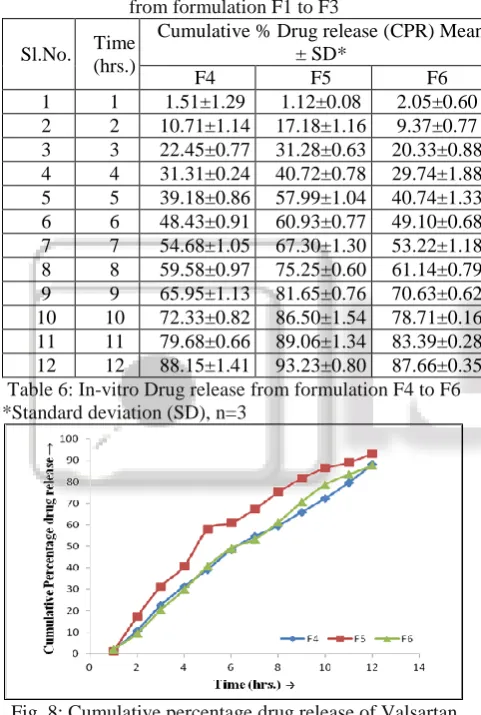
In-vitro drug release studies of Valsartan from floating microspheres were performed in dissolution test apparatus. It was found that in vitro drug release of formulation F1 to F6 containing cellulose and various grades of ethyl-cellulose. F1, F2, F3, F4, F5, F6, show percentage drug release 84.53±1.25 to 93.23±0.80 at end of 12 hour. Amongst the formulation F5 was found to be the best formulation as it release Valsartan in a sustained manner with constant fashion over extended period of time (after 12 hr.). After performing the In-vitro Drug release of the prepared Valsartan microspheres, the result which was shown in Table no 5, 6 and Figure no 7, 8 respectively.
Sl.No. Time (hrs.)
Cumulative % Drug release (CPR) Mean ± SD*
F1 F2 F3
[image:3.595.308.551.543.723.2]Fig. 7: Cumulative percentage drug release of Valsartan from formulation F1 to F3
Sl.No. Time (hrs.)
Cumulative % Drug release (CPR) Mean ± SD*
F4 F5 F6
[image:4.595.307.551.90.212.2]1 1 1.51±1.29 1.12±0.08 2.05±0.60 2 2 10.71±1.14 17.18±1.16 9.37±0.77 3 3 22.45±0.77 31.28±0.63 20.33±0.88 4 4 31.31±0.24 40.72±0.78 29.74±1.88 5 5 39.18±0.86 57.99±1.04 40.74±1.33 6 6 48.43±0.91 60.93±0.77 49.10±0.68 7 7 54.68±1.05 67.30±1.30 53.22±1.18 8 8 59.58±0.97 75.25±0.60 61.14±0.79 9 9 65.95±1.13 81.65±0.76 70.63±0.62 10 10 72.33±0.82 86.50±1.54 78.71±0.16 11 11 79.68±0.66 89.06±1.34 83.39±0.28 12 12 88.15±1.41 93.23±0.80 87.66±0.35 Table 6: In-vitro Drug release from formulation F4 to F6 *Standard deviation (SD), n=3
Fig. 8: Cumulative percentage drug release of Valsartan from formulation F4 to F6
7) Analysis of Drug Release Mechanism:
To analyze the mechanism of the drug release kinetics of the dosage form, the data obtained were fitted to various kinetic equations of zero order, first order, Higuchi model and Korsmeyer - peppas model and plotted as: 1. Cumulative percent drug released Vs. time (Zero order plots) 2. Log cumulative percent drug remaining Vs. time (First order plots) 3. Cumulative percent drug release Vs. square root of time (Higuchi plots) 4. Log cumulative percent drug release Vs.log time (Korsmeyer-Peppas Plots). The mechanism of the drug release was super case II transport, because the release exponent (‘n’ value) is
higher than 0.89. The regression coefficient (r2) values are tabulated in Table no 7 respectively.
Formulation Code
Zero order (r2 Value)
First order (r2 Value)
Higuchi Matrix
(r2 Value)
korsmeyer – Peppas r2 Value
‘n’ Value F1 0.975 0.947 0.987 0.957 1.345 F2 0.933 0.968 0.983 0.802 1.447 F3 0.978 0.950 0.996 0.928 1.443 F4 0.989 0.941 0.994 0.926 1.464 F5 0.943 0.975 0.989 0.846 1.511 F6 0.990 0.962 0.990 0.960 1.435 Table 7: Kinetics data obtained from In-Vitro drug release profile for floating microspheres of Valsartan
IV. CONCLUSION
The purpose of present work was to develop floating microspheres of Valsartan for controlled drug delivery. From the results it seem that formulation F5 was found to be satisfactory in terms of excellent micrometrics properties, yield of microsphere (88.12%), incorporation efficiency (91.01%), buoyancy (88.68%) and highest in-vitro drug release of 93.23% in a controlled manner with constant fashion over extended period of time for 12 hrs. It was observed that concentration of ethyl cellulose affected all the evaluation parameter significantly. Hence, finally it was concluded that the prepared floating microspheres of Valsartan may prove to be potential candidate for safe and effective controlled drug delivery over an extended period of time which can reduce dosing frequency.
ACKNOWLEDGMENTS
The authors are thankful to the principal of Dr. HLT college of Pharmacy for providing the facilities to carry out this work.
REFERENCES
[1] M.O. Emeje, O.O kunle, Compaction characteristics of ethyl cellulose in presence of some channeling agent: technical note AAPS pharmasciteh 2006; 7 (3) article58.
[2] Criscione, L.; Gasparo, M. D.; Buehlmayer, P.; Whitebread, S.; Ramjoue, H.P.; Wood J.M. Br. J. Pharmacol., 1993, 110, 761-71.
[3] Dina, R.; Jafari, M. Am. J. Health Syst. Pharm., 2000, 57, 1231-41.
[4] Markham A, Goa KL. Valsartan, Drugs. 1997; 54: 299–311.
[5] Kannan K., Karar K.P., Manavalan R. Formulation and Evaluation of Sustained Release Microspheres of Acetazolamide by Solvent Evaporation Technique. J. Pharm. Sci & Res. 2009; 1(1): 36-39.
[6] Kshirsagar SJ, Patil SV, Bhalekar MR. Statistical Optimization of Floating Pulsatile Drug Delivery System for Chronotherapy of Hypertension. Int J Pharm Investig 2011; 1: 207–213.
[image:4.595.44.285.238.596.2]Dissolution Enhancement Approach. Der Pharmacia Sinica 2013; 4: 54-66.
[8] Arora S, Ali J, Ahuja A, Khar RK, Baboota S. Floating Drug Delivery Systems: A Review. AAPS Pharm Sci Tech 2005; 6:E372–E390.
[9] Yuveraj ST, Pushpendra SN, Ojha GR. Development and evaluation of floating microspheres of verapamil hydrochloride. Brazilian Journal of Pharmaceutical Sciences2007; 43(4):529-534.
[10]Anandkumar Srivastva, Devendra Naryanrao ridhurkar, Saurabh Wadhwa. Floating microsphere of cimetidine: formulation, characterization and in vitro evaluation. Acta pharm 2005; 55 : 277–285.