Non Linearity Analysis of High Power Amplifier
in OFDM system
Amanjot Singh Hardeep Kaur
Department of Electronics & Communication Department of Electronics Technology Lovely Professional University Guru Nanak Dev University Phagwara, Punjab (India). Amritsar, Punjab (India)
ABSTRACT
The performance of OFDM system is highly affected by Amplifier nonlinearities. Nonlinearity in power amplifier response leads to nonlinear amplification of OFDM signal. In this paper, the effects of clipping and amplifier nonlinearities are studied for the OFDM system. It is shown that distortion due to these effects is highly related to the digital modulation techniques rather than the clipping level or the saturation level of the nonlinear amplifier. Simulations have been performed for the system with the help of programs in MATLAB 7. Computer simulations of the OFDM system also show the OFDM signal quality metrics such as time spectrum, BER, PAPR for the different type of modulations. Bit error rate and Peak to Average power Ratio have been calculated and then compared for the different modulation techniques.
Keywords
OFDM (Orthogonal Frequency Division Multiplexing), PAPR (Peak to Average Power Ratio), HPA (High Power Amplifier), SSPA (Solid State Power Amplifier), PSK (Phase Shift Keying), QAM (Quadrature Amplitude Modulation), BER (Bit Error Rate).
1. INTRODUCTION
The performance of wireless communication is highly related with the power amplifier [1]. The wireless system’s data rate is often determined by the linearity of the Power Amplifier [2]. Since early days of vacuum tubes to modern era of solid state transistor the power amplifiers are being studied and developed. There has been a renewed interest in power amplifiers with the explosion of cellular phones and wireless communication networks. The linearity requirement has significantly increased to accommodate many new and intricate modulation techniques [3]. Secondly with the requirement of small and lighter portable devices efficiency has become much more critical issue. In the 4G technology mainly OFDM is considered for modulation. High power amplifier (HPA)’s working and performance plays very important role in OFDM wireless system [4]. Modern power amplifier designer face much tougher environment [5]. In this paper, nonlinearity of HPA for different modulations is
studied in the OFDM wireless system. OFDM is a
combination of modulation and multiplexing. Orthogonal Frequency Division Multiplexing (OFDM) is a multicarrier transmission technique, which divides the available spectrum into many carriers, each one being modulated by a low rate data stream. OFDM uses the spectrum much more efficiently by spacing the channels much closer together [6]. This is achieved by making all the carriers orthogonal to one another, preventing interference between the closely spaced carriers.
1.1
Problem Formulation
In OFDM systems, the combination of different signals with different phase and amplitude give a large dynamic range that is used to be characterized by a high PAPR, which results in severe clipping effects and nonlinear distortion. If the composite time OFDM signal is amplified by a power amplifier, which have non-linear transfer function that degrades the performance of an OFDM System. In this paper the main objective is to investigate the impact of amplifier nonlinearity for different modulations techniques in OFDM system. So it is required to model the high power amplifier for the OFDM system .A measure of the degradation can be very helpful in evaluating the performance of a given system, and in designing a signaling set that avoids degradation. The high PAPR sets strict requirements for the linearity of the Power Amplifier. So the second objective is to compare the Peak to Average Power ratio for the different modulation techniques in the OFDM system. High linearity requirement for the Power Amplifier leads to Low power efficiency and therefore to high power consumption. Bit error rate also degrades according to the non-linearity of the power amplifier. So bit error rate for high power amplifier is also required to be compared for different source signal modulations.
1.2 Paper Organization
In this paper, the effects of Clipping and amplifier nonlinearities are modeled in an OFDM system. The distortion due to these effects is highly related to the dynamic range of signal and also with the clipping level or the saturation level of the nonlinear amplifier. Computer simulations of the OFDM system using MATLAB are showing the non linearity characteristics of high power amplifier in wireless communication. Section 2 deals with basic concepts of OFDM. Section 3 explains the power amplifiers models at the transmitter side for OFDM system. Section 4 shows the non linearity analysis and simulations of OFDM system for non linear power amplifier. Finally conclusion has been drawn based on results.
2.
OFDM SYSTEM
format that is finding increasing levels of use in today's radio communications scene. OFDM has been adopted in the Wi-Fi arena where the 802.11a standard uses it to provide data rates up to 54 Mbps in the 5 GHz ISM (Industrial, Scientific and Medical) band. In addition to this the recently ratified 802.11g standard has it in the 2.4 GHz ISM band. In addition to this, it is being used for WiMAX and is also the format of choice for the next generation cellular radio communications systems including 3G LTE and UMB. Then for the future it is being proposed as the modulation technique for fourth generation cell phone systems that are in their early stages of development and OFDM is also being used for many of the proposed mobile phone video systems. OFDM, orthogonal frequency division multiplex is a rather different format for modulation to that used for more traditional forms of transmission. It utilizes many carriers together to provide many advantages over simpler modulation formats.
3. POWER AMPLIFIER MODEL
Practical and power-efficient amplifiers will have a nonlinear response unless the Power Amplifier (PA) is operating far from its saturation point [5]. Accurate nonlinear models for the amplifier provide a good accuracy with reasonable complexity for simulation and analysis purposes [7]. These empirical models are developed based on a set of selected input-output observations and offer a compact representation of the Power Amplifier characteristics [8]. Further a brief review for models is explained here. Consider an input signal in polar coordinates as
𝑥 = 𝜌 𝑒𝑗∅
where 𝜌 is the amplitude and ∅ is the phase of input signal .The output of the power amplifier can be written as [2]:
𝑔 𝑥 = 𝑚(𝜌)𝑒𝑗 (∅+𝑝 𝜌 )
where 𝑔 𝑥 represents the output of power amplifier,𝑚 𝜌 represents the AM/AM conversion and 𝑝 𝜌 the AM/PM conversion characteristics of the power amplifier [11]. Several models have been developed for nonlinear power amplifiers;in this paper Linear clipping model and SSPA model have been considered for the nonlinearity analysis and simulations.
3.1 Limiter Model
A Limiter (clipping) amplifier’s Transfer Characteristics are expressed as:
𝑔 𝑥 = 𝑥 𝑥 < 𝑆𝑆 𝑥 ≥ 𝑆
where 𝑔 𝑥 is output of power amplifier for a particular input 𝑥, 𝑆 is the clipping level (Saturation level) for the given range of signal. This model does not consider AM/PM conversion [9].
3.2 Solid State Power Amplifier (SSPA)
Model
The conversion characteristics of power amplifier are modelled by Rapp’s SSPA model with Characteristic function as:
𝑣
where𝑣𝑖𝑛and 𝑣𝑜𝑢𝑡and are complex input and output respectively, 𝑣𝑠𝑎𝑡 is the output at the saturation point and 𝑝 is “knee factor” that controls the smoothness of the transition from the linear region to the saturation region of characteristic curve (a typical value of 𝑝 is 1). As the value of knee factor increases the SSPA model approaches the Limiter Model. SSPA model is very accurate in defining the transfer characteristics of solid state amplifiers which are now mainly used in transmitters [10]. In this paper SSPA model have been used for modelling the non linear amplifier in the OFDM system.
4. SIMULATIONS AND ANALYSIS
[image:2.595.320.553.282.476.2]Analysis of OFDM signal can be explained with the help of amplifier models, developed for OFDM systems as discussed in previous section. SSPA (Solid State Power Amplifier) model has been further used in developing the MATLAB based OFDM transmitter system for the analysis and simulation of power amplifier.
Fig 1: Response of Power Amplifier Models
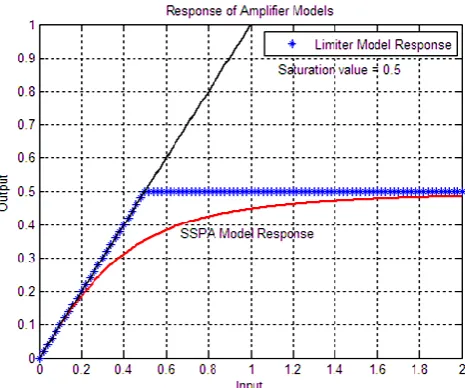
Figure 1 compares the response of limiter model and SSPA model with the ideal linear power amplifier. For the limiter model of amplifier, the output remains constant as input reaches the 0.5 V. For SSPA model Response of the output varies as shown in figure which is different from ideal and limiter model response.
[image:2.595.327.550.636.729.2]4.1 Various System Parameters
Table 1: System Parameters for OFDM Model
1 Data Source Random
2 Modulations PSK, PAM, QAM
3 M 4,16,32,64,128,256
4 Signal level Variation -1 to +1 V
5 Saturation Level 0.5
6 Subcarriers points 128, 1024
7 Cyclic Prefix length 3
Fig 2: Response of Solid State Power Amplifier
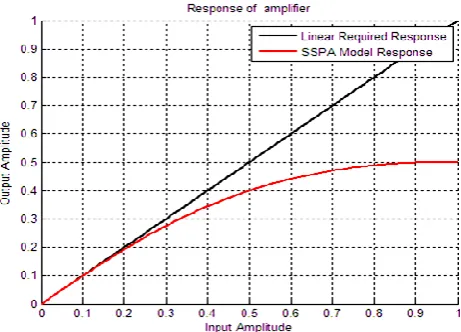
Plot demonstrates the comparison of idealized and practical response of power amplifier at the RF transmitter side of OFDM system. From the input = 0.3, non linearity starts for the solid state power amplifier.
[image:3.595.319.542.118.278.2]4.2 OFDM Signal Time Spectrum
Figure 3: Time spectrum for OFDM signal with PAM modulation.
[image:3.595.58.282.317.506.2]Figure 3 shows that the Range of the amplitude variation is very large. Peak value of amplitude is much greater than its average value.
Fig 4: Time spectrum for OFDM Signal with QAM modulation.
Figure 4 shows that for QAM the range of the amplitude variation is very dynamic. Peak value of amplitude is greater than its average value but comparatively difference is lower than the PAM as shown in Figure 3.
Fig 5: Time Spectrum for OFDM Signal with PSK Modulation
Figure 5 shows that the range of the amplitude variation for PSK is comparatively less dynamic than other modulations. Peak value of amplitude is greater than its average value but difference is lower than QAM and PAM, as depicted in figures 3 and 4.So, peak to average power ratio (PAPR) should be least in PSK modulation.
4.3 PAPR for Different Modulation
Techniques
Comparison of Peak to average power ratio for different modulations in OFDM system is shown in plot.
Fig 6: Peak to Average Power Ratio Variations for Different Modulation Techniques with Saturation Level
0.5 V
[image:3.595.319.543.466.609.2] [image:3.595.58.283.541.731.2]Table 2 PAPR Variation for Different Modulations
4.4 Bit Error Rate for Different
Modulation Techniques
[image:4.595.327.529.138.301.2]Fig 7: Plot of BER for PSK Modulation
Fig 8: Plot of BER for PAM Modulation
4.5 Comparison of BER for Different type
of Modulations
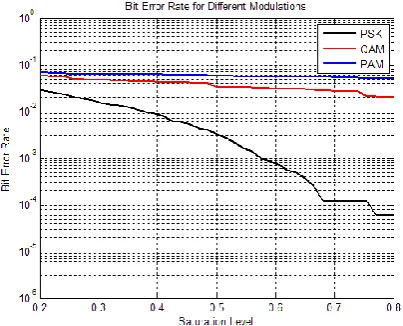
Bit error rate varies differently for different modulation techniques i.e. PSK, QAM, PAM as shown in figure 10.
[image:4.595.59.286.224.381.2]Fig 10: Comparison of BER for Different Modulation Techniques
Table 3: Bit error rate for different Modulations
Figure 10 shows that Bit error rate for phase shift keying is lowest as compared to other modulation techniques used in OFDM signal.Plot shows the comparison of BER for different modulation techniques.
5. CONCLUSIONS
The effects of nonlinearities in the power amplifier over OFDM systems were analyzed and simulated, so it can be concluded that the distortion due to high power amplifier, either limiting or nonlinearity effects, are highly related to the distribution parameter of signal which controls the dynamic range. So the main conclusions are as below:
It is noticed that the effects of nonlinearity depends upon the type of modulation used in OFDM systems. This is due to the fact that the different modulation methods give rise to different amplitude and phase of signal, which is related the peak to average power ratio (PAPR).
According to the simulation results, M PSK is better than other modulation methods for reducing PAPR that is for reducing the non-linearity in high power amplifier in OFDM system.
It is also noticed that Bit error rate for the amplifier is minimum for the signal modulated with Phase Shift Keying (PSK) as compared to the other modulations. So signal modulated with PSK has minimum distortion in Saturation
level (V)
Modulation PAPR
0.5 PAM 8-24
0.5 QAM 6-8
0.5 PSK 3-6
Saturation Level (V)
Modulation BER
0.3-0.8 PSK 10-1.5 -10-5
0.3-0.8 QAM 10-1 -10-2
[image:4.595.58.282.418.567.2] [image:4.595.59.298.607.749.2]6. REFERENCES
[1] Steve C. Cripps, “RF Power Amplifiers for Wireless Communications”, Second Edition.
[2] Ashraf A. Eltholth, Adel R. Mekhail, A. Elshirbini, M. I. Dessouki and A. I. Abdelfattah, “Modeling the Effect of Clipping and Power Amplifier Non-Linearities on OFDM Systems”, Faculty of electronic Engineering , National Telecommunication Institute, Cairo, Egypt , August 2009.
[3] Kandus, Gorazd; Javornik, Tomaz; Jelovcan, Igor; Plevel, Sreco, “Effects of nonlinear high power amplifier on the area covered by WiMAX signal”, Sarnoff Symposium, 2006 IEEE, Pages: 1 – 4, 2006.
[4] J. Vuolevi and T. Rahkonen, “Effects of nonlinear distortion and imperfect parameters estimation on the performance of OFDM-based DTTB systems”. Distortion in RF Power Amplifiers IEEE ,Norwood Artech House, 2003.
[5] P. Kenington, “High-Linearity RF amplifier Design,” Artech House,2000.
[6] F. H. Gregorio and T. I. Laakso, “The Performance of OFDM-SDMA Systems with Power Amplifier Non-Linearities”, Proceedings of the 2005 Finnish Signal Symposium FINSIG'05, Kuopio, Finland, August 25, 2005.
[7] Ashraf A. Eltholth, Adel R. Mekhail, A. Elshirbini, M. I. Dessouki and A. I. Abdelfattah , “ Modeling the Effect of Clipping and Power Amplifier Non-Linearities on
OFDM Systems” Ubiquitous Computing and Communication Journal , Volume 3 Number 1, Page 54-59
[8] S. Akamatsu, C. Baylis, and L. Dunleavy, “Accurate simulation models yield high efficiency power amplifier design,” IEEE Microw. Mag.,vol. 6, no. 4, pp. 114 – 124, Dec. 2005.
[9] Le LIU, Kiyoshi HAMAGUCHI and Hiromitsu WAKANA, “Analysis of the Combined Effects of Nonlinear Distortion and Phase Noise on OFDM Systems”, IEICE TRANS. COMMUN., VOL.E88–B, NO.1 JANUARY 2005.
[10] E. Costa and S. Pupolin, “M-QAM-OFDM system performance in the presence of a nonlinear amplifier and phase noise,” IEEE Transactions on Communications, pp. 462–472, March 2002.
[11] Curt Schurgers Mani B. Srivastava,”A Systematic Approach to Peak-to-Average Power Ratio in OFDM ”, Proc. SPIE Vol. 4474,Advanced Algorithms, Architectures, and Implementations XI, Franklin T. Luk; Ed, , p. 454-464, Nov. 2001.