Munich Personal RePEc Archive
Production structure and technical
efficiency analysis of sericulture in
Pakistani Punjab
Ahmad, Munir and Shami, Tanvir Khaliq
Pakistan Institute of Development Economics
1999
Online at
https://mpra.ub.uni-muenchen.de/17467/
,'(sia-Pac!fic Journal of Rural Dewlvpment /'vi. I.\".December 1999, .\"0 2
Production Structure and Technical Efficiency
Analysis of Sericulture in Pakistani Punjab
Munir Ahmad and Tanvir Khaliq Shami'
Abstract
The objectil'es vfthis paper are to SI/ICl\' the sericllltlire prodllction s/mctllre and the ((Iwlysis of fCll"ln-lel'el technical efficientT II/easllres, The reslilis ShOll' that /7/0SI of the pll"lliers inm"'ed il/ this en/erfJrise are il/itemte, 7his il/dllsll:'" is filrther characterised by' inapllrolll'iale rearing sheds, COII/I)lete lack of extension service, del)endence on gOl'(!/"nll/ell/ forests /hr 1Ill1lhen:'" le({\'es facing I)eak seosol/ shortage, .1'11111)'"of poor qllatill' silkll'Ol"IIl seed ol/d iII/proper processing and II/adetin:!, /c/citities, Lohollr shares II/ore Ihan -0 percel/I of Ihe tOlol coSI of prodllcliol/ and hou'el'er, proll/ises reasol/ab'" high rellir/7 01/ im'estll/ell/, Sioc//(/slic l)ruilliClion ji'ontier OI/O"',I"iS il/dic((Ies thai Ihe sericlI!tllre ell/erprise p/ces il/creasil/g rellll"lls 10 scale, ,'/l"l'mge techl/ical efficiel/c)' isfollnd 10 be (J,8S wilh a lI/il/ill/lIl1/ of(J, 3- and a IIwxill/lIl1/ of 0,98, lem'in:!, sigllljico/1l scope for illlprOl'e/nenl in prodllctil'itl' ((I/(I Ihlls lirofi{(lhitill', the reslilis jilrlher shou' thm lechl/ical efficiency is fJosili,'el), associaled u'ith the si=e oflhe acli"ill',
1.0 I ntrad uction
Pakistan is basically an agricultural economy, It accounts for about 24 percent of the country's output. employs more than 50 percent of the total labour force and directly or indirectly supports about 75 percent of the population, Its contribution to the country's total foreign exchange earnings exceeds 70 percent (Pakistan, 1998), Presently there are about five million private farms in Pakistan: among those. about 50 percent have less than two hectares of land --which is not an economical size and Illost of these farmers are even unable to earn their sustenance, Recent research results have shown that about one third of our rural population has been living under extreme poverty -- rural land-less communities are even Illore ill fated (Qureshi and Arif. 1999), The Illost striking concern is that the poverty index has increased over time, To ,deal with such a state of affairs. the farming community is practicing intensive and exhausti\ e agriculture. \\'hile the non-farming rural lot has nothing to endure against this rising destitution, There is no extra land to be put under cultivation. \\'hile the pressure on land
continues to maximize output and employment for the fast growing population of the country. This plight calls for 'Integrated Agriculture' with livestock, poultry, forestry and cottage industry.
Among the cottage industries, sericulture is an important welfare-oriented village-based activity. One of the special features of this industry is that of the mulberry crop -- the sole source of silkworm feed -- can be grown under diverse environmental conditions by small and marginal farmers (Panda, 1995). Fortunately. Pakistan is a sub-tropical' country and is suitable for growing mulberry and rearing silkworm (GUO, 1985).
Sericulture is a highly labour-intensive enterprise and has played a significant role in economic development of some of the now advanced nations, particularly Japan, in the early stages of modernisation (Otsuka, 1982). Due to high cost of labour input, Japan. China, Italy and France have diverted their resources from sericulture to electronics, transpOI1, and heavy machinery industries. However, the silk production culture is getting popular in labour-abundant countries such as Vietnam. Thailand. some parts of China. India and Pakistan. Sabir ( 1997) argues that India and Pakistan among the Asian countries are in a better position to develop this sector. If adopted on modern lines backed by advanced technology and knowledge from countries such as Japan. China. Korea and Thailand etc. then this cottage industry could prove more remunerative than most of the cash crops (Hanumappa and Anatharaman. 1992).
As regards development of sericuiture in Punjab, Pakistan, it was "first introduced in Taxila locality in 1947. Subsequently. it expanded to forest localities where mulberry plantation was <1\ailable in abundance to support sericuiture farms. These forest localities are Changa-l\langa, Daphor. Chich<l\\atni. "amalia. Khane\\'al. Ghagat. Kundian and Jauharabad, among others .
.-\ccording to Sabir. in Punjab aboul 9000 households are engaged in this profession. about 18660 acres of land is under mulberry trees. and about 1053 acres of mulberry are as bush type plantation on government lands. 1\ loreover. 225 acres of bush type mulberry is planted on private lands. As regards production of Sericulture. about 12500 packets are reared annually pro\ iding 375 metric tons of cocoons. On average, Pakistan does not produce more than 300 to 400 metric tons of raw silk annually. \lhich is not enough to meet the domestic demand of the sill.- industry. An almost equal amount is being imported every year to meet the requirements of the silk industry.
The average yield of cocoons as this study indicates is 27 kg. which is considered very low as compared to the yields in Japan and "orea \\'here production is more than 40 kg from the same quantit)' of seed. The productivity per packet of seed in the study area ranges from 9 kg to 45 kg. It is hypothesized that the main factor affecting this wide variation in yield is management efficienc~. also called technical efficiency. The farm level technical efficienc~ measure carries immense impol1ance in preparing development strategies. In cases \I'here the most producing firms are found closer to the production frontier using the existing technology. then an increase in productivit) requires the outll'ard shift of the output frontier by applying
new inputs and advanced technologies. On the other hand, if the farmers face significant inefficiencies, then productivity can easily be enhanced using the same resource base and technology more efficiently. What is needed is institutional and infrastructural development for better delivery of inputs, improvement in extension, education and farm management services, and execution of managerial skill development programmes.
The main objectives of the present study are to analyse the structure of sericulture fanning and measure the farm-specific technical efficiencies. To our knowledge no study has yet been conducted analysing technical efficiency using Pakistani sericulture data.4 The remaining paper is planned as follows. In section 2.0 we describe the methodological framework. Section 3.0 contains the results and Section 4.0 concludes the paper.
2.0 Methodological Framework
2.1 The data
Sericulture activity or silkworm rearing is spread over the large areas in the Punjab, especially around forest plantations. The present study is restricted to two localities, i.e., the Changa Manga and Chichawatni forests. These localities were selected on the basis of the concentration of sericulture activities. A list of sericulturists in and around the Changa-Manga and Chicha\\'atni forests was obtained from the sericuiture department of the Government of Punjab, Lahore. From each locality five villages were selected at random. From each village eight respondents were selected again at random. Consequently, 40 respondents were selected from each locality constituting 80 respondents in total. In order to get precise and detailed information, the personal interview method as a technique of data collection was adopted. A comprehensive interviewing schedule was designed. which was pre-tested in field conditions before starting the actual survey.
2.2 Measurement of technical efficiency and empirical model
Farrell (1957) was the first who introduced the concept of technical efficiency of a firm. He defined technical efficiency as the ratio of actual realised output to that of maximum achievable potential with the same quantities of inputs and technology. Farrell's original work was of a non-parametric type, which was later extended to parametric ones. These models could be divided into two groups - one deterministic, and the other. stochastic frontier. The former assumes that any deviation from the frontier is due to inefficiency, while the latter allows for statistical noise.
The stochastic frontier approach was developed independently by Ainger, Lovell and Schmidt (1977) and tvleeusen and van den Broeck (1977). The key advantage of this technique is that the error term in such models has two components - one is symmetric, capturing the effects of those factors which are not under the control of the firm and the other is one-sided. representing management inefficiency. Kalirajan (1981) proposed that the predicted technical inefficiency effects could be regressed on various observable explanatory variables involving farmer or farm-specific factors to examine the determinants of inefficiency: This two-step procedure has been used by various applied researchers. This procedure has been criticized on the ground that it violates one of the basic assumptions that of 'identically independently distributed technical inefficiency effects in the stochastic frontier' (Battese, Malik and Gill.
1996). Battese and Coelli (1993 and 1995) proposed a one-stage modelling approach in which the technical inefficiency effects are a function of various observable variables such as age, education, access to extension services etc.
The trans log and the Cobb-Douglas forms of production functions are the most widely used in efficiency analysis of the agriculture sector. The translog is a flexible functional form. which does not require a priori restrictions on technology like constant returns to scale, Hicks' neutral technology, homogeneity, separability and constant elasticity of substitution. This functional form is a second-order Taylor series approximation requiring a large number of parameters to be estimated. lulticollinearity is often a problem while estimating the translog models. The problem of multicollinearity becomes more severe when a single equation production function is estimated and the present study is no exception.' Consequently. this study uses the Cobb-Douglas stochastic production frontier. which is written as
In(Y,)=~o+ ~IIn(pack,) +~" In(leav,) + ~)In(lab,) + ~~(Ioc)+v,- ~l,
Where:
(I)
indicates the i-th farmer in the sample; Ln is natural logarithm (i.e., logarithm to base e);
Y represents the total output of cocoon for i-th farmer (in kg); Pack are the number of packets reared by the i-th farmer;
Leav shows the total quantity of leaves used by the i-th farmer (in kg); Lab represents the amount of labour used by the i-th farmer (in man-days);
Loc is dummy variable showing value of I if farmer belongs to Changa-t\langa and 0 if belongs to Chichawatni;
5 The translog production function was also estimated that resulted into various violations of regularity conditions. However, some of the empirical studies have shown that technical efficiency measures are unaffected by alternative functional forms (e.g., Ahmad and Bravo·Ureta, 1996).
P's are unknown parameters to be estimated;
v is a random variable which is assumed to be independent and identically distributed random error, having nomlal distribution with mean 0 and variance
()2V; and
p is a non-negative random variable associated with the technical inefficiency of farmers. assuming half nonnal distribution truncated at mean 0 and has a
)
varIance ()-u.
According to Sattese and Coelli (1993), the technical inefficiency component ~liis a function, i.e.,~l,=
l,b
+Wi' Wherel,
is vector of explanatory variables, [) is a vector of unknown parameters to be estimated, and Wiis an unobservable random variable assuming truncated nonnal distribution with mean zero and variance ()2, given that ~li is non-negative (i.e., Wi ~. -lib). The model oftechnical inefficiency effects in our case is written as
(2)
Where:
£'P represents the experience of the i-th farmer in this occupation in years; and
edll indicates the number of years offomlal education of the i-th farmer.
Given the specifications 'Of the stochastic frontier and inefficiency models 111 Equations
and 2, technical efficiency measures for the i-th farm are estimated as TEi= exp (-p;).
Various hypotheses are tested using generalised likelihood-ratio statistic, which is speci fied as
LR =-2(L(Ho) - L (HJlJ (3 )
Where L(Ho) and L(H I) represent the values of the log likelihood functions under the null and alternate hypotheses. respectively. The LR test statistic has an asymptotic chi-square distribution with degrees of freedom equal to the difference between the number of parameters in the unrestricted and restricted models.
3.0 Results and Discussion
This section of the paper is divided into two subsections. The first summarizes the structure of sericulture production in Punjab. and the second explains the results of the frontier function analysis.
3.1 The structure ofsericulture in Punjab
Education and Experience: The data show that about 58 percent of the sampled sericulture farmers to be illiterate. The remaining 42 percent are found to have some education ranging from one to 16 years of schooling. The average education of a sampled respondent is about four years of schooling. Experience, along with education, is very much essential for the sericulture profession, since it is a skilled-labour demanding activity from start to the end of the production process. About 30 percent of the farmers have 5-10 years of experience, 49 percent are in business for the last 11 to 20 years and about 21 percent have over 25 years of experience in sericulture farming. On average, a farmer is in this business for the last 17 years.
Type of Rearing Sheds: About 83 percent of the sampled farmers raise silkworms in buildings made of mud. The remaining 17 percent used brick-made buildings for rearing. Thus, most of the fanners are without proper rearing sheds, which could be the main source of low productivity in the area. The silkworms are very susceptible to various diseases and thus, require suitable rearing rooms to prevent entry of insects, etc. Besides, silkworms should be raised at a constant temperature and under good hygienic conditions for not only greater, but also, better quality production (Otsuka, 1982).
Technical Information: The survey indicated that there is virtually no technical guidance available to the farmers. Out of 80 sampled farmers, only one has a contact with the extension agent of the Sericulture Department, Government of Punjab. That is why almost all of the fanners are unaware of new techniques of production and are thus facing low productivity.
Sources of Seed and Lem·es: The malll source of silkworm seed is the Sericulture Department of the Government of Punjab. More than 90 percent of the farmers get silkworm seed from this source, while the others obtain from private dealers. As regards the quality of seed, about 90 percent of the farmers claimed that the seeds provided by all these sources is of extremely very poor quality and, thus, having a very low hatching percentage.
About 94 percent of the sampled sericuiturists purchase mulberry leaves from the government forests. The other six percent of the farmers got mulberry leaves from private sources, as well as from government forest resources. Being a single source of mulberry leaves, it creates various problems for the farmers such as, shortage of leaves, when these are most needed as reported by about 68 percent of the respondents; and non-availability of leave permits was reported by 10 percent of the farmers.
Sericulture as Occuparion and Laboltr use: Sericulture IS still being considered as a secondary occupation in Pakistan. Only two percent of the sampled farmers have been practicing it as their sole occupation. About 28 percent are ordinary labourers engaged in this
occupation to supplement their income. About 26 percent are the ordinary farmers growing crops and raising livestock, 27 percent are either government or private sector employees and the rest are shopkeepers/traders and students having sericulture farming activity as a side business. Most of the sericulture farming is family based: about 55 percent of the farmers rely on family labour only, and the remaining 45 percent use hired labour in addition to their own family labour. The use of hired labour is found to be positively associated with the size of the activity.
lost Structure: The cost comparison of the surveyed localities indicates that the production cost per kg of output is higher in Chichawatni as compared with Changa-Manga, mainly because of low productivity. The labour input dominated by sharing about 70 percent of the total variable cost incurred in the production of cocoons in both the localities. The second major input item is silkworm seed costing about 10 to 12 percent of the total. The third major variable cost item is that of mulberry leaves sharing about seven percent of the total. The remaining costs were incurred on other miscellaneous items.
Proftwbilit)" of the Sericulture Business: Per packet production of cocoons is greater in Changa-f\ 1anga as compared to that of in Chichawatni (Table-I). Average income per kg of cocoons is Rs. 27.33 in Chicha\\'atni, while it is Rs. 35.91 per kg in Changa-Manga. Moreover. the average rate of net returns per rupee of investment is higher in Changa-Manga, i.e., Rs. 0.56 as compared to Chichawatni where it is only Rs. 0.38.
Table-1: Production per Packet of Seed, Average Income per Kilogram of Cocoon Produced
Landin'Price/kglos/tRs)C.iIlCOlIIYilicolllperYillCOIIIProd.R(l/e of (kg)
(Rsl(11.1')"'g (Rs)Re/III'II Rs II?s)
Chicha\\'anti
24 100 2400 174388656120.3827.33
Changa
31.50 100 3150 2018741131260563591 f\langa
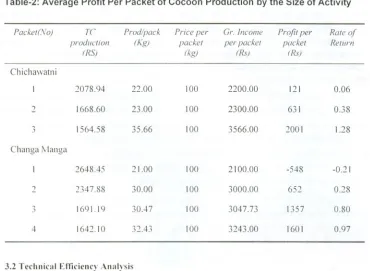
The results given in Table-2 sho\\ that the cost of production per packet declines as the size of the activity increases. \\hile the net returns are positively associated with the size. f\loreover. rate of returns per rupee of investment also improves with the increase in the size of the c·nterprise.
Thus it appears that the sericullllre is a very profitable business. It could further prosper on a larger scale if supported by a better marketing system. About 64 percent of the respondents are not satisfied with existing marketing facilities and the prices paid for cocoons.
Table-2: Average Profit Per Packet of Cocoon Production by the Size of Activity
Packet("o)Prod/packGr. IncomePrice perRate ofProfit perTC production
("'g) packet per packelRelllrnpacket rR5)
(kg) (Rs;
fRs)
Chichawatni 2078.94
22.00 100 2200.000.06121
2
1668.6010023.00 2300.000.38631
3
1564.5810035.66 3566.001.282001
Changa i\ langa 2648.45
21.00 100 2100.00-0.21-548
2
23478810030.00 3000.000.28652
3
1691.1930.-n100 3047.730.801357
4
1642.1010032.43 3243.000.971601
3.2 Technical Efficiency Analysis
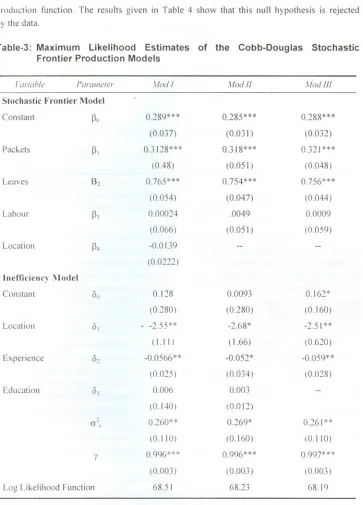
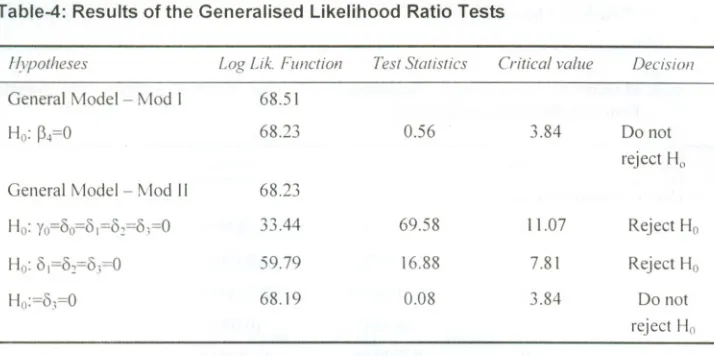
Three versions of the Cobb-Douglas stochastic Frontier production function given in Equations I and 2 were estimated using the computer programme "FRONTI ER 4.1" written by Tim Coelli of the University of Ne\\' England, Armidale, Australia. The results are reported in Table-3. The first. i\lod I. is the unrestricted model specified in Equation I. In this model the location variable is used bOlh in the production Frontier and a factor afFecting the inefficiency term. The sign of the location variable in Frontier is found to be negative and statistically non-sign ificant. Th is ind icates that there is no productivity di fFerential bet\\'een two local it ies. To test its signi ficant contrihution, the Likel ihood Ratio (LR) test is also used (Equation 3), The null hypothesis, i.e. H[>:~.=O, that there is no contribution of the location variable in frontier cannot be rejected (Table 4l.
production function. The results given in Table 4 show that this null hypothesis is rejected by the data.
Table-3: Maximum Likelihood Estimates of the Cobb-Douglas Stochastic
Frontier Production Models
/·m·iab!e Parameter.\10d ff.\fod f.\fod fff
Stochastic Frontier Model Constant
~o
0.289***0.285***0.288*** (0.037)
(0.031 )(0.032) Packets
~I
0.3 128***0.318***0.321*** (0.48)
(0.051 )(0.048) Leaves
82
0.765***0.754***0.756*** (0.054)
(0.047)(0.044) Labour
~J
0.000240.0009.0049 (0.066)
(0.051 )(0.059) Location
~~
-00139 (0.0222)
Inefticien ry :\Iodd Constant
00
0.1280.00930.162* (0.280)
(0.280)(0.160) Location
01
.
-2.55** -2.51 **-2.68*
( 1.11 )
( 1.66) (0.620) Experience
O2 -0.0566**-0.059**-0.052*
(0.025) (0.034)(0.028) Education 8; 0.0060.003 (0.140) (0.012)
,
0.260** 0.269*0.261** cr-s(O.IIO) (0.160)(0.110)
Y
0.996***0.996***0.997***
(0.003)
(0.003)(0.003) Log Likelihood Function
68.51 68.2368.19
"'Significant at the 1 percent level, "Significant at the 5 percent level, 'Significant at the 10 percent level. j'
Table-4: Results of the Generalised Likelihood Ratio Tests
r~l'potheses Critical valueDecisiollTest StatisticsLogUk.FUllction
General Model- Mod I
68.5\
Ho: ~4=0
68.23 0.56
3.84 Do not reject Ho
General Model - Mod \1
68.23
Ho:Yo=8o=81=82=8,=0
33.44 69.58
11.07 Reject Ho
Ho:81=82=8,=0
59.79 16.88
7.81 Reject Ho
Ho:=8,=0
68.19 0.08
3.84 Do not reject Ho
The second null hypothesis tested in Mod II is that of Ho:81 = 82 = 8, = 0, which specifies
that the explanatory variables present in the technical inefficiency model have zero coefficients. This null hypothesis is again rejected.
The parameter estimate of the education variable in the inefficiency model has a positive sign showing that technical inefficiency increases as the manager has a greater number of years of schooling. This is an unexpected outcome and could be the result of high collinearity bet\\'een experience and education - the correlation coefficient comes out to be very high (i.e .. 0.60). given the cross-sectional nature of the data. To resolve the issue whether the education variable has any significant independent influence in explaining technical inefficiency. the LR-test is again performed. The null hypothesis. Ho: 8, =0 - that education or years of schooling has no influence on technical inefficiency. cannot be rejected.
Given the above statistical test result. the education variable was excluded from the inefficiency model. Finally. 1'.lod III is considered to be the most preferred model for further analysis. The results of this model are given in the last column of Table 3. The signs of the parameter estimates are as expected. The sigma-square is found to be statistically significant at the 5 percent level pointing to the existence of firm level technical inefficiencies. The estimate cfy is found to be 0.997. This implies that the firms' productivity differentials mainly relate to variance in management. The high magnitude of y suggests that the stochastic frontier production function does not significantly differ from the deterministic production frontier. This result is similar to that of the finding of a study by gwenya. Sattese and Flemming ( 1(97).
The estimated production elasticity coefficient for packets for the most preferred model IS 0.32 and is significant at the one percent probability level. This implies that a 10 percent increase in the number of rearing seed packets results in a 3.2 percent increase in the
production of cocoons. The coefficient of leaves variable is significant at the one percent probability level and is equal to 0.76 showing a 7.6 percent increase in cocoon production with a 10 percent increase in the use of leaves. The estimated coefficient for labour is 0.0009, which is not only small in magnitude but also statistically not significant at any reasonable probability level.
The sum of all production elasticities, which is called the Function Coefficient (Fe) is equal to 1.08 and the corresponding estimated standard error [Se(FC)] is equal to 0.045. The Se(FC) is computed as
The hypothesis of constant returns to scale (He: FC = I, HI: FC> 1) is tested using t-statistic. The null hypothesis, He: FC = I, is rejected implying that there exists increasing returns to scale in sericulture farming. The magnitude of the FC implies that the production of cocoons increases by about 1 I percent by increasing all inputs by 10 percent.
The signs of the explanatory variables for the technical inefficiency effects are as expected. The estimated coefficient for location is negative, which indicates that Changa-Manga farmers are technically more efficient than the farmers in Chichawatni. The parameter estimate of the experience variable is negative in sign implying greater years of experience with better education tends to reduce technical inefficiency. Performing the same task over and over again leaves lesser chances of error. Moreover, the previous management mistakes and flaws are usually covered up during the next production period (Kalirajan, 1981).
The distribution of technical efficiency over the sample given in Table 5 shows that about 83 percent of the farmers have a technical efficiency of 81 percent or higher. The remaining 17 percent of the farmers show a technical efficiency of less than 80 percent. Table 5 further indicates that farmers rearing four packets are more efficient than the farmers rearing three, two or one packet of seed - showing a positive association between size of the enterprise and techn ical efficiency.
Table-5: Technical Efficiency Index
Sample Distribution of Tech. Efficiency
Range of TE %of Farmers
Technical Efficiency By Size of Activity
#
of Packets Technical Eff.Less than 70 7.50 0.773 71-80
10.00 2 0.884 81-90
23.75 3 0.932
91-100
58.75 4 0.945
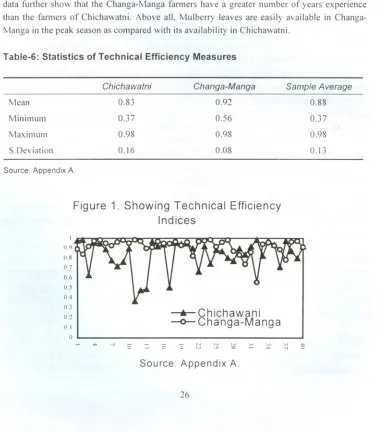
The results given in Table 6 show a wide variation in the levels of technical efficiencies. On average, farmers are 88 percent technically efficient with a minimum of 37 percent and a maximum of 98 percent. This result leaves considerable scope for improving technical efficiency and thus productivity, by using the same level of resources. The measures of technical efficiency further show that the farmers in Changa-Manga are technically more efficient with a mean of 0.92 -- varying from 0.56 to 0.98 and standard deviation of 0.08 --than the farmers in Chichawatni having an average of 0.83 -- extending from 0.37 to 0.98 and standard deviation of 0.16. Figure I displays a very clear difference in variations of technical efficiency measures in both of these localities. The lesser variation in Changa-Manga could be attributable to better marketing and other facilities like availability of reeling machines. The data further show that the Changa-Manga farmers have a greater number of years experience than the farmers of Chichawatni. Above all, Mulberry leaves are easily available in Changa-Manga in the peak season as compared with its availability in Chichawatni.
Table-G: Statistics of Technical Efficiency Measures
Chichawafni
Changa-MangaSample Average
Mean
0.83 0.92 0.88 Minimum
0.37 0.56 0.37 Maximum
0.98 0.98 0.98 S.Deviation
0.16 0.08 0.13
Source: Appendix A.
Figure 1. Showing Technical Efficiency
Indices
1
09
0.8 0.7 0.6 0.5 04
03
01
01
o
---.- Chichawani
-o-Changa-Manga
'0
'0 hJ loJ 'J, ex:
Source: Appendix A.
4.0 Concluding Remarks
The present research is aimed at studying the structure of the sericulture enterprise as well as undertaking a technical efficiency analysis of this type of farming in the Punjab province. The results of the study show that about 58 percent of the farmers are illiterate. On average, a sericulturist is in business for the last 17 years - farmers in Changa-Manga have more experience than that of in Chichawatni. About" 80 percent of the farmers were without proper rearing pIa es.
As regards the cost of production, labour shares the main portion of total cost of production that is about 70 percent both in Chichawatni and Changa-Manga. However, the hiring of
labour increases as the size of activity increases. Moreover, there is an inverse relationship between the size of activity and the average cost of production. The cost of production per packet is found to be higher in Chichawatni than in Changa-Manga mainly due to lower yield in the former -- average production per packet in Changa-Manga is about 32 kg and in Chichawatni is 24 kg. The results also show that the production of cocoons per packet of seed is positively associated with the size of activity. Moreover, the net rate of returns per rupee of investment is higher in Changa-Manga (Rs 0.56) than that in Chichawatni (Rs.0.38).
The production frontier analysis shows the existence of increasing returns to scale in sericulture enterprise. The results of the technical inefficiency model show that the farmers of Changa-Manga are technically more efficient than those located in Chichawatni, mainly due to having better access to input and output markets in the former. Experienced and educated farmers tend to have lower levels of technical inefficiency. The average technical efficiency is found to be 0.88 with a minimum of 0.37 and a maximum of 0.98. The results further show that technical efficiencies of the larger-scale farmers are higher than that of the farmers with small sized activity.
The major problems reported by the farmers relate to: low quality seed, non-availability of leaves at peak season. low price of cocoon. sub-standard marketing facilities along with cocoon diseases. In order to popularise the sericulture industry in Pakistan, these problems have to be taken care of. For this cottage industry to be viable and more productive, some other measures are also suggested. including:
• provision of local cocoon drying facilities,
• exclusive development in the source of mulberry foliage for silkworm - presently leaves are available only in the autumn season making silkworm rearing impossible in spring. which could be done encouraging area under bush type mulberry plants at the farm lands .
• the existing sericulture extension directorates should be made more effective and accountable.
• co-operatives should be encouraged for marketing of output and inputs, building of incubation centres and rearing places equipped with temperature and humidity controlled devices, and
• pilot projects relating to sericulture with community participation and involvement of local and foreign experts should be started in areas having silk production potential - such type of projects are in operation in some parts of China and Vietnam and proved very successful, see Yoshida (1997).
Appendix A
Predicted Technical Efficiencies of Sample Farmers
Far/II .\"0. ChichOl\'(/taniChanga-.\4anga
I
0.9770.893 2 0.9840.839 3 0.6300.919 4 0.9550.975 5 0.9480.984 6 0.8890.951 7 0.7780.927 8 0.7180.963 9 0.7630.981 10 0.8980.952II
0.3680.985 12 0.4770.970 13 0.4890.899 14 0.9700.910 15 0.9170.968 16 0938 0.949 17 0.5040.947 18 0.9540.966 19 0.9450.929 20 09480.962 21 0.8990.821n
}' 0.6630.969References
Ahmad, B. and 1.J. Khan. 1993. Economics of Sericuiture in Azad Jamlllu and Kashmir.
Pakistan Entomologist 15, No 1-2: 97-98.
Ahmad. i1unir and Boris E. Bravo-Ureta. 1996. Technical efficiency Measures for Dairy Farms Using Panel Data: A Comparison of Alternative Model Specifications. The JOllrnal 0/ Prodllctil'ity Analysis 7: 399-415
Aigner, D., C.A.K. Lovell, and P.Schmidt. 1977. Formulation and Estimation of Stochastic Frontier production Function Models. JOllrnal 0/ Economelrics 6: 21-37.
Battese. G.E. and T.J. Coelli. 1993. A Stochastic Frontier Production Function Incorporating a 1\lodel for Technical Inefficiency Effects. Working Paper in Econometrics, No. 69. University of New England, Armidale.
---. 1995. A Model for Technical Inefficiency Effects in a Stochastic Frontier Production Function for Panel Data. Empirical Economics 20: 325-332.
Saltese. G.E., S.J. Malik and M.A. Gill. 1996. An Investigation of Technical Inefficiencies of Production of Wheat Farmers in Four Districts of Pakistan. JOllmal of .Igricllltllral F.cunomics 47: 37-49.
FarrelL 1\1.J. 1957. The 1\leasurement of Productive Efficiency. JOllrnal of Royal Statistical Society Series A 120: 253-290 .
.lala-ud-Din. 198~. Problems and Prospects of Sericulture in orth-West Frontier Province .
.10111'171/1uf Rllml Dnelopment and Administration 14(3&4): I 1-22.
Guo. X.J. 1985. S·ericllltllre. The cOlISllllant Report ./i)r Sericllltllre. F.A.O. Project o. UTF PAK 1072/PAK 6-7.
Hanumappa. II.G. and Anatharaman. 1992. Economics ()IS'ilk Indllslly: .\Iicru I/lld .I/I/cm Isslles. Bangalore (I ndial: Institute for Social and Economic .Change.
Kalirajan. K. 1981. An Economics Analysis of Yield Variability in Paddy Production.
Canadian.1olll'l7al of agricllltllral Economics 29: 233-238.
1\leeusen. W. and van den Broeck. 1977. Efficiency Estimation from Cobb-Douglas production Functions \I'ith Composed Error. Il7Iemaliunal Ecollomic Re\'iell' 18: 435-444.
Nallldar and Khan. 1989. Economics
0/
Sericllltllre in 1'lInjab. Lahore: Punjab Economic Research Instilllte.Ngwenya. S .. G.E. Saltese and E.M. Fleming. 1997. The Relationship Between Farm Size and Technical Efficiency of Production of Wheat farmers in Eastern Orange Free State. South Africa ..Igrikon 36: 283-30 I.
Otsuka. K. 1982. The Transfer of Technology in Japan and Thailand: Sericulture and the Silk Industry. Oerelupment and Challge 13: 421-445.
Pakistan. Go,,!. of. 1998. Economic Survey 1997-98. Islamabad: Finance Division Economic Advisor's Wing.
Panda. R.C. 1995. Efficiency and Productivity the Case of Sericulture Farms in Tamil adu India. A Paper Presented in Australian Conference on Efficiency and Productivity, University of New England. Australia.
Qureshi, S.K. and G.M. Arif. 1999. Profile of POl'erty in Pakistan. A Working Paper Series in 'Micro Impact of Macro Adjustment Policies, Pakistan Institute of Development Economics, Islamabad.
Sabir, G. 1997. Sericulture Activities in Punjab. A Report Submitted to Govt. of Pakistan by the Punjab Sericulture Deptt. Lahore.
Siddique, S.K. 1988. Sericulture, Its Status and Potential in Pakistan. Progressive Farms 8(6):
5-9.
Yoshida, A. 1997. Strategy for Promoting Silk Culture, Integration (International Review of Population and Reproductive Health) No. 51: 36-41.