http://dx.doi.org/10.4236/am.2015.67104
Simple Linear Model of Tumor Growth in a
Changing Environment
Jose F. Nieves, Marcelo R. Ubriaco
Department of Physics, Laboratory of Theoretical Physics, University of Puerto Rico, San Juan, Puerto Rico Email: [email protected], [email protected]
Received 14 April 2015; accepted 14 June 2015; published 17 June 2015
Copyright © 2015 by authors and Scientific Research Publishing Inc.
This work is licensed under the Creative Commons Attribution International License (CC BY).
http://creativecommons.org/licenses/by/4.0/
Abstract
In an environment that is neither static nor in equilibrium, but is dynamic and changing, the ki-netics of the reactions that cause the growth of a tumor, which depend on the state of the evolving environment, cannot be parametrized in terms of constant rates. We propose a simple model for describing the growth on an untreated tumor in such environments, which is characterized by a minimal number of parameters and is generalizable to include the effects of various types of therapies. In the simplest version that we consider here, it consists of a linear equation with a time-dependent growth rate, which we interpret as the coupling of the system with a dynamic en-vironment. A complete solution is given in terms of the integral of the growth rate. The essential features of the general solution are illustrated with a few examples, and comparison is made with the models that have been proposed to describe recent data.
Keywords
Tumor Growth, Mathematical Modeling, Linear Models, Dynamic Environment, Minimal Parametrizations
1. Introduction
refer-ences to previous work can be traced back from the above papers and from [9]. In addition, including additional differential equations to model therapy have served as a guide to improve the effectiveness of treatment. There-fore, the common strategy along these lines of mathematical modeling of tumors consists in starting with a basic model represented by a nonlinear differential equation, such that by including additional terms in the original equation and introducing other differential equations, the different characteristics of the tumor and effects of therapy can be studied.
However, some of the models consist on generalizing another model by modifying a parameter in a way that seems to be motivated mostly by the fact of being able to fit certain data. For example, the so-called Generalized
Logistic model is the result of modifying the logistic equation by inserting a term that contains an arbitrary
power of the growth function. In a recent work [7], the authors find that this model is the best that fits their data, with taken to be a rather arbitrary noninteger number. In addition, in this model and the ones men-tioned above, the only solution is the trivial solution if the initial population value is specified as being zero. These nonlinear models may be of course appropriate for particular purposes. However the fact that they are not motivated by more fundamental principles makes it difficult to establish a connection between the observable effects that those models attempt to describe and more fundamental understandings of the mechanism of growth.
On the other hand, a few models of tumor growth that have been recently proposed, are based on assumptions and considerations that take into account basic physical principles, such as energy conservation, scaling, a fluc-tuating growth rate [10]-[13], and/or other features specific of the system under consideration. A succinct dis-cussion about cancer modeling that offers the author's insight into the various points of view regarding the ma-thematical modeling of tumor growth, together with a representative list of references, can be found in [14].
The main objective of this article is to present a basic model of growth of an untreated tumor in an environ-ment that is not static, nor in equilibrium, but is dynamic and changing. In such a case the kinetics of the reac-tions that cause the growth of the tumor, which depend on the state of the evolving environment, cannot be pa-rametrized in terms of constant rates. The model borrows some ideas from those mentioned above, contains a minimal number of parameters, and can be generalized to include other effects, such as those of therapies. In its simplest version, which we consider in some detail here, it consists of a linear first-order differential equation with a time-dependent growth rate, which we interpret as being due to the coupling of the system, the tumor in our case, with the dynamic environment. As argued in [14], simple models can give insights about the workings of detailed and more comprehensive models, and it is in this spirit that we present this class of models here.
As we show, the solution, which can be expressed in terms of an integral of the growth rate, reproduces the usual S-shaped form that vanishes at t=0 and eventually reaches an asymptotic form at large t. For illustrative purposes, we consider in Section 3 (Example 3), a specific application to some recent data reported in [7], and we show that our model can reproduce remarkably well the numerical fit that the authors make of their data. However, in contrast to the mathematical models mentioned above, the model proposed here contains a minimal number of parameters which have a concrete and well-defined meaning and are in principle determined if the interactions that govern the underlying microscopic mechanism of growth are known. We believe that this mod-el and the reasoning leading to it could in turn shed light on such mechanisms, and that it provides a firm footing for pursuing and extending this approach to consider in a simpler way a mathematical modeling of therapy and the case of multicellular populations.
The rest of this paper is organized as follows. In Section 2 we write down the model that we propose, we dis-cuss the framework that motivates it, the assumptions and idealizations involved, and the interpretation of the parameters that appear in it. In Section 3 the general solution to the equation is displayed, and it is illustrated by considering various specific examples that can be of practical use. In particular, here we confront the model with the data presented in [7] to illustrate how well it can fit that data with just one unknown parameter in the growth rate coupling. Finally, Section 4 contains our conclusions. As we discuss in that section in more detail, the ap-proach that we propose here has several attractive features that pave the way for further work. In particular, these linear models contain a minimal number of parameters. Those parameters are related to the interactions that govern the growth mechanisms, and therefore the model can in turn shed light on such mechanisms. In ad-dition, while in this paper we have restricted ourselves to the growth of an untreated tumor, similar ideas can be applied to include the effects of therapy.
2. The Model
which is not necessarily static. In situations in which the population function grows up to a certain asymptotic limit fs, we assert that the rate of change of the population is proportional to the difference between the actual
value of the population and its asymptotic limit, where the proportionality factor γ, as well as fs, depend on
the dynamical variables that describe the environment. In a changing environment, which includes the case in which the environment may be affected by the population itself, fs and γ change with time and the equation
is
( )
(
s( )
)
.f= −γ t f −f t (1)
In situations in which the environment is static, e.g., large enough that it is not affected by the population, γ and fs are constants and this equation is reminiscent of Newton’s cooling law which states that the rate of
change of the temperature of a system is proportional to the deviation of the system’s temperature from the temperature of its environment. In our context it may be possible and useful to give a motivation and justifica-tion of Equajustifica-tion (1) in terms of more basic principles as follows.
The problem of the time evolution of the population of a given specie appears in many physical contexts. Two basic principles that guide the development of a population are the Master Equation and the Principle of De-tailed Balance. The master equation takes the form
d , d
f W
t = (2)
where W depends on f itself and the other variables that describe the rest of the system with which the popula-tion can interact. W is decomposed into a series of terms, each of which represents the contribution due to a par-ticular process that causes the population to change. The principle of detailed balance states that there is a pre-cise relation between the so-called direct process and its inverse.
For example, let us consider a process in which only one cell participates and let us denote such process in symbols by
,
X
φ↔ (3)
where φ stands for a member of the population (a cell) and X stands for a different object. In the direct process, indicated by the right-pointing arrow, a cell φ disappears into X, while in the inverse process, indicated by the left-pointing arrow, the reverse is true. Then, denoting by γd and γi the rates for the direct and inverse
processes, respectively, their contribution to W is
(
)
1 s ,
W = −γ f − f (4)
where
.
d i
γ γ= −γ (5)
Similar equations also describe the kinetic approach to equilibrium of systems that are put in contact with a reservoir. In such cases, which are governed by physical kinetic equations, the Principle of Detailed Balance can be applied to establish a relationship between γi and γd. In our case we can envisage that, in principle, both
,
d i
γ could be calculated if the interaction between the cells with their surroundings and among themselves were known. However, we have at present no such theory of these interactions. Thus, we leave γ as an unknown parameter with the property that is a positive quantity.
The procedure outlined above for the case of single cell processes could be generalized to more complicated ones. For example, consider the processes in which two cells participate, which we denote in symbols by
.
X
φφ ↔ (6)
Because the direct process involves two cells, its rate is proportional to f2. By the same reasoning that lead us to write Equation (4), the contribution from these processes to W is of the form
(
2 2)
2 s ,
W = −γ′ f − f (7)
where γ ′ characterizes the rate for the process to occur.
equation
(
)
(
2 2)
d
,
d s s
f
f f f f
t = −γ − −γ′ − (8)
is a good starting point for further exploration of these ideas in the present context as well.
We are interested in the cases in which the environment can change, due to external influences or by its inte-raction with the population itself. For us this means that the parameters γ, γ ′ and fs that appear in Equation
(8), which depend on the state of the environment, change with time. In the absence of a dynamical theory of the interactions of the cells, all we can do is promote them to be functions of time.
In the present paper, we will restrict ourselves to the linear term only, as written in Equation (1). The assump-tion behind this approximaassump-tion is that the process in which the cells participate in pairs are rare compared to those in which only one cell participates. Should this linear approximation prove to be inadequate, it could indi-cate that the pair interactions are important and the quadratic terms in Equation (8) should be taken into account. Overall, we believe that this approach provides a framework for carrying a systematic analysis, based on incre-mental approximations, on a firm footing and in an organized fashion.
3. Solution
3.1. Static Environment
When γ and fs are constants, Equation (1) has the simple solution
( )
1 e 0e ,t t
s
f t = f − −γ + f −γ (9)
where f0 is the initial population, which can of course be taken to be zero. However, notice that the population
reaches the saturation limit fs independently of the initial value f0. This contrasts with the solution of the GL
model [7], which requires a non-zero value f0 or otherwise the solution is the trivial solution f t
( )
=0.3.2. Dynamic Environment
We consider the case in which the environment can change due to external influences, and therefore γ and fs
in Equation (1) are functions of time. In this case, Equation (1) is conveniently solved by the Green function method,
( )
0d( ) ( ) ( )
, s h( )
,f t =
∫
∞ t G t t′ ′ γ t′ f t′ + f t (10)where G satisfies
(
)
d
, d
G
G t t
t +γ =δ − ′ (11)
with δ
( )
x being the Dirac delta function. Furthermore, in Equation (10) fh is a solution to the homogeneousequation, chosen such that f satisfies the initial condition
( )
0 0.f = f (12)
A suitable Green function for Equation (1) is
( )
,(
) ( )
, ,G t t′ =θ t−t g t t′ ′ (13)
where θ
( )
x is the unit step function, and g t t( )
, ′ is the solution to the homogeneous equation( )
( ) ( )
d ,
, 0,
d
g t t
t g t t
t γ
′
′ ′
+ =
′ (14)
satisfying the condition g t t
( )
′ ′ =, 1. The function g t t( )
, ′ is then uniquely determined as( )
d ( ), e ,
t t t t
g t t′ ≡ −∫′ ′′γ ′′ (15)
( )
0d( ) ( ) ( )
, 0( )
, 0 . ts
f t =
∫
t g t t′ ′ γ t′ f t′ + f g t (16)Needless to say, if γ and fs are assumed to be constant, then Equation (16) reduces to the solution given
in Equation (9). But for any imaginable functions γ
( )
t and f ts( )
that could be used to parametrize thechanging environment, Equation (16) readily provides the complete solution in terms of two integrals.
A particularly simple form of the solution is obtained when fs is a constant. In this case, remembering that g
satisfies Equation (14), Equation (16) is trivially integrated and yields
( )
s 1( )
, 0 0( )
, 0 ,f t = f −g t + f g t (17)
where we have used g t t
( )
, =1.3.3. Examples
In order to illustrate some general features of the solution, we will consider below various specific cases.
3.3.1. Example 1
Let us assume that fs is a constant, while γ varies as some (integer) power of t; i.e.,
constant
s
f =
,
n
at
γ = 18)
where a is positive constant and n is a positive integer. First, from Equation (15),
( )
(
1 1)
0, e ,
n n t t
g t t γ
+ ′+
− −
′ = (19)
where we have defined
0 ,
1
a n
γ =
+ (20) for simplicity of the notation. The solution obtained from Equation (17) is then
( )
1 10 0
0
1 e tn e tn .
s
f t = f − −γ + + f −γ + (21)
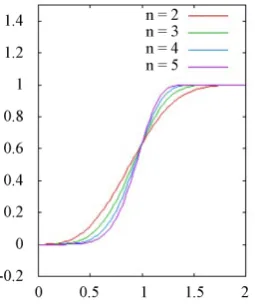
In Figure 1 we plot the function f fs , in arbitrary time units (i.e., setting γ =0 1), for the values of the
ex-ponent n=2, 3, 4, 5, and taking f0 =0.
3.3.2. Example 2
[image:5.595.236.364.533.687.2]As before, we assume that fs is a constant, but now take γ as a combination of two monomials; i.e.,
Figure 1. Plot of f t
( )
fs with f t( )
given by Equation (21), with the initial condi-tion f0=0, forn
at
constant,
s
f =
,
n m
at bt
γ = + (22)
where are n m, positive integers and a b, are positive constants. Following the same steps as above, the solu-tion obtained from Equasolu-tion (17) is given by
( )
(
0 1 0 1)
(
0 1 0 1)
0
1 e e ,
n m n m
t t t t
s
f t f γ γ f γ γ
+ ′ + + ′ +
− + − +
= − +
(23)
where γ0 is defined as in Equation (20) and in analogous fashion
0 .
1
b m
γ′ ≡
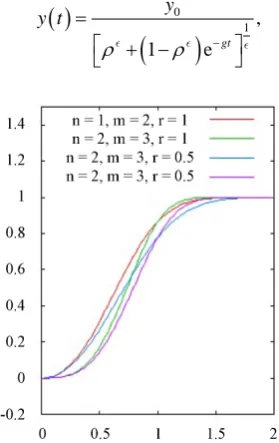
+ (24) In Figure 2 we plot the function f fs , for various values of n, m and the ratio r=γ γ ′0 0. We stress that,
apart from the initial and saturation values f0 and fs, respectively, the only unknown and adjustable
parame-ters of these models are the constants that appear in the ansatz for the growth rate function γ
( )
t , e.g. the con-stants a and b defined in Equations (18) and (22).3.3.3. Example 3
In order to make contact with experimental data, here we confront the model we have presented with the nu-merical results obtained with the model considered in [7]. We emphasize that we make this comparison to illu-strate how well our model can fit experimental data and with no other purpose. Although the model of [7] be-longs to the class of models that we have criticized in the Introduction as having some unphysical features, the fact that it fits the data well serves as a benchmark against which to compare numerically our model, or any oth-er model for that mattoth-er.
The model of [7] is defined by the equation
( ) (
)
1 y ,y t g y
K
= −
(25)
where y t
( )
denotes the growth function, r=g is the effective growth rate constant and K is called the carrying capacity. The solution is written in the form( )
(
)
0
1,
1 e gt
y y t
ρ ρ −
=
+ −
[image:6.595.229.369.463.685.2](26)
Figure 2. Plot of f t
( )
fs with f t( )
given by Equation (23), with the initialwhere
0
.
y K
ρ = (27)
Therefore, K determines the saturation limit, while y0 is the initial value. Equation (26) reproduces the
Gompertz function for =0, or the logistic function for =1, and in this sense it can be considered to be the most general function of this kind that possesses the appropriate asymptotic behavior and shape consistent with the observed data. A common characteristic of these models is that the differential equation, Equation (25), does not allow a zero population value at t=0.
In order to fit their data, the authors of [7] find
3
2139.3 mm ,
K=
1.65, =
1
0.206 days .
r=g = − (28)
In Figure 3, the solid line represents the function y for the values of the parameters given in Equation (28), and y0=5.5 in the same units as K. The broken line is the function f, where we have taken γ
( )
t to be givenby
4 0
5 t ,
γ = γ (29)
Which has the solution as given in Equation (21), with n=4, namely
( )
5 50 0
0
1 e t e t .
s
f t = f − −γ + f −γ (30)
For the plot in Figure 3, we have set f0 and fs equal to y0 and K respectively, and we have taken
8 5
0 5 10 days .
γ = × − −
(31)
Obviously, the function f t
( )
will be able to fit the data equally well, with the bonus that, apart from the ini-tial and saturation values f0 and fs, respectively, the only unknown and adjustable parameter of the solutionin our model is the constant γ0 that appears in Equation (29). Moreover, in contrast with the adjustable
para-meters that enter in Equation (26), the parameter γ0 characterizes the function γ which has a definite
physical interpretation in terms of the growth rate.
3.4. Generalizations
[image:7.595.230.371.521.661.2]By inspection, Equation (23) can be generalized in an obvious way to the case in which γ
( )
t is a power seriesFigure 3. Plot of f t
( )
given by Equation (30) with γ0 given in Equation (31), and y t( )
given by Equation (26) with the parameters given by Equation (28), taken from [7]. For the entire range of values, the plots of the two functions arein t. Although the models considered above, with fs taken to be a constant, already provide a flexible and rich
structure as far as their ability to fit the phenomenological data is concerned, it is possible to consider the cases in which fs is a function of t. In these cases it is not possible to give a closed expression for the solution given
in Equation (16), in general. However, in other physical contexts where similar equations and situations arise [15], some appropriate approximation methods have been used which could be employed in these cases as well.
4. Conclusions and Outlook
We have presented a model for the growth of an untreated tumor in an environment that is dynamic and not in equilibrium. In such environments, the equations that describe the kinetics of the reactions that cause the growth of a tumor, which depend on the state of the evolving environment, cannot be parametrized in terms of constant rates. The model we propose to study these cases is based on ideas borrowed from models used in some physical contexts, together with plausible assumptions and idealizations that pertain to the application at hand here. In the simplest version, the model consists of a linear first-order differential equation with a time-dependent growth rate, which we interpret as being due to the coupling of the system, the tumor in our case, with the dynamic en-vironment. As shown in Section 3, for that case a complete solution can be readily obtained in terms of an integral of the growth rate function. The solutions were given explicitly for a few sample cases, and they exhibit the known characteristic features of tumor growth. Moreover, the model was compared with the mathematical models that have been used to describe recent data, and it was shown that it can fit the data equally well, but without the unphysical features that those models have.
The approach that we have followed is fruitful in several ways. Firstly, the model contains a minimal number of parameters, which have a well-defined meaning, and are in principle determined by the interactions that go-vern the underlying microscopic mechanism. Secondly, this model could in turn shed light on such mechanisms, thereby providing a basis for pursuing this line of work. Thirdly, the model can be extended beyond the linear approximation that we have used if the terms that we have neglected are believed to be important in a particular system and the quadratic terms in Equation (8) should be taken into account. While in this paper we have re-stricted ourselves to treat the growth of an untreated tumor, similar ideas can be applied to include the effects of therapy.
References
[1] Laird, A.K. (1965) Dynamics of Tumor Growth: Comparison of Growth Rates. British Journal of Cancer, 19, 278-291.
http://dx.doi.org/10.1038/bjc.1965.32
[2] Norton, L., Simon, R. and Brereton, H. (1976) Predicting the Course of Gompertzian Growth. Nature, 264, 542-545.
http://dx.doi.org/10.1038/264542a0
[3] Norton, L. (1988) A Gompertzian Model of Human Breast Cancer. Cancer Research, 48, 7067.
[4] Calderon, C. and Kwembe, T. (1991) Modeling Tumor Growth. Mathematical Biosciences, 103, 97-114.
http://dx.doi.org/10.1016/0025-5564(91)90093-X
[5] Hart, D., Schochat, E. and Agur, Z. (1998) The Law Growth of Primary Breast Cancer as Inferred from Mammography Screening Trials Data. British Journal of Cancer, 78, 382-387. http://dx.doi.org/10.1038/bjc.1998.503
[6] Spratt, J.A., von Fournier, D. and Spratt, J.S. (1993) Decelerating Growth and Human Breast Cancer. Cancer, 71, 2013-2019, and references therein.
http://dx.doi.org/10.1002/1097-0142(19930315)71:6<2013::AID-CNCR2820710615>3.0.CO;2-V
[7] Dingli, D., Cascino, M.D., Josic, K., Rusell, J. and Bajzer, Z. (2006) Mathematical Modeling of Cancer Radiovirothe-rapy. Mathematical Biosciences, 199, 55-78, and references therein. http://dx.doi.org/10.1016/j.mbs.2005.11.001
[8] Araujo, R.P. and McElwain, D.L.S. (2004) A History of the Study of Solid Tumor Growth: The Contribution of Ma-thematical Modeling. Bulletin of Mathematical Biology, 66, 1039-1091. http://dx.doi.org/10.1016/j.bulm.2003.11.002
[9] Byrne, H.M., Alarcon, T., Owen, M.R., Web, S.D. and Maini, O.K. (2006) Modelling Aspects of Cancer Dynamics: A Review. Philosophical Transactions of the Royal Society A, 364, 1563-1578.
[10] Delsanto, P.P., Guiot, C. and Degiorgis, P.G. (2004) Growth Model for Multicelullar Spheroids. Applied Physics Let-ters, 85, 4225. http://dx.doi.org/10.1063/1.1812842
[11] Zhong, W.R., Shao, Y.Z. and He, Z.H. (2006) Pure Multiplicative Stochastic Resonance of a Theoretical Antitumor Model with Seasonal Modulability. Physical Review E, 73, 060902(R). http://dx.doi.org/10.1103/PhysRevE.73.060902
Review E, 74, 011916. http://dx.doi.org/10.1103/PhysRevE.74.011916
[13] Breward, C.J.W., Byrne, H.M. and Leweis, C.E. (2003) A Multiphase Model Describing Vascular Tumor Growth.
Bulletin of Mathematical Biology, 65, 609-640. http://dx.doi.org/10.1016/S0092-8240(03)00027-2
[14] Durrett, R. (2013) Cancel Modeling: A Personal Perspective. Notices of the AMS, 60, 304-309.
http://dx.doi.org/10.1090/noti953
[15] Berstein, J. (1988) Kinetic Theory in the Expanding Universe. Cambridge University, New York.
![Figure 3. Plot of f t( ) given by Equation (30) with γ given in Equation (31), 0and y t( ) given by Equation (26) with the parameters given by Equation (28), taken from [7]](https://thumb-us.123doks.com/thumbv2/123dok_us/8113172.791682/7.595.230.371.521.661/figure-equation-equation-given-equation-parameters-equation-taken.webp)
