Pattern Mining Method for Hospital Facility Review using
Optimized Nonlinear Mathematical Model
K.Janaki
Research Scholar, Mother Teresa Women’s UniversityN.Radhakrishnan, PhD.
Geocare Research Foundation,Chennai, India.
ABSTRACT
The development of discovering appealing, valuable and important patterns from large spatial datasets is stated as spatial data mining. From the preceding hospital location analyses technique, the locations are predicted from the hospital dataset using pattern mining technique. In terms of road weightage computation the location analyses technique is not enough in its performance. In order to improve the performance, a new hospital location analyses method is proposed in this paper with non linear mathematical model. The proposed method comprises of four major stages, namely, feature compilation, developed non linear mathematical model, selection of patterns (locations) by utilizing pattern mining and location analyses. Initially the features are collected from the historical dataset that are related to information on roads and the nearest hospital locations. Based on the assembled information a non linear mathematical model is developed for the roads. The non linear mathematical model is a developed model and this is optimized by the Genetic Algorithm (GA). This optimized non linear mathematical model is utilized in the hospital location analyses process. Thus our proposed technique successfully selects the hospital locality via optimized non linear mathematical model and pattern mining. The implementation results showed the effectiveness of the proposed hospital location analyses method in predicting the hospitals and the achieved improvement in the analyses result. Furthermore, the performance of the proposed technique is evaluated by comparing it with the previous hospital location analyses method.
Keywords
Spatial data mining, non linear mathematical model, Genetic Algorithm (GA).
1. INTRODUCTION
To produce necessary information, the enormous quantity of data that is accessible nowadays can be utilized competently. Medical science, Education, Business, Agriculture are some of the fields where the created information can be implemented. Immense amount of data is being collected together and stored in the databases. Traditional statistical techniques and database management tools are no more adequate for analyzing such huge quantity of data, [1]. In view of the fact that, Data Mining or Knowledge Discovery in Databases (KDD) enable us in analyzing data from diverse perspectives and abbreviating it into precious information, it has turn out to be one of the fast growing region of research [2] [11] [12]. It is also the junction of quite a few disciplines, collectively with statistical databases, AI, visualization, and high performance parallel computing [13]. A number of methodologies for data mining are available today that can be used in various application fields [21, 22]. Spatial data mining in particular plays a critical role in discovering patterns from the spatial database.
In this new world lot of improvements are greatly rising in spatial data acquisition, mass storage, volume of spatial data and network interconnection. The dealing out approaches of spatial data delay behind relentlessly, are not capable to find out relation and rules in massive quantity of data resourcefully and make full use of presented data to compute development trend though enormous data satisfied potential demands of exploring the earth’s reserve and environment by human being, widening utilizable information source [5]. An automatic finding of spatial knowledge is needed because of the quick growth of spatial data and large use of spatial databases. As more spatial data have been stored in spatial databases [8], the spatial data mining becomes more significant and attractive. Spatial data mining and spatial analysis techniques are performing a main role [6] in spatial database systems, to find out interesting but intrinsic patterns in spatial datasets of ever increasing size and difficulty. The process of finding out interesting and previously indefinite spatial patterns is spatial data mining. Extracting outstanding and functional patterns from spatial datasets is more problematic than extracting the analogous patterns from long-established numeric and categorical data [3] due to the difficulty of spatial data types, spatial relationships, and spatial autocorrelation.
The significant duty of spatial data mining is the extraction of spatial location patterns in wide applications. Spatial co-location and de-co-location patterns are identically [7] equal for positive and non positive association rules. Spatial data mining is commonly utilized in geographical information systems, geomarketing, earth observation, navigation, and different other areas. It is used for better understanding of relationships in data, for finding out unknown relationships among spatial and attribute data, and moreover for optimizing of spatial queries [4]. As decisions are finished based on big spatial datasets collectively with NASA, the National Imagery and Mapping Agency (NIMA), and the National Cancer Institute (NCI), capable tools for extracting information from geospatial data are necessary to organizations. Expansion across numerous application domains including ecology and environmental management, public safety, transportation, earth science, epidemiology, and climatology [9] [10] are done by these organizations. For the victorious prediction of hospital location a number of researches have been prepared. A few of the most new works obtainable in the literature are reviewed in the subsequent section.
2. RELATED WORK
mining techniques for the spatial database pertaining to an exacting geographical region. For the Latur district in Maharashtra state of India, the spatial database has been built. The utility of the database in the form of information discovery has been well-known visually in the geographical demonstration.
A skilled method with less computation, for the combination of the outputs of the different clusters has been analyzed by Anandhi et al. [15]. The planned layered merging technique has been discoursed, for spatial datasets and is utilized in clustering combination technique. Voting procedure has been used to assign labels for the clusters and resolving the correspondence problem as the partitions were ready from different clusters. They have eliminated the want for such voting by means of the same groups., Based on the cardinality and the set intersections, most possible cluster groups across dissimilar clusters have been grouped as matching pairs., When more than 50 percent of the clusters agree upon the groupings they have been resolute into the concluding partition. While they tour all along the layered merge, the degree of agreement (DOA) factor has been calculated based on the count of permitted clusters. The involvement of unresolved, unsettled data elements has been handled for the reduction of computational cost by means of the resourceful DOA at every layer. The getting back of the gained information in the preceding layers is an additional benefit of this proposed approach, thereby giving better cluster accuracy and strength.
A Multi-label spatial categorization based on association rules with multi objective genetic algorithms (MOGA) made rich by semi supervised learning was proposed by Arunadevi et al. [16]. The purpose is for dealing with quite a lot of class labels problem. Problem transformation has been personalized for the multi label classification. Development of spatial association rules enabled a mixture evolutionary algorithm helpful for the optimization, which addresses single label. The single labels are merged into multi labels by MOGA by means of the contradictory objectives analytical accuracy and unambiguousness. Partially supervised learning has been accomplished all the way through the course of rule cover clustering. Associative classifier has been built through a sorting method for conclusion. The results have been compared with MOGA based associative classifier after the algorithm has been simulated and better performance was found than the existing one.
The learning of present methods of KDD has been explained by Fawzi Elias Bekri et al. [17]. By applying data mining methods for healthcare and public health, it was done and the dilemma and difficulties related with data mining and healthcare in living out has too mentioned. The exercise of data mining has improved beside with the examination of healthcare institutions during examination and as a result the health policy set was the superlative, identified disease caused and guard deaths in hospital and verifies the unfair insurance declaration.
Prasad et al. [18] have well thought-out the conditions of spatial data mining and formulated the perceptible k adjacent neighbor (VkNN) query solutions as incremental algorithm by means of two variants contradicting in how to lessen objects during the search process. One variant applies visibility pruning mutually to objects as well as index, while another variant applies visibility pruning merely to objects. The second has outperformed the earlier results has been discovered by the execution results. They have more planned an aggregate VkNN query based on a collective distance function, which finds the perceptible k adjacent objects to a set of query points. Two approaches are followed by it for dealing out the aggregate
VkNN query. Based on the collective visible distance metric, one accesses the database via multiple VkNN queries, while the other issues an aggregate k adjacent neighbor query to acquire back the objects from the database and then re-rank the consequences with comprehensive experiments.
The Michigan Community hospitals are assigned with allotting different populations and making available a full series of medical procedures which have been discussed by Pariwate Varnakovida et al. [19]. A number of healthcare amenities were built in the direction of serveing huge local populations (e.g. Detroit); others were planned to give local coverage across less populated areas (e.g. Alpena). The precise settings of the hospitals were directed by a wide-ranging of geographical and historical factors at the time each facility’s construction. The distribution of population, the physical characteristics of available sites, and the individual and political circumstance of the instant are included here. It seems rather possible in Michigan, that the factors leading to the progress of today’s spatial gathering of 139 community hospitals were mostly neighborhood and restricted to every individual hospital. To build up a revised community hospital approval method, a multi-organization committee headed by the State of Michigans Department of Community Health appealed the authors with questions regarding how spatial analyses may be utilized. The State was troubled with identifying populations with prolonged drive times to presented community hospitals especially. To guess travel time, by taking into account factors such as distance to nearby hospital and road network concentration, the methods used in this research specify access to existing hospitals statewide. Limited access areas (LAA) are the areas falling exterior of a particular time entry. The state policy was this principle in the review of new community hospital proposals. To identify some of the spatial complexities associated with the demand and the convenience dimensions of health care access and justice are given by the results that helped the policymakers.
Spatial data mining is potentially relevant patterns from the colossal spatial datasets however is a method of drawing out the exciting and previously unidentified.
In literature, many methods were developed to improve the security level in database from illicit access, which are briefly discussed in the following section 2. In the previous hospital location analyses technique, the locations are predicted from the hospital dataset using pattern mining technique. This method performs three processing stages namely, feature compilation, roads weightage computation and selection of patterns (locations) by utilizing pattern mining. The feature compilation process is performed with the hospital dataset, and road weightage computation process is accomplished by a weightage formula. The weightage formula is applied to each road, based on that value the roads are extracted and given to the pattern mining. The location analyses technique is inadequate in its performance in terms of road weightage computation. Because the road weightage computation formula is linear i.e. the input parameters in the weightage formula is varied, so the corresponding road weightage value is also varied at high level. So we can’t predict the road weightage value. Moreover, the weightage computation formula is effortless and it very easy to learn. So, to avoid these negative aspects, a new hospital location analyses method is proposed in this paper.
optimization technique called Genetic Algorithm(GA). Followed by this, the pattern mining process is also carried out on the historical dataset. By utilizing these pattern mining process and optimized mathematical model, the hospital location is to be predicted. The outline of the paper is as follows: The proposed hospital location analyses process is briefly explained in section 3. In section 3.1, feature compilation process is explained and with this information a nonlinear mathematical model is given in section 3.2. The section 3.3 and 3.4 explains pattern mining and location analyses process. The experimental result and conclusion of this paper is given in Section 4 and 5.
3. HOSPITAL LOCATION ANALYSIS
TECHNIQUE
The hospital location analyses technique is proposed with non linear mathematical model and pattern mining process. The proposed method analyses the hospital location by getting the information from the available historical dataset and the information from datasets are given to the developed mathematical model. Based on the mathematical model and the pattern mining process, the hospital location is analyzed. The proposed method includes four processing stages namely, feature compilation, non linear mathematical model, selection of patterns (locations) using pattern mining and location analyses. These four stages are consecutively applied to the historical dataset for obtaining an exact location.
3.1 Feature Compilation
The well-organized features are extracted from the given historical datasets in feature collection process. At this point, we uphold three datasets namely, hospital list, accidental prone zone areas, and accident places. LetHbe the hospital datasets, which contains four fields namelyHnan,Lonn,Latn,An that are represented as,
N n n A n Lat n Lon n Hna
H {( ),( ),( ),( )}; 1,2, (1) Where, Hnan,Lonn,Latn,Anrepresent the hospital name, longitude, latitude, and address of nthhospital in the hospital dataset, respectively, and Nrepresents the size of the hospital dataset i.e., the number of hospitals in the dataset. The
accidental prone zones Pzcontains three fields namely, }
, , {Rnai Pi Zi z
P (2) Where, Rnai,Pi,Zirepresents the name of the road, Pincode value, and the corresponding zone number of the ithroad in the accidental prone zone dataset. Similarly, accidental place Ap contains eight fields namely,
} , , , , , , ,
{Rnai Ti Pei Byi Twi Ci Bi Tai p
A (3)
Where Rnai,Ti,Pei,Byi,Twi,Ci,Bi,Tairepresents the name of the road, total number of accidents, number of occurrences of accident by pedestrian, bicycle, two wheeler, car, bus and total number of people affected.
The hospital name and address are extracted from the datasetH from these three datasets, then the hospital address following pincode values and road names are extracted from the dataset
z
P , and finally, the accidental values subsequent to road names are mined from the datasetAp. These extracted values are assembled in a dataset namedF and is represented as,
K k N j k Ta k B j k C kj Tw j k By j k Pe k T k P j k Rna j Lat j Lon j Hna F j j j , }; , , , , , , , , , , , { (4)
In Equ. (4), Pekjdenotes the pedestrian value of kthroad th
j hospital. The non linear mathematical model is improved based on these values, which is explained in the following sub section.
3.2 Non Linear Mathematical Model
By utilizing the information which is extracted from the feature compilation process, the non linear mathematical model is modified. Along with these extracted features, seven feature values namely,
j j j Pekj Bykj Twkj Ckj Bk Tak k
T , , , , , , is
used in the mathematical model creation. The developed mathematical model is,
kx k Ta kx k B kx j k C kx k Tw kx j k By kx j k Pe kx k T X x x m k Y j j j j j exp 1 1 1 0 (5)Where, Yk m
j represents the th
k road jthhospital weight value, Tkj,Pekj,Bykj,Twkj,Ckj,Bkj,Takj is the kth road total number of accidents, number of occurrences of accidents through pedestrian, bicycle, two wheeler, car, bus and
total number of affected people in the corresponding road.
x
and
kx
are the initial weights to be optimized. Themathematical model is optimized by selecting the bestx and best X best best 1 , , , 1
0
values to make it get the optimal data.
Genetic Algorithm is used to perform the optimization process. Genetic algorithm is used in numerous applications such as inventory management [23], revenue management [24], bioinformatics [25] and many more.To acquire the best data, the GA carries out five basic processes: i) Chromosome Generation, ii) Fitness function, iii) Crossover, iv)Mutation , and v) Termination. The procedures that are involved in the optimization process are described below.
1. Generation of chromosomes: Generate a population pool
1 , , 1 , 0
; l Np l
P where,Np is the pool size, in which each chromosome is of lengthL1. The chromosome length
1
L indicates the number of genes i.e., the number of weights to be optimized such asL1,
x
and0,1,,X1. Each gene value of every chromosome is an arbitrary number generated within the interval[0,1].2. Fitness Function: Evaluate the fitness of the population pool
using the below mentioned formula,
j j Yk
m k Y l F
2 (6)
where, j k
SelectN p /2 chromosomes that have maximum fitness value from the population pool and place them in the selection pool.
3. Crossover: Perform single point crossover operation with
crossover probability
c
r
. The crossover operation exchanger c
N. genes between two parent chromosomes and produces 2
/ p
N children chromosomesch; h0,1,,Np/21. Where Nis the number of parameters we have utilized in the mathematical model, which is given in Equ. (5).
4. Mutation: Perform uniform random mutation operation with
a mutation probability
m
p
. In the mutation technique, auniform random integer is generated and replaced in N.mp random positions of
c
h
, and newh
c is produced.
5. Termination: The resultant new
h
c and the selection pool chromosomes are placed in the population pool and the process is repeated until the termination criterion is met. In our case, the termination criterion is a set that reaches a maximum number of repetition of process. Once the maximum number of process repetition takes place, the process is terminated and the
chromosome (can be represented as bestx and best X best best 1 , , , 1
0
), which has maximum fitness, in the
population pool is extracted.
The obtained best weights from the optimization process are substituted in Eq. (5) to derive the final mathematical model as,
best k Ta best k B best j k C best k Tw best j k By best j k Pe best kx k T X x best x m k Y kx j kx j kx kx j kx kx j j exp 1 1 1 0 (7)The non linear optimized mathematical model is utilized in the high sensitive road computation process.
3.3 Patterns Mining
The patterns are extracted from the datasetF following the mathematical model progress. In pattern extraction process, the valuesPek,Byk,Twk,Ck,Bkare used and the attained dissimilar combination length of patterns are stored in the variableDP{lm};m2,M, where lmis the m-length pattern.These dissimilar arrangement length extracted patterns are given to the clustering process. We have taken dissimilar arrangement of patterns having dissimilar length in clustering process. By performing K-means clustering these dissimilar combinations of patterns are clustered.
K-Means Clustering: A method of cluster analysis is known to be k-means clustering, which aims to separate observations into number of clusters in which each observation belongs to the cluster with the adjacent mean [20]. The clustered centroid values for dissimilar combination of length patterns from the clustering method are given as
Cc{co2,c3ocmo};m2,M,o1,2,O (8) Later by scheming the score value for every cluster we discover the high sensitive road by utilizing the subsequent formula,
1 Pe By; m
c
w om if m2 (9)
Likewise, the score values are calculated for other patterns too. Then, we find the high scored cluster which is having the maximum score value. The superlative cluster value is represented as, } , , { ' ' ' 3 '
2 om
o o c w c w c w
W (10)
3.4 Location Analysis
By exploiting the non linear optimized values and the elevated scored cluster score values, the position analysis process is carried out. We discover the sensitive road by using the formula in location analysis, which is mentioned below,
2 ' o m j c w k Y j
s (11)
Where,
j k
Y - is the non linear optimized value of the road k
' o m
c
w - High scored cluster
In addition, we find that the consequent road
k
count values from the dataset which is represented asuk. The road value from the dataset is calculated by, uk* k
t (12) Where,
k
u - is the count value of the road k
- is the constant value
Following the above, we find the road which is very sensitive from other roads,using the subsequent formula,
k t k s if R k s k t if E SR ; ; (13)
In Equ. (13), if the value
t
k
is greater than the values
k
, thehospital facility in the corresponding road is adequate or else the hospital facility in that area is necessary. We examine different hospitals in different locations in our planned technique and at last, we propose that for particular locations, the hospital facility is sufficient or not based on the information from the obtainable datasets. The results from our planned technique and the accessible dataset execution are explained in the subsequent section.
4. RESULTS AND DISCUSSION
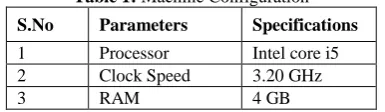
Table 1: Machine Configuration
S.No Parameters Specifications
1 Processor Intel core i5
2 Clock Speed 3.20 GHz
3 RAM 4 GB
[image:5.595.307.545.93.214.2]Three datasets values namely, hospital list, accidental prone zones, accidental places has been used in our system. The accidental particulars are acquired in the year of 2006 to 2010 and these datasets values are gathered for Chennai the study area. Corresponding roads accidental information were gathered and kept in the accident data for every hospital. In the earlier work the datasets used in our work is illustrated. In the feature extraction method these datasets are used. The extracted values from the datasets are set to the non linear mathematical formula. This formula is progressed by the NN(Neural Network) and the optimal values are got from the GA technique. In the location analyses process the optimal weights values from our non linear mathematical formula are used. Later the, patterns are extracted in dissimilar arrangement length. The extracted patterns in two, three, four and five length arrangement are demonstrated in the subsequent tables.
Table 2: Sample Two Length Extracted Patterns
S.No Pedestrian Bicycle
1 344 72
2 33 11
3 84 12
4 53 9
5 40 13
6 112 28
7 101 30
8 249 65
9 40 13
[image:5.595.317.534.329.562.2]10 164 23
Table 3: Sample Three Length Extracted Patterns
S.No Pedestrian Bicycle Cars
1 344 72 276
2 33 11 21
3 84 12 39
4 53 9 38
5 40 13 29
6 112 28 34
7 101 30 48
8 249 65 106
9 40 13 29
10 164 23 89
Table 4: Sample Four Length Extracted Patterns
S.No Pedestrian Bicycle Cars Two wheeler
1 344 72 276 365
2 33 11 21 70
3 84 12 39 103
4 53 9 38 81
5 40 13 29 40
6 112 28 34 105
7 101 30 48 138
8 249 65 106 264
9 40 13 29 40
10 164 23 89 191
Table 5: Sample Five Length Extracted Patterns
S.No Pedestrian Bicycle Cars Two wheeler Bus
1 344 72 276 365 50
2 33 11 21 70 2
3 84 12 39 103 0
4 53 9 38 81 3
5 40 13 29 40 1
6 112 28 34 105 13
7 101 30 48 138 6
8 249 65 106 264 22
9 40 13 29 40 1
10 164 23 89 191 10
These patterns are extracted and applied in a K-Means clustering for each combination length patterns. Subsequently, in location analysis process we analyze the location whether those locations have satisfied the hospital facility or those locations require more hospitals in the particular area. The results which are obtained from our proposed technique are given in Table 6.
Table 6: Results from Our Proposed Non Linear Mathematical
Model Based Hospital Location Analyses Technique
S.No Road Name Suggestion
1 Poonamallee High Road Enough
2 New Avadi Road Enough
3 Santhome High Road Enough 4 Radhakrishnan Salai Enough
5 LB Road Enough
6 Durgabai Deshmulk Road Enough
7 EH Road Enough
8 Ennore Express Road
Masthan Koil Enough
9 SP Road Enough
10 Arcot Road Enough
11 Rajaji Salai Enough
12 SN Chetty Street Required
13 ECR Road Enough
14 Velacherry Main Road Required
15 EVR Salai Enough
16 100 Feet Road Required
17 Anna Salai Required
18 CTH Road Required
19 Thiruvotiyur High Road Required
The performance of our proposed technique is evaluated by comparing our proposed non linear mathematical model results with the previous work hospital location result values. The previous hospital location analysis technique results are given in Table 7.
Table 7: Results from Our Existing Hospital Location Analyses
Technique
S.No Road Name Suggestion
1 EVR Salai Enough
2 CTH Road Required
3 100 Feet Road Required
4 Anna Salai Required
5 Thiruvotiyur High Road Required
6 New Avadi Road Enough
7 SP Road Required
8 Arcot Road Required
[image:5.595.64.278.333.468.2] [image:5.595.55.286.496.619.2]10 LB Road Enough 11 SN Chetty Street Required
12 ECR Road Required
13 Velacherry Main Road Required
14 Ennore Express Road
Masthan Koil Required 15 Poonamallee High Road Enough 16 Santhome High Road Enough 17 Radhakrishnan Salai Required
18 Durgabai Deshmulk
Road Required
19 EH Road Required
Our non linear mathematical model based hospital location analyses technique performance is compared with the existing hospital location analyses technique by changing the constant
[image:6.595.62.281.72.201.2]
value as 10, 20, 30, 40 and 50. By increasing the values, the hospital location analyses decision values are also be changed. The comparison result of our proposed and existing hospital location analyses is shown in Fig. 1 and 2, where Proposed Technique uses Non Linear Mathematical Model and Existing Technique uses Linear Mathematical Model.Figure 1: Comparison Graph of our proposed and existing
technique with appropriate hospital facility
Figure 2: Comparison Graph of our proposed and existing
technique without appropriate hospital facility
It can be seen from figure 1 and 2, that our proposed technique analyzes more accurately the hospital facilities in different locations than the existing technique. In Fig. 1, our proposed technique finds 70% of the locations with appropriate hospital facility but the existing technique finds only 30% of the locations, at this stage when the value of sensitivity factor is 0.02. By increasing the sensitivity factor value to 0.025, 0.03, 0.05 and 0.1 the hospital location facility analyses process is becoming very stiff i.e. when the sensitivity factor value
reaches 0.1 our proposed and existing technique states that only 20% and 5% of locations have appropriate hospital facility. In Fig. 2, our proposed technique results in 30% of the locations not having appropriate hospital facility but the existing shows 70% of the locations not having appropriate hospital location facility. When increasing the sensitivity factor values our proposed and existing techniques gives 80% and 95% locations that wanted more hospital facility in the specified locations. This analyzes results show that our proposed technique approximately finds the hospital facility in hard circumstances.
5. CONCLUSION
In this paper, the hospital location analyzes technique with non linear mathematical model was proposed to find the exact hospital location based on the historical datasets. In this proposed methodology, the newly developed non linear optimized mathematical model was utilized to find the most important roads and these mathematical model result values were given to the pattern mining process. By using the developed non linear mathematical model and pattern mining process, the hospital location was analyzed. All these processes have improved the performance of the proposed hospital location analyses technique. The results have shown that the proposed technique with non linear mathematical model and pattern mining process have achieved high analyses results in tough circumstances. Thus, our proposed hospital location analyses technique has offered better performance in analyzing the hospital location than the existing hospital location analyses technique.
6. REFERENCES
[1] Dr. Varun Kumar and Anupama Chadha, "An Empirical Study of the Applications of Data Mining Techniques in Higher Education", International Journal of Advanced Computer Science and Applications, Vol. 2, No. 3, pp. 80-84, March 2011
[2] Ehsan Hajizadeh, Hamed Davari Ardakani and Jamal Shahrabi, "Application of data mining techniques in stock markets: A survey", Journal of Economics and International Finance, Vol. 2, No. 7, pp. 109-118, July 2010
[3] Ravikumar and Gnanabaskaran, "ACO based spatial data mining for traffic risk analysis", International Journal of Computational Intelligence Techniques, Vol. 1, No. 1, pp. 6-13, 2010
[4] Karel, Janecka, Hana and Hulova, "Using Spatial Data Mining to Discover the Hidden Rules In the Crime Data", In Proceedings of Symposium on GIS Ostrava, 2011
[5] Kodge and Hiremath, "Detection of Spatial Changes using Spatial Data Mining", Advances in Information Mining, Vol. 2, No. 2, pp-14-18, 2010
[6] Manikandan and Srinivasan, "Mining Spatially Co-Located Objects from Vehicle Moving Data", European Journal of Scientific Research, Vol. 68 No. 3, pp. 352-366, 2012
[7] Yan Huang, Hui Xiong, Shashi Shekhar and Jian Pei, "Mining Confident Co-location Rules without A Support Threshold", In Proceedings of the ACM Symposium on Applied Computing (SAC), Melbourne, FL, USA, pp. 497-501, 2003
0 5 10 15
0.02 0.025 0.03 0.05 0.1
L
o
ca
tio
ns
w
it
h
a
pp
ro
pria
te
H
o
spita
l
F
a
cilit
y
(
in %)
Sensitivity Factor
Propos ed …
0 5 10 15 20
L
o
ca
tio
ns
w
it
ho
ut
a
pp
ro
pria
te
H
o
spita
l
F
a
cilit
y
(
in %)
Sensitivity Factor
[image:6.595.54.294.321.452.2] [image:6.595.53.294.491.623.2][8] Martin Ester, Hans-Peter Kriegel and Xiaowei Xu, "Knowledge Discovery in Large Spatial Databases: Focusing Techniques for Efficient Class Identification", In Proceedings of the Fourth International Symposium on Large Spatial Databases (SSD 95), Portland, Maine, USA, Lecture Notes in Computer Science, Springer, 1995
[9] Sumathi, Geetha and Sathiya Bama, "Spatial Data Mining - Techniques Trends and Its Applications", Journal of Computer Applications, Vol. 1, No. 4, pp. 28-30, 2008
[10] Rajesh, "Application of Spatial Data Mining for Agriculture", International Journal of Computer Applications, Vol. 15, No. 2, pp. 7-9, 2011
[11] Arabinda Nanda and Saroj Kumar Rout, "Data Mining & Knowledge Discovery in Databases: An AI Perspective", In Proceedings of national Seminar on Future Trends in Data Mining, Bhubaneswar, 2010
[12] Joyce Jackson, "Data Mining: A Conceptual Overview", Communications of the Association for Information Systems, Vol. 8, pp. 267-296, 2002
[13] Adeel Ansari and Seema Ansari, "The Concept of Data mining, Its Applications & Issues", Jouranl of Engineering and Sciences, Vol. 4, No. 1, pp. 26-30, 2010
[14] Hiremath, Kodge and Mankari, "Extraction and Visualization of Geospatial data from Spatial Database: A Case Study", BIOINFO Systems Engineering, Vol. 1, No. 1, pp. 06-10, 2011
[15] Anandhi and Natarajan Subramanyam, "Efficient Consensus Function for Spatial Cluster Ensembles: An heuristic layered approach", In Proceedings of International Symposium on Computing, Communication, and Control, Singapore, Vol. 1, pp. 112-117, 2011
[16] Arunadevi and Rajamani, "Multi Label Spatial Semi Supervised Classification using Spatial Associative Rule Mining and Evolutionary Algorithms", Computer Science & Information Technology, pp. 197–210, 2011
[17] Fawzi Elias Bekri and Govardhan, "Association of Data Mining and Healthcare Domain: Issues and Current State of the Art", Global Journal of Computer Science and Technology, Vol. 11, No. 21, December 2011
[18] Prasad, Manoj Kumar and Pavitra, "Spatial Data mining Evaluation of visible Nearest Neighbor Query", International Journal of Computer Science and Technology, Vol. 2, No. 2, pp. 266-275, June 2011
[19] Pariwate Varnakovida and Joseph P. Messina, "Hospital Site Selection Analysis", In Proceedings of the IMAGIN annual Conference, 2006
[20] Singh, Malik and Sharma, “Evolving Limitations in K-Means Algorithm in Data Mining and their Removal”, International Journal of Computational Engineering & Management, Vol. 12, pp. 105-109, 2011
[21] Aloysius George, D. Binu, “DRL-PREFIXSPAN A Novel Pattern Growth Algorithm for Discovering Downturn, Revision and Launch (DRL) Sequential Patterns”, Central European Journal of Computer Science, springer, vol. 2, no. 4, pp. 426-439, December 2012.
[22] Maragatham G & Lakshmi M “A strategy for Mining Utility based Temporal Association Rules”, TISC 2010 ,Proceedings of the 2nd International Conference on Trendz In Information Sciences and Computing, Dec 17-19,2010. DOI :978-1-4244-9009-7/10 IEEE Xplore
[23] Aloysius George,B. R. Rajakumar and D. Binu, "Genetic algorithm based airlines booking terminal open/close decision system", In proceedings of the International Conference on Advances in Computing, Communications and Informatics, pages 174-179, 2012
[24] Radhakrishnan, P., Prasad, V.M., and Gopalan, M.R, "Genetic Algorithm Based Inventory Optimization Analysis in Supply Chain Management", IEEE International on Advance Computing Conference, pp. 418 - 422, 2009.
[25] Pradhan, M., Pattnaik, S., and Mittra, B., "Effective Classification Technique by Blending of PPCA and EP-Enhanced Supervised Classifier: Classifies Microarray Gene Expression Data", American Journal of Scientific Research, No. 11, pp.60-71, 2010.