Extraction of Texture Information from Fuzzy Run
Length Matrix
Y. Venkateswarlu
Head Dept. of CSE&IT Chaitanya Instituteof Engg. &Tech.,Rajahmundry, India.B. Sujatha
Assoc. prof., Dept. of Computer Science & Engg. Godavari Institute of Engg.&
Tech.,Rajahmundry, India.
V. Vijaya Kumar,
PhD. Dean Dept.of Computers, Godavari Institute of Engg.&Tech., Rajahmundry, India.
ABSTRACT
For a precise texture classification and analysis, a run length matrix is constructed on the Local Binary pattern using fuzzy principles in the present paper. The proposed Run Length Matrix on Fuzzy LBP (RLM-FLBP) overcomes the disadvantages of the previous run length methods of texture classification that exist in the literature. LBP is a widely used tool for texture classification based on local features. The LBP does not provide greater amount of discriminate information of the local structure and it has a various other disadvantages. The main disadvantage of LBP is, that it compares the centre pixel value with its neighbors to derive the one of the three possible values {0, 1, 2}. The basic drawback of this comparison is that it is very sensitive to noise. And a major contrast between the central pixel and its surroundings are easily resulted by the slight fluctuations above or below the value of the Centre Pixel (CP) and its surroundings. To overcome this problem and to represent the missing local information effectively in the LBP, the present study introduced the concept of fuzzy logic on LBP. This overcomes the problem related to noise and contrast. The proposed method initially converts the 3×3 neighborhood in to fuzzy LBP. In the second stage the proposed method constructs the Run Length Matrix on Fuzzy LBP (RLM-FLBP). On these RLM-FLBP texture features are evaluated for a precise texture classification.
Keywords: Run Length Matrix, Fuzzy LBP, Centre Pixel,
Local Structure..
1.
INTRODUCTION
Galloway proposed the use of run length matrix for texture feature extraction [1]. The run length matrix proposed by Galloway has not been widely used as an effective texture classification and analysis method, because these run length features are proved to be the least efficient texture features among a group of traditional texture features such as co-occurrence features, the grey level difference features etc…. To overcome this, the present thesis investigated a new approach that is derivation of run lengths on FLBP.
The Local Binary Pattern (LBP) approach has evolved to represent a significant breakthrough in texture analysis, outperforming earlier methods in many applications. Perhaps the most important property of the LBP operator in real-world applications is its tolerance against illumination changes. Another equally important is its computational simplicity, which makes it possible to analyze images in challenging real-time settings.
Image texture analysis is an important fundamental problem in computer vision. During the past few years, several authors have developed theoretically and computationally simple, but very efficient nonparametric methodology for texture analysis
based on LBP [2, 3, 4, 5, 6, 7, 8, 9]. The LBP texture analysis operator is defined as a grayscale invariant texture measure, derived from a general definition of texture in a local neighborhood. For each pixel in an image, a binary code is produced by thresholding its value with the value of the center pixel. A histogram is created to collect up the occurrences of different binary patterns. The basic version of the LBP operator considers only the eight neighbors of a pixel, but the definition has been extended to include all circular neighborhoods with any number of pixels. [10, 11, 12] Through its extensions, the LBP operator has been made into a really powerful measure of image texture, showing excellent results in terms of accuracy and computational complexity in many empirical studies. The LBP operator can be seen as a unifying approach to the traditionally divergent statistical and structural models of texture analysis. Perhaps the most important property of the LBP operator in real world applications is its tolerance against illumination changes. Another equally important is its computational simplicity, which makes it possible to analyze images in challenging real-time settings.
That’s why the LBP method has already been used in a large number of applications all over the world, including visual inspection, image retrieval, remote sensing, biomedical image analysis, face image analysis, motion analysis, environment modeling, and outdoor scene analysis. The present study developed run length matrix on fuzzy LBP.
The present paper is organized as follows. The section two describes Representation of LBP. Section 3 describes derivation of the proposed RLM-FLBP and the computation of texture features, section four is for experimental analysis and conclusions are described in section five.
2.
Representation of LBP
The present section introduces the basic concept of LBP. It is a gray-scale invariant texture measure computed from the analysis of a 3×3 local neighborhood over a central pixel. The LBP is based on a binary code describing the local texture pattern. This code is built by thresholding a local neighborhood by the gray value of its center.
0, otherwise it is assigned the value 1 as described by the Equation (1).
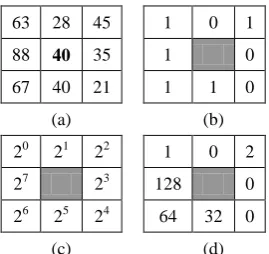
{ and (1) di is the obtained binary code, Pi is the original pixel value at position i and P0 is the central pixel value. The Fig.1(a) shows the grey level values of a 3×3 neighborhood of an image. And the Fig.1(b) shows its corresponding binary labeling based on Equation (1). The binary weights of the given 3×3 neighborhood are calculated by the Equation (2).
∑
As each element of LBP has one of the two possible values, the combination of all the eight elements results in 28 = 256 possible local binary patterns ranging from 0 to 255. There is no unique way to label and order the 255 LBP on a 3×3 neighborhood.
63 28 45 1 0 1
88 40 35 1 0
67 40 21 1 1 0
(a) (b)
20 21 22 1 0 2
27 23 128 0
26 25 24 64 32 0
(c) (d)
Fig.1 (a) Sample Grey level Neighborhood (b) Conversion of Fig.1 (a) into Binary Neighborhood (c) Representation of Fig.1 (a) Binary Weights (d) Represented Values with
Binary Weights.
Fig.1 shows an example on how to compute LBP. The original 3×3 neighborhood is given in Fig.1(a). The central pixel value is used as a threshold in order to assign a binary value to its neighbors. Fig.1(b) shows the result of thresholding the 3×3 neighborhood. The obtained values are multiplied by their corresponding weights as shown by Fig.1 (c). The result is given in Fig.1(d). The sum of the resulting values gives the LBP measure which is 227 in this case the central pixel 40 is replaced by the obtained LBP value 227. A new LBP image is constructed by processing each pixel and its 3×3 neighbors in the original image. The binary weights of Fig.1(c) can be given in eight different ways.
3.
The Proposed Method of Run Length
Matrix on Fuzzy Local Binary Pattern
(RLM-FLBP)
The major problem of the above approach of LBP is it fails in dealing accurately with the regions of natural images in the presence of noise, contrast, illumination changes and the different processes of caption and digitization. For example, even if the human eye perceives two neighboring pixels as equal, they rarely have exactly the same intensity values. However, the desirable situation would be that the LBP of homogeneous images contain more number of ones because the human eye can perceive ones. That is LBP takes a value 1 for any difference (min to max) of values. Therefore, if there is lack of ones, the basic LBP will take only 0 value, which means that the real number of possible textures are 28, i.e., 256. To overcome the above, the fuzzy membership
function is introduced by the present study on LBP. To have more visual clarity on difference of values between central pixel and neighboring pixel fuzzy logic is established, which give a set of values between 0 to 1 as {0, 0.1, 0.2, 0.3, 0.4, . . . , 1} on the LBP neighborhood.
Fuzzy logic has certain major advantages over traditional Boolean logic when it comes to real world applications such as texture representation of real images. The main difference between the fuzzy and the classic logic is that statements are no longer 0 or 1 in fuzzy, but assume any real value between 0 and 1, that allows more human-like interpretation and reasoning.
The incorporation of fuzzy logic by the present study into the LBP approach includes the transformation of the input variables to respective fuzzy variables, according to a set of fuzzy rules. Based on this assumption the present paper derived fuzzy rules on 3×3 LBP neighborhood to describe the relation between the intensity values of the neighboring pixels Pi and the center pixel P0 in a more human perception view point. The fuzzy rules of the present approach on LBP are given below.
Rule 0: The more negative is, the greater the certainty that di is 0.
Rule 1: The more positive is, the greater the certainty that di is 1.
These two rules are rewritten in terms of two membership functions are defined in Equations (3) and (4) as follows:
{
(3)
{
(4)
where is a decreasing function, is an increasing function, ∆G [0,255] represents a parameter that controls the degree of fuzziness. Finally, for a commitment between reliability and accuracy, the membership functions provide the membership degrees to which a pixel is lighter or darker than the central pixel of a 3×3 LBP raster window. Using the above fuzzy functional rules, the Fuzzy Local binary Pattern (FLBP) of the neighboring pixels is given by Equation (5).
{(
) ( ) ( )}
(5) The Equation(4) can be rewritten as in Equation(6)
{(( ) ⁄ ) (( ) ⁄ )
((
) ⁄ )
}
By the above equations the FLBP converts a 3×3 window neighboring pixel values into the FLBP set, i.e., FLBP {0, 0.1, 0.2, 0.3, 0.4, . . . ,1}. The average membership values of FLBP neighboring pixels are useful for characterization of textures. But sometimes it is difficult to evaluate. To address this difficulty the present approach derived Run length matrix (RLM) on the FLBP of the image. By RLM-FLBP a set of points are obtained and each set has its own run length entropy dimension as described below.
[image:2.595.100.235.265.392.2](i,j) of the FLBP image. This may produce an n number of RLM-FLBP, which may become a complex procedure for texture analysis. To address this, the present paper concised the number of RLM-FLBP based on some lag value as described below. The proposed method derived five different RLM-FLBP’s. The RLM-FLBP1 contains the run length values for zero and RLM-FLBP2 contains the run length values from 0.1 and 0.3, RLM-FLBP3 contains the run length values from 0.4 and 0.6, RLM-FLBP4 contains the run length values from 0.7 and 0.9, RLM-FLBP5 contains the run length values of 1 respectively. The Fig.2 and Fig.3 explains the proposed method of generating five RLM-FLBP images is as follows:
[image:3.595.55.282.325.571.2]Fig.2: Fuzzy Local Binary Pattern (FLBP) Image.
Fig.3: Five different RLM-FLBP’s on FLBP image of Fig.2.
The proposed RLM-FLBP derived five fuzzy run-length matrices such as RLM-FRLM1, RLM-FRLM2, RLM-FRLM3, RLM-FRLM4, RLM-FRLM5, which are unique variations of the fuzzy run-length matrix. Finally, five fuzzy run-length matrices are combined to form a single matrix called as RLM-FLBP.
3.1
Computation of Texture Features
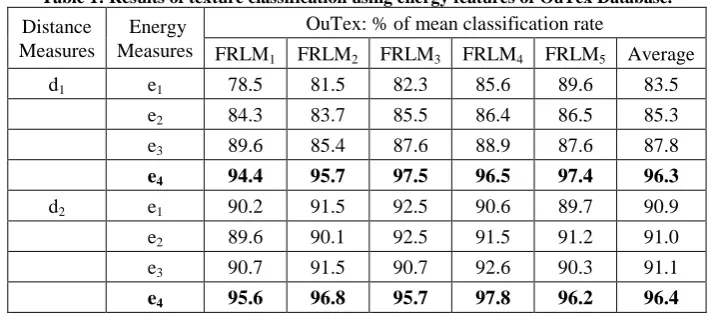
Two sets of texture features are derived from RLM-FLBP for texture classification. The first set of features used from the FRLM (Weska et al., 1976 [13]) is average energy (e1), energy (e2), entropy (e3) and standard deviation (e4)) as in Equations (7)-(10) and the second set of features obtained contains higher order statistics [13] include Small numberEmphasis (N1), Large number Emphasis (N2), Non Uniformity (N3) and Second Moment (N4) as given in Equations (11)-(14). These features are stored in the features library.
Norm-1/ Average Energy (e1)=
2 1 1 ) , ( 1
M k L si k s
FRLM L
M
(7)
Norm-2/Energy (e2) =
M k L si
k
s
FRLM
L
M
1 1)
,
(
1
(8)Entropy(e3) = 1 ( , ) log( , )2) 2 1 1 s k s k FRLM L M M k L s i
(9)
Standard Deviation (e4)= 2
1 1 ) ) , ( ( 1 Mean s k FRLM L M M k L s i
(10)Small number Emphasis
8 1 9 1 8 1 9 1 2 1 ) , ( ) / ) , ( ( k s i k s i s k FLRM s s k FLRM N (11)Large number Emphasis
8 1 9 1 8 1 9 1 2 2 ) , ( ) ) , ( ( k s i k s i s k FLRM s s k FLRMN (12)
Non Uniformity
8 1 9 1 2 8 1 9 1 3 ) , ( ) , ( k s i k s i s k FLRM s k FLRM N (13) Second Moment
8 1 9 1 8 1 9 1 2 4 ) , ( )) , ( ( k s i k s i s k FLRM s k FLRMN (14)
4.
Experimental Results
Experiments are carried out to demonstrate the effectiveness of proposed RLM-FLBP method for texture image classification. The proposed method is experimented with OuTex [14] and Granite [15] color image databases, as given in Fig.1.1 and 1.2 respectively. To do classification, the texture images are first divided into non-overlapping windows of size 32×32 and the resulting windows are then divided into two disjoint sets, one for training and one for testing. Two distance classifiers (Manhattan distance (d1) and Euclidean distance (d2)) are used to choose the best classification technique with the proposed RLM-FLBP. The classifier computes the distance between the features for each sample and that of the texture classes and assigns the unknown sample to the texture class with the shortest distance. The classification results for each of the two feature sets are shown in Table I, Table II, Table III and Table IV respectively.
The first observation is that the performance of the two tests is affected very much by different choices of energy measures. For example, standard deviation is more suitable for the proposed RLM-FLBP features than any other norm. Thus, when testing textures extracted from the OuTex album, the best performance is achieved by having the statistical measure (e4) and the distance measure (d2). The second observation is based on higher order statistical features. It is observed that the features N1 and N2 are also resulting in good classification rate. Therefore the present paper considers e4 from feature set-1 and N1, N2 from feature set-2 for classifying textures. Similarly, by observing the features of second dataset (Granite album) e4 perform high accuracy than the other energy features. And the features N1 and N2 are also resulting in good classification rate. By the above observations the proposed study concludes that the features of
0 1 0 0 0 0 1 0 3 2 1 0 0 0 2 1 0 0 2 1 0 0 0 0 0 0 0 0 0 0 0 0 0 0 1 0 0 0 0 0 0 0 0 0 0 0 0 0 0 0 0 0 0 0 0 0 0 2 1 0
0 0 0 0 0 0 0 0 0 0 0 0 0 0 0 0 0 0 0 0 0 0 0 0 4 3 2 1 0 0 0 0 0 0 0 0 0 0 0 0 0 0 0 0 3 2 1 0 0 0 0 0 0 0 3 2 1 0 0 0
0 0 0 0 0 0 0 0 0 0 0 0 0 0 0 0 0 0 0 1 0 0 0 1 0 0 0 0 0 1 RLM-FLBP1 RLM-FLBP2
RLM-FLBP3 RLM-FLBP4
RLM-FLBP5
0.1 0 0.2 0.2 0.2 0.9
0.3 0.3 0 0 0.7 0.6
0.5 0.6 0.6 0.6 0.3 0.4
0.8 1 0.8 0.9 0.9 1
e4, N1 and N2 form a good feature set. Table V summarize the overall classification accuracy using two datasetsof two classifiers and also two feature sets.
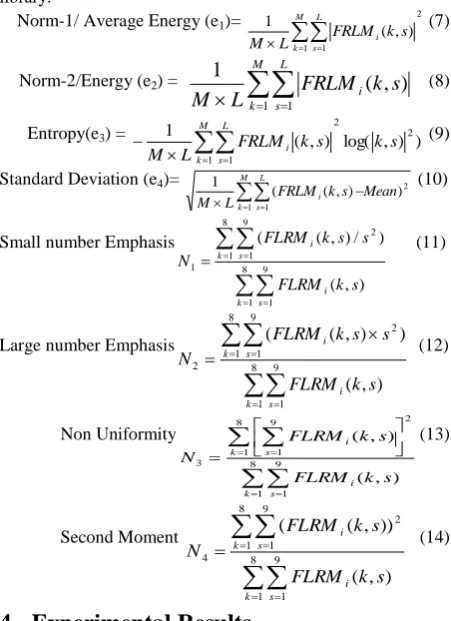
Table 1: Results of texture classification using energy features of OuTex Database.
Distance Measures
Energy Measures
OuTex: % of mean classification rate
FRLM1 FRLM2 FRLM3 FRLM4 FRLM5 Average
d1 e1 78.5 81.5 82.3 85.6 89.6 83.5
e2 84.3 83.7 85.5 86.4 86.5 85.3
e3 89.6 85.4 87.6 88.9 87.6 87.8
e4 94.4 95.7 97.5 96.5 97.4 96.3
d2 e1 90.2 91.5 92.5 90.6 89.7 90.9
e2 89.6 90.1 92.5 91.5 91.2 91.0
e3 90.7 91.5 90.7 92.6 90.3 91.1
e4 95.6 96.8 95.7 97.8 96.2 96.4
Table 2: Results of texture classification using higher order statistical features of OuTex Database.
Distance Measures
Higher order statistical
features
OuTex: % of mean classification rate
FRLM1 FRLM2 FRLM3 FRLM4 FRLM5 Average
d1 N1 88.5 86.5 84.5 86.7 90.5 87.3
N2 86.7 85.5 87.5 86.4 86.5 86.5
N3 89.6 85.4 87.6 88.9 87.6 87.8
N4 94.4 96.7 96.5 98.5 98.4 96.9 d2 N1 96.4 97.6 96.5 94.9 99.7 97.0 N2 95.6 95.5 97.5 96.5 98.2 96.6
N3 91.0 85.5 90.7 92.6 90.3 90.0
N4 90.2 90.4 91.7 90.8 90.2 90.7
Table 3: Results of texture classification using energy features of Granite Database.
Distance Measures
Energy Measures
Granite: % of mean classification rate
FRLM1 FRLM2 FRLM3 FRLM4 FRLM5 Average
d1 e1 80.3 80.5 79.3 85.6 93.6 83.9
e2 85.5 80.6 86.5 89.6 92.5 86.9
e3 87.5 86.3 90.4 90.7 79.5 86.9
e4 97.4 95.5 96.3 95.6 96.4 96.2
d2 e1 89.5 93.5 94.5 90.6 90.7 91.8
e2 90.5 89.7 93.5 91.5 89.5 90.9
e3 91.6 92.5 92.5 92.4 89.6 91.7
e4 97.6 96.5 96.7 97.5 98.2 97.3
Table 4: Results of texture classification using higher order statistical features of Granite Database.
Distance Measures
Higher order statistical features
Granite: % of mean classification rate
FRLM1 FRLM2 FRLM3 FRLM4 FRLM5 Average
d1 N1 90.6 90.5 90.8 86.7 90.5 89.80
N2 91.5 89.6 91.5 86.4 86.5 89.10
N3 89.5 90.5 87.6 90.4 87.6 89.12
N4 94.4 99.7 96.5 96.5 97.4 96.87 d2 N1 96.6 97.6 93.5 95.6 98.5 96.36 N2 96.5 96.5 94.5 98.5 96.8 96.55
N3 90.6 94.5 91.5 94.8 91.3 92.54
Table 5: Mean classification rate of selected features of two datasets.
Distance Measures
Energy Measures
OuTex: % of mean
classification rate
Granite: % of mean
classification rate
d2
e4 96.4 97.3
N1 97.0 96.7
N2 96.6 96.5
Average 96.7 96.8
4.1
Comparison of the Proposed
RLM-FLBP with other Methods
Table 5 shows the mean percentage classification rate for two datasets of texture images by using the proposed RLM-FLBP. Other existing methods of gray level run length matrix are by Xiaoou Tang [16] and binary run length matrix by Ramana Reddy etal [17]. These methods are applied on VisTex, Marble texture databases and are represented in Table 6. From Table 6, it is clearly evident that, the proposed RLM-FLBP exhibits a high classification rate than the existing methods. The graphical analysis of the percentage mean classification rate for the proposed RLM-FLBP and other existing methods are shown in Fig.4.
Table 6: Comparison of the proposed RLM-FLBP method with other existing methods
Database/ Method VisTex Marble
Traditional Run Length by Xiaoou Tang
[16] 97.40 95.56
Binary Run Length by Ramana Reddy
etal[17] 95.66 95.86
Proposed Method: Fuzzy Run Length 97.85 96.94
5. CONCLUSIONS
The proposed RLM-FLBP overcomes the disadvantages of the previous Run length matrices for texture classification. In the proposed approach Run lengths are evaluated on the fuzzy LBP. LBP is an efficient tool in the proposed approach overcomes the traditional problems of LBP on noise, contrast and illumination changes. The proposed approach reduced the number of different Run length matrices by considering the lag value on the FLBP image. The proposed RLM-FLBP shows a better performance when compared to existing methods.
6.
ACKNOWLEDGMENTS
The authors would like to express their gratitude to Sri K.V.V. Satya Narayana Raju, Chairman, and K. Sashi Kiran Varma, Managing Director, Chaitanya group of Institutions for providing necessary infrastructure. Authors would like to thank anonymous reviewers for their valuable comments and Dr. G.V.S. Ananta Lakshmi for her invaluable suggestions which led to improvise the presentation quality of this paper
7.
REFERENCES
[1] M. M. Galloway, “Texture analysis using gray level run lengths,” Comput. Graphics Image Process., vol. 4, pp. 172–179, June 1975.
[2] Ahonen T., Hadid A. and Pietikainen M., “Face Recognition with Local Binary Patterns,” Computer Vision, ECCV Proceedings, pp. 469-481, 2004.
[3] Ahonen T., Pietikainen M., Hadid A. and Maenpaa T., “Face Recognition Based on the Appearance of Local Regions,” 17th International Conference on Pattern Recognition III: pp. 153-156, 2004.
[4] Feng X., Hadid A. and Pietikainen M., “A Coarse-to-Fine Classification Scheme for Facial Expression Recognition,” Image Analysis and Recognition, ICIAR 2004 Proceedings, Lecture Notes in Computer Science 3212 II: pp. 668-675, 2004.
[5] Feng X., Pietikainen M. and Hadid A., “Facial Expression Recognition with Local Binary Patterns and Linear Programming,” Pattern Recognition and Image Analysis 15 pp. 550-552, 2005.
[6] Hadid A., Pietikainen M. and Ahonen T., “A Discriminative Feature Space for Detecting and Recognizing Faces,” IEEE Conference on Computer Vision and Pattern Recognition II: pp. 797-804, 2004. [7] Heikkila M., Pietikainen M. and Heikkila J., “A
Texture-Based Method for Detecting Moving Objects,” The 15th British Machine Vision Conference I: pp. 187-196, 2004. [8] Takala V., Ahonen T. and Pietikainen M., “Block-Based Methods for Image Retrieval Using Local Binary Patterns,” Image Analysis, SCIA 2005 Proceedings, Lecture Notes in Computer Science, 2005.
[9] Turtinen M. and Pietikainen M., “Visual Training and Classification of Textured Scene Images,” 3rd International Workshop on Texture Analysis and Synthesis pp. 101-106, 2003.
[10]Maenpaa T. and Pietikainen, M., “Texture Analysis with Local Binary Patterns,” Handbook of Pattern Recognition and Computer Vision, 3rd edn. World Scientific pp. 197-216, 2005.
[11]Ojala T., Pietikainen M., Harwood D., “A Comparative Study of Texture Measures with Classification Based on Feature Distributions. Pattern Recognition,” pp. 51-59, 1996.
[12]Ojala T., Pietikainen M., Maenpaa T., “Multiresolution Gray-Scale and Rotation Invariant Texture Classification with Local Binary Patterns,” IEEE Transactions on Pattern Analysis and Machine Intelligence 24 pp. 971-987, 2002.
[13]J. S. Weszka, C. R. Dyer, and A. Rosenfeld, “A comparative study of texture measures for terrain classification,” IEEE Trans. Syst., Man, Cybern., vol. SMC-6, pp. 269–285, 1976.
[15]Antonio Fern´andez, Ovidiu Ghita, Elena Gonz´alez, Francesco Bianconi, Paul F. Whelan, “Evaluation of robustness against rotation of LBP, CCR and ILBP features in granite texture classification,” Machine Vision and Applications, 2011.
[16]Xiaoou Tang, “Texture Information in Run-Length Matrices,” IEEE, pp: 1602-1609, 1998.