1
2018 International Conference on Computer Science and Software Engineering (CSSE 2018) ISBN: 978-1-60595-555-1
An AR Operation and Maintenance System
for Data Center
Changyu He, Xifa Song, Ying Rao, Chao Wu and Bo Zhang
ABSTRACT
This thesis proposes an operation and maintenance system based on Augmented Reality (AR) technology using in data center equipment room. It includes two subsystems: AR inspection, AR maintenance. The functions include data management during inspection and maintenance; intelligent guidance of inspection operations; all-round identification and display of equipment front-end and back-end data; data tracking and recording of the whole maintenance process; remote expert maintenance assist in real time. It effectively solves the practical problems of low efficiency in traditional operation and maintenance, missed inspection, and high labor costs in operation and maintenance. In addition, this thesis also describes a research case. A traditional operation and maintenance system without AR technology was developed to compare the user experience with the AR operation and maintenance system (AR-OM system). Through actual user feedback data, this thesis makes a detailed analysis of AR technology for data center inspection efficiency and user experience enhancement.
INTRODUCTION
The safe operation of a data center is faced with the reality of “more, bigger, higher and less”. "More" is mainly reflected in more equipment. "Bigger" mainly refers to the larger scale of system, numerous information systems and modules. "Higher" is mainly due to high real-time requirements and high security requirements. "Less" is mainly reflected in the reduction of staff engaged in
Changyu He, Ying Rao, Chao Wu, China Electronic Science Research Institute, China Electronics Technology Group Corporation, 100041
operation and maintenance and the reduction of operation and maintenance tools. The current operation and maintenance work can only rely on the daily inspections of the operation and maintenance staff to find hidden dangers. It is impossible to conduct comprehensive online and offline monitoring of the system operation status, and the efficiency is low and the work is boring.
At present, AR technology has become increasingly mature. There have been many applications and systems [1][2][3] in such area as inspection, maintenance. Using AR technology in data center operation and maintenance can improve the operation and maintenance efficiency and reduce the labor.
Traditional data center inspection mainly inspects the appearance of the equipment and uses paper to record. The work efficiency is relatively low. Through observing the indicators, network ports and other status cannot get the information such as CPU, memory usage, temperature and humidity and other deeper background information in real time; For a large amount of data generated during the inspection process, there is
no intelligent and relevant analysis for full and effective use; Even if you follow the standard operation completely, it is difficult to guarantee that there is no omission. Maintenance staff cannot effectively communicate with remote experts when dealing with complex technical problems.
The AR operation and maintenance system (AR-OM system) communicates data with the operation and maintenance management system, power and environmental monitoring system, etc. through the AR glasses. It can view the various resource data in the network as a whole and realize virtual integration with the real machine room through data visualization. Based on the image recognition and environmental tracking technology of AR glasses, the equipment signals and operating status can be quickly identified. The inspection staff can perform inspection on the equipment one by one according to the guidance of the AR glasses. The AR glasses can automatically alert the faulty equipment to prevent the inspection staff from missing the equipment during the inspection process. AR-OM system provide the function of remote assistance. When the on-site operation and maintenance staff cannot solve the complex technical problems, live video can be transmitted to the remote expert in real time through AR glasses. Experts can communicate with on-site operation and maintenance staff and provide directions through devices such as tablet computers and desktop computers. Remote assistance helps in reducing the high costs of the expert and also long downtimes due to travel [4].
SYSTEM DESIGN AND METHODS
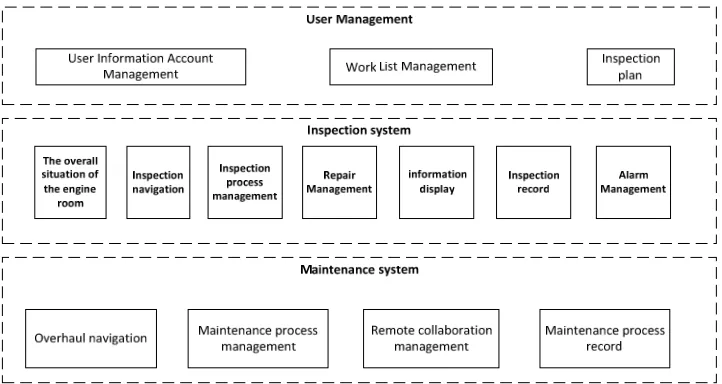
includes three functional modules: user management, inspection system, maintenance system, etc. It consists of three client programs (AR glasses client APP, iPad client, PC console client) and server-side programs.
System Function Design
USER MANAGEMENT SYSTEM
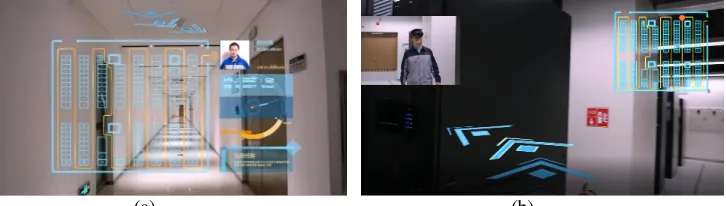
The user management system includes user information account management and worklist management. Information account management means that the inspection information entered through the PC console client can be synchronized to the AR glasses in real time. The inspector can use AR glasses to view the identity information such as the inspector's name and employee number. Worklist management means that the user can use AR glasses to view the current task list and today's work contents directly (Figure1(a)). Worklist management includes inspection worklist and maintenance work list.
INSPECTION SYSTEM
The inspection system includes seven basic functions. (1) View the overall situation of the data center; (2) equipment room positioning and inspection guidance; (3) inspection process management; (4) front and rear information display; (5) inspection recording; (6) alarm management; (6) process recording. View the overall situation of the data center. Users can view the overall operation of the equipment room in real time, such as the temperature and humidity of an equipment room, and the operation situation of all equipment.
(a) (b)
[image:3.612.130.493.487.590.2]Figure 2. The composition of the system.
Equipment room positioning and inspection guidance: Based on the spatial scanning and spatial positioning technology, the AR glasses (HoloLens) can calculate the position of the inspector in the real equipment room in real time and map it to the 2D equipment room map to achieve real-time positioning. Based on this positioning technology, the AR inspection system can implement inspection guidance by superimposing virtual three-dimensional navigation arrows in the equipment room.
Inspection process management: The list of inspection tasks corresponding to the inspection task of the equipment room is displayed in the AR glasses. The inspection task list contains all the inspection procedures. By identifying the devices involved in the inspection task, the virtual task information is superimposed on the real device to assist the user to perform inspection quickly. When an inspection task is completed, the inspection task list is automatically ticked, indicating that a single inspection task is completed and the next inspection task is started. If finding a problem during the inspection process, use AR glasses to send a repair requirement. After entering the repair requirement interface, the user can choose to take a photo to record or using voice to record.
(a) (b)
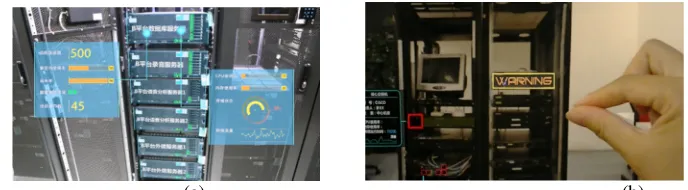
Figure 3. (a) A list of inspection tasks . (b) Repair function: the user can choose to take a photo to record or using voice to record.
(a) (b)
Figure 4. (a) Superimposes the visualization front-end and back-end information on a real device. (b) the warning prompt superimposed in front of the abnormal device.
Automatic alarm function: The background server performs real-time detection of the system-integrated sensor status. If an abnormality is found, the alarm will be pushed to the AR glasses. The inspector can see the warning prompt superimposed in front of the abnormal equipment and view the detailed fault.
Inspection process record: During the inspection process, AR glasses record the first-person video of the inspection process in real time and transmit it to the background. The management staff can also use the console program to view the real-time video directly. After the inspection is completed, the AR inspection system automatically generates an inspection report. The inspection report includes inspection staff information, date, normal equipments, repaired equipments and equipments to be repaired.
MAINTENANCE FUNCTION
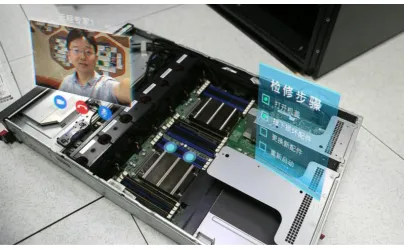
[image:5.612.140.470.83.208.2] [image:5.612.129.473.243.338.2]check the device-related documents and instructions or refer to maintenance video updated by other maintenance staff. (3) Remote collaboration management. If maintenance staff meet problems that can't be solved, they can call the remote expert by the AR glasses. The remote expert can view the live video in real time by connecting AR glasses with the iPad or the computer client. The remote collaboration supports two-way communication of voice and video. The remote expert client has the function of labeling. The remote expert can use the labeling function to draw circles and points on the live video screen. At the same time, the maintenance staff can see the virtual labeling information superimposed on the real device through the AR glasses. Using the labeling system can facilitate the communication between experts and maintenance staff. (4) inspection process recording. AR glasses can take videos of the maintenance process and save them. (5) After the maintenance is completed, an maintenance form will be generated.
USER RESEARCH
Traditional Operation and Maintenance System (NOR-AR system)
It aims to study the impact of using AR technology on the data center operation and maintenance system. While keeping the basic function of the operation and maintenance system unchanged, we used iPad to replace the AR glasses and developed a non-AR data center operation and maintenance system. After removing AR technology, the non-AR system data cannot be superimposed on the actual equipment. The following are the design details of the non-AR system.
The overall situation of the data center: The non-AR system uses the 2D room floor plan to view the operation of all the equipments, and visualize the room data through on the 2D display.
[image:6.612.196.400.539.664.2]equipment room location and navigation functions: In order to achieve a similar positioning function with the AR-OM system, Nor-AR version uses UWB (Ultra Wideband) to locate the indoor positioning. In addition to holding the iPad, the inspector has to carry additional UWB positioning tags.
Process management and alarm management: The non-AR version manually determines whether the device is normal by scanning the 2D interface of the 2D barcode pop-up task list on the cabinet. If there is a warning, iPad will push a warning message. The inspector needs to find the abnormal equipment based on the equipment name and location shown in the message.
Front-end and back-end information display of the equipment. In the equipment list, users need to search for and select the specific equipment type, and then can view the front-end and backend information of the equipment.
Remote collaboration: Non-AR version can only use the rear camera of iPad for video and voice calls.
Experiment Process
We recruited 28 data center operation and maintenance professionals to participate in the experiment. Using the control experiment, 14 people participated in the AR group (using AR operation and maintenance system, AR-OM system), and the remaining 14 people participated in the non-AR group (using non-AR operation and maintenance system). The following table shows the mean and variance of age and work experience for the two groups in experimenters. We use two-sample Wilcoxon rank-sum (mann-whitney) test[6]. There was no significant difference in age (P=0.11). There was also no obvious difference in operation and maintenance work experience (P=0.026). The result shows that volunteers in the AR and non-AR groups have similar work experience and skills.
We used 2 HoloLens (AR group) and 2 iPad pro (non-AR group) to do experiments. We cooperated with a bank's customer service center and selected 200 cabinets in the core equipment room for inspection experiment. We artificially set up a equipment abnormality alarm (indicative failure alarm for air conditioning), and two equipment failures that need to be repaired (Hard disk and memory problems. It is needed to replace new parts and configure the server) in the experiment. Inspectors must complete routine inspections of all 200 cabinets and repair abnormal equipment. After completing the inspection work, they need to fill out the experience survey questionnaire [7].
TABLE I. THE COMPARISION OF AGE AND WORKING YEARS BETWEEN TWO GROUPS.
Variable Name Non-AR AR P value
(two-tailed)
Median Deviation Median Deviation
Age 25.9 1.23 26.2 1.35 0.11
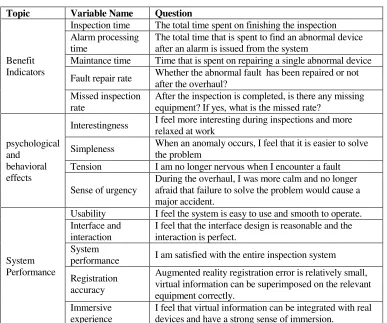
TABLE II. LIKERT SCALE DESIGNED FOR THE EXPERIMENT.
The questionnaire consists of three topics: benefit indicators, psychological and behavioral effects, and system performance. Benefit indicators include inspection time, alarm processing time, maintenance time, fault repair rate, and missed inspection rate. The system performance is about the evaluation of system images, functions, interactions, and superposition of AR. Psychological and behavioral infects are related to whether the system makes the user feel less tedious, easier to repair, and calmer in the face of unexpected situations. The benefit indicators counts the data of each sub-item directly. For both the psychological and behavioral effects and the system performance, the participants need to respond to a series of statements designed using the Likert scale of 1-7 points. 1 represents completely disagreeing, and 7 represents complete agreement. As shown in table I.
Experiment Results
The questionnaire included 15 variables. Based on the statistical data and the scores of participants' Likert scales, the medians, inter-quartiles, and Wilcoxon rank-sum tests of two sets of statistical significance for each of the variables were calculated
Topic Variable Name Question
Benefit Indicators
Inspection time The total time spent on finishing the inspection Alarm processing
time
The total time that is spent to find an abnormal device after an alarm is issued from the system
Maintance time Time that is spent on repairing a single abnormal device
Fault repair rate Whether the abnormal fault has been repaired or not after the overhaul?
Missed inspection rate
After the inspection is completed, is there any missing equipment? If yes, what is the missed rate?
psychological and
behavioral effects
Interestingness I feel more interesting during inspections and more relaxed at work
Simpleness When an anomaly occurs, I feel that it is easier to solve the problem
Tension I am no longer nervous when I encounter a fault
Sense of urgency
During the overhaul, I was more calm and no longer afraid that failure to solve the problem would cause a major accident.
System Performance
Usability I feel the system is easy to use and smooth to operate. Interface and
interaction
I feel that the interface design is reasonable and the interaction is perfect.
System
performance I am satisfied with the entire inspection system
Registration accuracy
Augmented reality registration error is relatively small, virtual information can be superimposed on the relevant equipment correctly.
Immersive experience
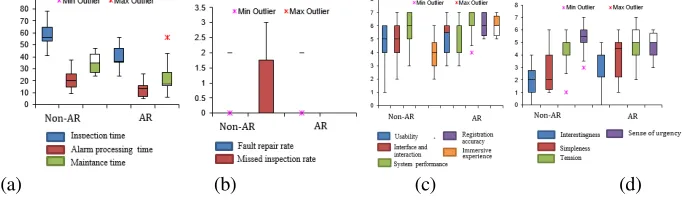
separately, as shown in table II. The box-plots for each variable are also plotted, including medians, inter-quartile ranges, and full ranges.
BENEFIT INDICATORS
As shown in table II and figure 6(a), for variables such as inspection time (minutes), maintenance time (minutes), and alarm processing time(minutes) , the AR group has a lower median value, and the maintenance time and alarm processing time of the AR group also has a lower interquartile range, and the p-value of the inspection time and alarm processing time is less than 0.05, has significant differences with Non-AR group. However, for the maintenance time, p=0.07>0.05. There was a max outlier in the AR group. After removing the max outlier [8],the result of the Wilcoxon rank-sum (Mann-Whitney) test was P=0.012<0.05. There was a significant difference between the AR group and the Non-AR group, indicating that the inspecting and maintance efficiency (inspection time, alarm processing time, and maintenance time)
has been improved significantly. For the quantity of fault repairing and missing inspection eqiupments, the AR group and Non-AR group have the same median value and the similar IQR, and the P value are both greater than 0.05. No significant differences are found. Both AR and Non-AR groups can perform maintenance tasks well, and most of the participants inspected all the eqiupments. But we found that four volunteers in the Non-AR group had missed to inspect the eqiupments, and only one volunteer in the AR group had missed.
PSYCHOLOGICAL AND BEHAVIORAL EFFECTS
The AR-OM system has a large number of data visualizations, knowledge bases, and voice prompts to reduce the tediousness of inspection operations and allow field operation and maintenance staff handle abnormalities better. As we expected, tableIII and figure6(d) show that the users of the AR group give a higher subjective rating than users of the Non-AR group for the two variables of interestingness and simpleness. There was a significant difference between the two groups of data.
[image:9.612.121.467.563.669.2](a) (b) (c) (d)
When participants responded that whether they felt nervous when they encountered eqiupments abnormalities, both the AR and Non-AR groups gave similar subjective ratings, with P=0.061>0.05, no significant difference between AR and Non-AR group. When responding the sense of urgency during the maintenance process, the Non-AR group had a higher median and a lower interquartile range, p=0.04<0.05. Therefore, Non-AR systems give users more sense of urgency.
SYSTEM PERFORMANCE
[image:10.612.106.481.352.657.2]It can be seen from table III and figure6(c) that there is no significant difference in the overall satisfaction level and usability between the AR group and the Nor-AR group. For the interface interaction, participants in the AR group had a higher subjective rating, with p=0.04<0.05. The AR system uses gestures and voice interactions to make it easier to operate in the data center equipment room environment. The augmented reality three-dimensional registration technology was used in the inspection function. In the AR group questionnaire, the participant gave a subjective evaluation of the
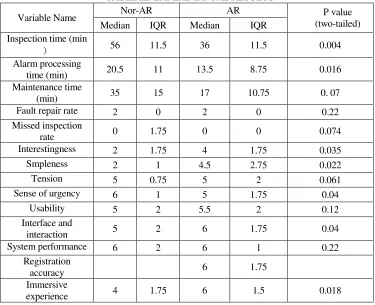
TABLE III. EXPERIMRNTAL RESULTS.
Variable Name Nor-AR AR P value
(two-tailed) Median IQR Median IQR
Inspection time (min
) 56 11.5 36 11.5 0.004
Alarm processing
time (min) 20.5 11 13.5 8.75 0.016
Maintenance time
(min) 35 15 17 10.75 0. 07
Fault repair rate 2 0 2 0 0.22
Missed inspection
rate 0 1.75 0 0 0.074
Interestingness 2 1.75 4 1.75 0.035
Smpleness 2 1 4.5 2.75 0.022
Tension 5 0.75 5 2 0.061
Sense of urgency 6 1 5 1.75 0.04
Usability 5 2 5.5 2 0.12
Interface and
interaction 5 2 6 1.75 0.04
System performance 6 2 6 1 0.22
Registration
accuracy 6 1.75
Immersive
tracking error, the median was 6, and inter-quartile was 1.75, so the tracking effect was good. This question is not included in the Non-AR group questionnaire. For the immersion, the AR group was higher than the Non-AR group and the IQR was lower, P=0.018. Therefore, the AR group had a better immersion.
Discussion
performance, the gestures and voice interactions in the system is more suitable for use in the data center environment than traditional iPad interactions or paper records. Users do not have to frequently bow and head up, and can free one hand to carry inspection and maintenance tools. The Augmented Reality(AR) technology used in the system can track the position stably and its registration error is also small. Because the equipments in the equipment room are similar, the virtual object sometimes can not be accurately added to the correct position in the real scene, but the error is small. Table III and figure6(c) show that participants can accept this small error. At the same time, the AR-OM system has a better sense of immersion.
CONCLUSIONS AND FUTURE WORK
In this thesis, we provide the design details of the AR operation and maintenance system. This system mainly uses Augmented Reality(AR) technology to implement data center inspection and maintenance, and uses equipment identification and indicator identification to improve the inspection efficiency. We also describe a user study. The two groups of participants completed the questionnaire using AR-OM system and Non-AR system which removes Augmented Reality(AR) effect. The results show that the AR operation and maintenance system can significantly improve the inspection efficiency, reduce the missed inspection rate, reduce the inspection complexity, and provide better interaction. It also shows that the use of Augmented Reality(AR) technology in the system can more easily produce complex psychosocial effects, which can reduce the tedium of inspections and reduce the user's sense of urgency. In the next step, we will improve the registration error of Augmented Reality(AR) technology. In addition, we will also improve rendering effects so that the virtual information can be displayed more rationally.
ACKNOWLEDGEMENT
The research of this paper is supported by Beijing NOVA program (Z181100006218041).
REFERENCES
1. I. Wijesooriya, D. Wijewardana, T. D. Silva, and C. Gamage. 2017. “Demo Abstract: Enhanced Real-Time Machine Inspection with Mobile Augmented Reality for Maintenance and Repair,” Internet-of-Things Design and Implementation (IoTDI), 2017 IEEE/ACM Second International Conference on. 18-21 April 2017.
3. P. Ramakrishna, E. Hassan and R. Hebbalaguppe2016. “An AR Inspection Framework: Feasibility Study with Multiple AR Devices,” Mixed and Augmented Reality (ISMAR-Adjunct), 2016 IEEE International Symposium on,19-23 Sept. 2016.
4. A. Gupta, and S.Mohatta. 2017. “Hand Gesture Based Region Marking for Tele-Support Using Wearables,” Computer Vision and Pattern Recognition Workshops (CVPRW), 2017.
5. Hololens.https://www.microsoft.com/en-us/hololens.
6. F. C .Lam and M. T. Longnecker. 1983. A modified Wilcoxon rank sum test for paired data. Biometrika, 70(2), pp.510-513,1983.
7. W. A. IJsselsteijn, Y. A. W. de Kort, and K. Poels. 2012. The Game Experience Questionnaire: Development of a self-report measure to assess the psychological impact of digital games, Retrieved online on Sept. 5, 2012.