A Data Mining Model by Using ANN for Predicting Real
Estate Market: Comparative Study
Itedal Sabri Hashim Bahia
Ministry of Higher Education and Scientific Research, Baghdad, Iraq Email: [email protected]
Received July 31, 2013; revised August 29, 2013; accepted September 7,2013
Copyright © 2013 Itedal Sabri Hashim Bahia. This is an open access article distributed under the Creative Commons Attribution License, which permits unrestricted use, distribution, and reproduction in any medium, provided the original work is properly cited.
ABSTRACT
This paper aims to demonstrate the importance and possible value of housing predictive power which provides inde- pendent real estate market forecasts on home prices by using data mining tasks. A (FFBP) network model and (CFBP) network model are one of these tasks used in this research to compare results of them. We estimate the median value of owner occupied homes in Boston suburbs given 13 neighborhood attributes. An estimator can be found by fitting the inputs and targets. This data set has 506 samples. “ousing inputs” is a 13 × 506 matrix. The “housing targets” is a 1 × 506 matrix of median values of owner-occupied homes in $1000’s. The result in this paper concludes that which one of the two networks appears to be a better indicator of the output data to target data network structure than maximizing predict. The CFBP network which is the best result from the Output_network for all samples are found from the equa- tion output = 0.95 * Target + 1.2. The regression value is approximately 1, (R = 0.964). That means the Output_network is matching to the target data set (Median value of owner-occupied homes in $1000’s), and the percent correctly predict in the simulation sample is 96%.
Keywords: Cascade Forward Back Propagation (CFBP); Feed Forward Back Propagation (FFBP); Data Mining; House Price
1. Introduction
Today real estate market has become very popular. Though the near future of real estate is still in question, investors have been hungry for a fast way to play the market or to hedge against their volatile portfolios. Futures contracts have been an extremely popular method of balancing a portfolio in other markets, and real estate is, with a little knowledge, now in the same boat [1].
Futures contracts that trade at a centralized exchange allow market participants more financial leverage and flexibility and are guaranteed by the exchange so there is no risk of counterparty default. They are also in and of themselves leveraged investments, which allow investors a way to benefit on movements in housing prices as well as provide them with the opportunity for a liquid short-term real estate investment. These futures also allow investors a way to speculate on housing prices with much lower capital requirements [1]. An accurate prediction on the house price is important to prospective homeowners, developers, investors, appraisers, tax assessors and other real estate market participants, such as, mortgage lenders and insurers [2]. Traditional house price prediction is
based on cost and sale price comparison lacking of an accepted standard and a certification process. Artificial Neural Network (ANN) is a neurobiological inspired paradigm that emulates the functioning of the brain based on the way that neurons work, because they are recog- nized as the cellular elements responsible for the brain information processing [3]. ANN models can detect pat- terns that relate input variables to their corresponding outputs in complex biological systems for prediction [4]. Methods for improving network performance include finding an optimum network architecture and appropriate number of training cycles, using different input combina- tions [5]. Therefore, the availability of a house price pre- diction model helps fill up an important information gap and improves the efficiency of the real estate market [6].
2. Related Works
The quest for patterns in data has been studied for a long time in many fields, including statistics, patterns recogni-
about the business. This is where data mining has obvi- ous benefits for any enterprise. Data mining, also called Knowledge Discovery in Databases (KDD), is the field of discovering novel and potentially useful information from large amounts of data. Data mining has been ap- plied in a great number of fields, including retail sales, bioinformatics, and counterterrorism. In recent years, there has been increasing interest in the use of data min- ing to investigate scientific questions within educational research, an area of inquiry termed educational data mining. [9] The stages involved in data mining as in fig- ure [10]. There are many research that related works with this paper.
Dongsong Zhang and Lina Zhou [11], they are de- scribing data mining in the context of financial applica- tion from both technical and application perspectives. In addition, we compare different data mining techniques and discuss important data mining issues involved in specific financial applications. Finally, we highlight a number of challenges and trends for future research in this area.
G. Grudnitski, A. Quang Do and J. D. Shilling [7],
they are applying a neural network analysis to supply evidence that answers this question. they find evidence that the characteristics of a borrower’s net worth, marital status and education level and whether a co borrower is involved contribute in a significant way to the neural network's ability to determine mortgage choice.
Kaihla, Paul, Copeland, Michael V., Hawn, Carleen, Lappin, Todd, Lev-Ram, Michal, Sloan, Paul [12],
they are presents information related to the current status of real estate in the U.S. The nationwide housing slump was most evident with the fact that the median sales price for existing U.S. homes slipped to $225,000 in August 2006. It is however opined that the impact of housing downturn on the American residential real estate assets will not be much extensive.
Kontrimas, Vilius; Verikas, Antanas [13], used the ordinary least squares (OLS) linear regression is the clas- sical method used to build models in this approach. The method is compared with computational intelligence ap- proaches-support vector machine (SVM) regression, multilayer perceptron (MLP), and a committee of pre- dictors. The performance of the committee using the weights based on zones obtained from the SOM was also higher than of that exploiting the real estate value zones provided by the Register center.
Landers, Jay [14], produce offers information on the market forecasts for the nonresidential construction sec- tor in the US in 2008. A report titled “Construction Out- look 2008,” by the company McGraw-Hill Construction says that more rigid lending standards have begun to af- fect commercial real estate and have reduced the volume of property purchases. According to a forecast by FMI
Corp., there will be a marginally better result for total construction in 2008.
Ruben D. Jaen [15], is presents the insights gained from applying data mining techniques, in particular neu- ral networks for the purposes of developing an intelligent model used to predict real estate property values based on variety of factors. A dataset of over one thousand transactions in real estate properties was used. The data- set included 15 variables obtained from the multiple list- ing system (MLS) database and captured information on transactions taking place during a period of three years. The results from applying data mining techniques to pre- dict real estate values are promising. Future plans and recommendations for further expanding the study are given.
Sean Zdenek [16], suggest, produces AI systems by rhetorical means; it does not merely describe AI systems or reflect a set of prevailing attitudes about technology. To support this argument, I analyses a set of research articles about an “embodied conversational agent” called the Real Estate Agent (REA).
3. Methodologies/Data Mining Process
3.1. Data Preparations
The data was created by a house price as a data set to test the data mining intelligent system, which will perform the predict system. A data is available from the UCI Machine Learning Repository in Irvine, CA: University of California, Department of Information and Computer Science, and the StatLib library which is maintained at Carnegie Mellon University. The main idea was to con- struct the neural network model by using two types of neural networks first feed forward neural network, sec- ond Cascade forward neural network, and compare to find the best perform predict house price. For better un- derstanding of the problem let us consider definitions of house price. A house price is characterized by Median value of owner-occupied homes in $1000’s as a target values. This dataset contains 13 predicting variables in 506 numbers of samples. Table 1 presents the variables of data which are considered as 13 predicting variables.
3.2. Data Selection and Transformation
The study of feature selection finds its practical in ma- chine learning in which a learning algorithm constructs a description of a function from a set of input/output in- stances through the interaction with the world [17].
Figure 1. The steps of extracting knowledge from data [10].
Table 1. Predicting variables of data.
No variables
1- per capita crime rate by town
2- Proportion of residential land zoned for lots over 25,000 sq.ft. 3- proportion of non-retail business acres per town 4- (=1 if tract bounds river; 0 otherwise) Charles River dummy variable 5- nitric oxides concentration (parts per 10 million) 6- average number of rooms per dwelling 7- proportion of owner-occupied units built prior to 1940 8- weighted distances to five Boston employment centers 9- index of accessibility to radial highways 10- full-value property-tax rate per $10,000 11- pupil-teacher ratio by town
12- 1000 (Bk - 0.63)2 where Bk is the proportion of blacks by town
13- % lower status of the population
Figure 2. Typical neural networks [19].
tion that transforms the sum of the weighted inputs and bias to decide the value of the output from computational unit [18].
In supervised training, we present a pattern to the neu- ral network, it makes a prediction, and we compare the predicted output to the desired output. Thus we have ex- plicit information about the performance of the network. The major parameters used in supervised training have to do with how the error is computed and how big a step we take when adjusting the connection weights in the direc- tion of the desired output [20].
3.3. Artificial Neural Network
Neural network is an artificial intelligence model origin- nally designed to replicate the human brain’s learning process. The model consists of three main layers: input data layer (example the property attributes), hidden layer(s) (commonly referred as “black box”), and output layer [18]. Neural network is an interconnected network of artificial neurons with a rule to adjust the strength or weight of the connections between the units in response to externally supplied data Figure 2 [18,19]. Each artifi- cial neuron (or computational unit) has a set of input connections that receive signals from other computa- tional units and a bias adjustment, a set of weights for input connection and bias adjustment, and transfer func-
Learning rate almost all neural network models have a learning rate parameter associated with them. In a typical supervised training case, a pattern is presented to the neural network; it makes an incorrect prediction, and the difference between the desired output and the actual output is used to adjust the weights [20].
projection of the future is what drove the creation of networks of prediction [21].
3.3.1. The ANN (FFBP) Network
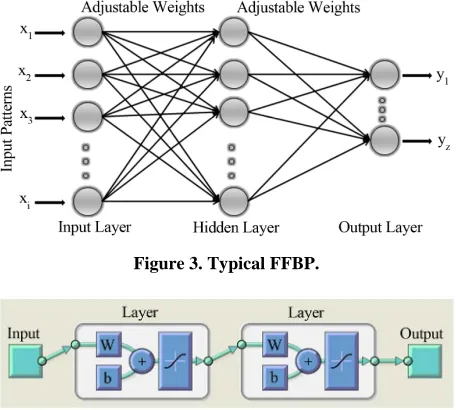
Feed forward networks often have one or more hidden layers of sigmoid neurons followed by an output layer of linear neurons. Multiple layers of neurons with nonlinear transfer functions allow the network to learn nonlinear and linear relationships between input and output vectors. The linear output layer lets the network produce values outside the range –1 to +1. The first step in training a feed forward network is to create the network object. It requires three arguments and returns the network object. The first argument is a matrix of input vectors. The sec- ond argument is a matrix of target vectors. The sample inputs and outputs are used to set up network input and output dimensions and parameters. The third argument is an array containing the sizes of each hidden layer. (The output layer size is determined from the targets.) [22,23]. The typical and structure of the feed forward network is show in the Figures 3 and 4.
3.3.2. The ANN (CFBP) Network
[image:4.595.352.538.214.339.2]The cascade forward network, these are similar to feed forward network, but include a weight connection from the input to each layer and from each layer to the succes- sive layers. For example, a three-layer network has con- nections from layer 1 to layers 2, layer 2 to layer 3, and layer 1 to layer 3. The three-layer network also has con- nections from the input to all three layers. The additional connections might improve the speed at which the net- work learns the desired relationship [21,22]. CF artificial intelligence model is similar to feedforward backpropa- gation neural network in using the backpropagation algo-
Figure 3. Typical FFBP.
Figure 4. The structure of the feed forward back propaga-tion network.
rithm for weights updating, but the main symptom of this network is that each layer of neurons related to all previ- ous layer of neurons [20]. Tan-sigmoid transfer function, log-sigmoid transfer function and pure linear threshold functions were used to reach the optimized status [22,23]. The performance of cascade forward backpropagation and feedforward backpropagation were evaluated using Root Mean Square Error (RMSE) Equation (1), Mean Square Error (MSE) Equation (2) and R2 Equation (3) technique. 2 exp 2 1 exp N X Xcal
MSE X
(1) 2 exp 11 N X Xcal
RMSE n n
(2) 2 exp 2 2 1 exp1 N X Xcal
R X
(3)where, Xexp = Observed value; Xcal = Predicted value;
Xexp =Mean predicted value; n = Number of observations
in dataset. MSE, RMSE) and R2 were used in order to compare the prediction performance of the developed models. The best score for R2 measure is 1 and for other measures is zero. The typical and structure of the cascade forward network is show in the Figures 5 and 6.
[image:4.595.305.539.459.708.2]Cascade Forward Back Propagation CFBP is similar to FFBP network in using the BP algorithm for weights up-
Figure 5. Cascade-forward ANN.
[image:4.595.59.287.504.709.2]dating, but the main symptom of this network is that each layer neurons relates to all previous layer neurons.
4. Results
4.1. Relative Importance of Inputs
We first discuss the results obtained from the two neural networks modeling to predict the housing price. The neural networks were created using the neural network toolbox from Matlab 7.9. Training network automatically stops when generalization stops improving, as indicated by an increase in the mean square error (MSE) of the validation samples. The results of apply by using the artificial neural networks methodology to predict be-
tween input data (actual data) and target data. The dataset were divided 80% for training, and 20% for testing. Weights and biases were randomly initialized. The net- work was trained with up to 100 epochs. Weight is in- formation used by neural network to solve a problem. In neural network analysis the results, depending on value of house price is performed, we have three figures for each neural network model, Figures 7-9 for FFBP neural network and Figures 10-12 for CFBP neural network.
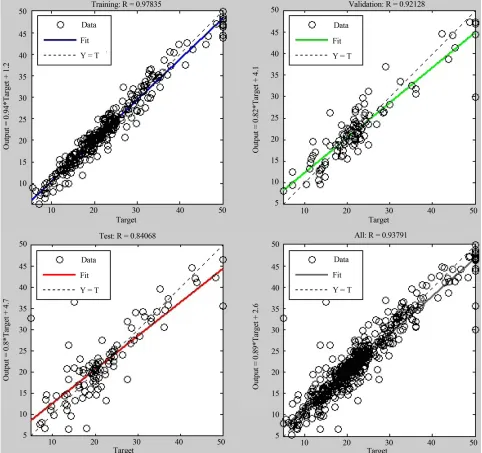
[image:5.595.57.539.264.717.2]We will focus on which one of those neural network model is best to improving the neural network predict performance for house price. Table 2 gives the training, validation, and test predicting performance of the FFBP neural network model. It shows measures of regression
Figure 8. The best validation performance (MSE) at 82
ep-ochs (FFBP). Figure 9. The training states for FFBP network.
[image:6.595.321.522.85.248.2] [image:6.595.65.534.267.721.2]Figure 11. The best validation performance (MSE) at 14 epochs (CFBP).
Figure 12. The training states for CFBP network.
Table 2. FFBP network statistics.
Type Value Equation
R.-training 0.98 Output = 0.94Target + 1.2
R-validation 0.92 Output = 0.82Target + 4.1
R-test 0.841 Output = 0.8Target + 4.6
Gradient 0.681
Mu 1
(R), training state (Gradient, Mu, and validation) and the best validation performance (MSE) is 13.583 at epoch 82.The statistics shows the measure of performance of the network with regard to the input variables presented to it. The regression of all samples of data set is 0.94 in epoch 88 and the predict values are obtained from the equation Output = 0.89Target + 2.6 in Figure 5. The
FFBP values obtained from the network in epoch 88 it- erations is presented in Table 2.
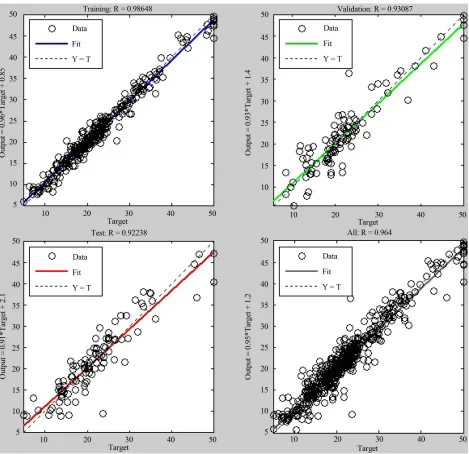
Table 3 gives the training, validation, and test pre- dicting performance of the CFBP neural network model. It shows measures of R, training state (Gradient, Mu, and validation) and the best validation performance (MSE) is 9.533 at epoch 14. The statistics shows the measure of performance of the network with regard to the input variables presented to it. The regression in the Table 3
for all samples of data set is 0.96 in epoch 20 and the predict values are obtained from the equation Output = 0.96Target +1.2 in Figure 8. The CFBP values obtained from the network in epoch 20 iterations is presented in
Table 3.
4.2. Discussion of Results
As can be observed from the results in the Tables 2 and
3, models with Cascade Forward Back Propagation neu- ral network structure gives the best results because the validation performance value (MSE) mean square error is less than of the validation performance value (MSE) of Feed Forward Back Propagation neural network.
The regression graph is getting it from the scatter plot in Figure 10, the relation between the output and the target. Output_network for all samples are result from the equation Output = 0.95Target + 1.2. The regression value is approximately 1, R = 0.964. That mean the output_ network is matching to the target data set (Median value of owner-occupied homes in $1000’s), and the percent correctly predict in the simulation sample is 96%.
5. Conclusion
An accurate prediction on the housing price is important to prospective homeowners and everything belongs to a real estate market. Data mining has come out of the re- search lab and into the real world to do just such tasks. The FFBP and CFBP neural networks are one of these tasks used to predict housing price and compare the re-sult between them. When apply the CFBP neural net- works methodology to predict housing price, the result is better in CFBP network in the predicting based upon selected parameters, showing abilities of the network to
Table 3. CFBP network statistics.
type value Equation
R.-training 0.99 Output = 0.96Target + 0.85
R-validation 0.931 Output = 0.93Target + 1.4
R - test 0.922 Output =0.91Target + 2.1
Gradient 2.525
learn the patterns, and in the CFBP structure each layer neuron relates to all previous layer neurons that give for CFBP network more training to adjust the weight and gives accurate predict results depending on the output of network that matches the target. Artificial neural net- works showing significant results on housing price pre- diction in the simulation samples is above 96%.
REFERENCES
[1] “An Introduction to Real Estate Futures,” 2011. http://www.investopedia.com/articles/optioninvestor/11/a n-introduction-to-real-estate-futures.html
[2] C. A. Calhoun, “Property Valuation Models and House Price Indexes for The Provinces of Thailand: 2000,” Hous- ing Finance International, Vol. 18, No. 3, 2003, pp. 31- 41.
[3] A. Araque, E. D. Martin, G. Perea, J. I. Arellano and W. Buno, “Synaptically Released Acetylcholine Evokes Ca2+ Elevations in Astrocytes in Hippocampal Slices,” Journal of Neuroscience, Vol. 22, No. 7, 2002, pp. 2443-2450.
[4] P. D. Wasserman, “Advanced Methods in Neural Com- putting,” Van Nostrand Reinhold, New York, 1993, p. 255.
[5] R. S. Parmer, R. W. McClendon, G. Hoogenboom, P. D. Blankenship, R. J. Cole and J. W. Dorner, “Estimation of Aflatoxin Contamination in Preharvest Peanuts Using Neu- ral Networks,” Transaction ASAE, Vol. 40, No. 3, 1997, pp. 809-813.
[6] H. Demuth and M. Beale, “Neural Network Toolbox for Matlab-Users Guide Version 4.1,” The Mathworks Inc., Natrick, 2003.
[7] G. Grudnitski, A. Quang Do and J. D. Shilling, “A Neural Network Analysis of Mortgage Choice,” International Journal of Intelligent Systems in Accounting, Finance and Management, Vol. 4, No. 2, 1995, pp. 127-135.
[8] R. M. Heristev, “The ANN Book, GNU Public License,” 1998. ftp://ftp.funet.fi/pub/sci/neural/books/
[9] M. Stanley, A. Alastair, M. Dylan and D. Patterson, “Neu- ral Networks: The Prediction of Residential Values,”
Journal of Property Valuation & Investment, Vol. 16, No. 1, 1998, pp. 57-70.
http://dx.doi.org/10.1108/14635789810205128
[10] U. Fayyad, G. Piatetsky-Shapiro and P. Smyth, “From Data Mining to Knowledge Discovery in Databases,” American Association for Artificial Intelligence (© AA AI), AI Magazine, Vol. 17 No. 3, 1996, pp. 37-54.
[11] D. S. Zhang and L. N. Zhou, “Discovering Golden Nug-
gets: Data Mining in Financial Application,” IEEE Trans- actions on Systems, Man, and Cybernetics—Part C: Ap- plications and Reviews, Vol. 34, No. 4, 2004, pp. 513-522. http://dx.doi.org/10.1109/TSMCC.2004.829279
[12] P. Kaihla, M. V. Copeland, C. Hawn, T. Lappin, M. Lev- Ram and P. Sloan, “The New Rules of Real Estate,”
Business 2.0 The New Rules of Real Estate Survival Tips for a Sluggish Market how to Buy how to Sell the 10 Best Places to Invest, Vol. 7, No. 10, 2006, p. 80.
[13] V. Kontrimas and A. Verikas, “The Mass Appraisal of the Real Estate by Computational Intelligence,” Applied Soft Computing Journal, Vol. 11, No. 1, 2011, pp. 443-448. http://dx.doi.org/10.1016/j.asoc.2009.12.003
[14] J. Landers, “Market Forecasts See Mixed Conditions for Nonresidential Construction,” Civil Engineering, Vol. 78 No. 4, 2008, pp. 14-16.
[15] R. D. Jaen, “Data Mining: An Empirical Application in Real Estate Valuation, FLAIRS-02 Proceedings,” Ameri- can Association for Artificial Intelligence, 2002.
[16] S. Zdenek, “Artificial Intelligence as a Discursive Prac- tice: The Case of Embodied Software Agent Systems,” Springer-Verlag London Limited, AI & Society, 2003, pp. 340-363.
[17] L. Huan and M. Hiroshi, “Feature Selection for Knowl- edge Discovery and Data Mining,” The Springer Interna- tional Series in Engineering and Computer Science, 1998.
[18] J. Coakley and C. Brown, “Artificial Neural Networks in Accounting and Finance: Modeling Issues,” International Journal of Intelligent Systems in Accounting, Finance and Management, Vol. 9, No. 2, 2000, pp. 119-144.
[19] G. Papadourakis, “Introduction to Neural Networks,” Technological Educational Institute of Crete, Department of Applied Informatics and Multimedia, 2004.
[20] P. B. Joseph, “Data Mining with Neural Networks Solv- ing Business Problems,” McGraw-Hill Companies, Inc., 1996.
[21] A. Dave and M. George, “Artificial Neural Networks Technology,” Kaman Sciences Corporation, Utica, 1992
[22] R. A. Chayjan and M. Esna-Ashari, “Comparison be- tween Artificial Neural Networks and Mathematical Mo- dels for Equilibrium Moisture Characteristics Estimation in Raisin,” Agricultural Engineering International: The CIGR E-Journal, Vol. 12, 2010.