in the United States
Copyright © 2012, KEMA, Inc.
This document, and the information contained herein, is the exclusive, confidential and proprietary property of KEMA, Inc. and is protected under the trade secret and copyright laws of the U.S. and other international laws, treaties and
conventions. No part of this work may be disclosed to any third party or used, reproduced or transmitted in any form or by any means, electronic or mechanical, including photocopying and recording, or by any information storage or retrieval system, without first receiving the express written permission of KEMA, Inc. Except as otherwise noted, all trademarks
Table of Contents
1. Executive Summary ... 1-1
2. Introduction ... 2-1
2.1 Energy Storage Technologies ... 2-1
2.2 Energy Storage Grid Applications ... 2-4
3. Methodology ... 3-1
3.1 Market Penetration Model Summary ... 3-2
3.2 Costs and Payback Periods ... 3-3
3.3 Copper Intensity ... 3-4
4. Relevant Initiatives in Energy Storage ... 4-1
5. Results of Market Penetration Study ... 5-1
5.1 Market Summary ... 5-1
5.2 Market Drivers & Trends ... 5-6
5.3 Market Potential Conclusions ... 5-7
6. Results of Copper Demand Analysis ... 6-1
6.1 Copper Demand Summary ... 6-1
6.2 Storage Unit Copper Intensities ... 6-3
6.3 Copper Intensities of Installed Storage Applications ... 6-4
6.4 Copper Intensity of Associated Industries ... 6-5
7. Conclusions and Recommendations ... 7-1
Appendix A. Survey ... A-1
Appendix B. Grid-connected Storage Applications ... B-1
Appendix C. Detail on Battery Energy Storage Systems ... C-1
Table of Contents
List of Figures
Figure 1. Benefits of Energy Storage along the Electricity Value Chain ... 2-1
Figure 2. Storage Ratings by Technology Type ... 2-2
Figure 3. Storage Capital Costs by Technology Type ... 2-3
Figure 4. Storage Efficiency and Lifetime by Technology Type ... 2-4
Figure 5. High Potential Storage Applications ... 2-5
Figure 6. Grid Energy Storage Summary ... 2-6
Figure 7. U.S. Energy Storage Market Penetration Methodology Overview ... 3-1
Figure 8. KEMA Market Penetration Model Dashboard ... 3-3
Figure 9. Storage Installation Methodology ... 3-6
Figure 10. DOE Smart Grid Demonstration Grants ... 4-1
Figure 11. Policy Initiatives Shaping the U.S. Energy Storage Market ... 4-2
Figure 12. U.S. Application Market Development Horizon ... 4-4
Figure 13. Estimated Current Installed Capacity by Technology (MW) ... 5-1
Figure 14. Estimated Current Installed Capacity by Application (MW) ... 5-2
Figure 15. Estimated Five-year Incremental Growth, by Application, with No Credit... 5-2
Figure 16. Estimated Five-year Incremental Installed Capacity by Technology, No Credit ... 5-3
Figure 17. Estimated Five-year Incremental Installed Capacity by Financial Incentive Scenario5-4
Figure 18. Estimated Five-year Total Installed Capacity by Application (MW), No Incentive .... 5-5
Figure 19. Estimated Five-year Installed Capacity by Technology (MW), No Incentive ... 5-5
Figure 20. Renewables Integration Copper Demand ... 6-1
Figure 21. Ancillary Services Market Copper Demand ... 6-1
Figure 22. Transmission Services Copper Demand ... 6-2
Figure 23. Other Distributed Storage Copper Demand ... 6-2
Figure 24. CES Copper Demand ... 6-3
Figure 25. Storage Unit Copper Intensities ... 6-4
Figure 26. Copper Intensity of Storage Installations ... 6-5
Abbreviations
AB assembly bill
BMS battery management system
CAES compressed air energy storage
CAISO California ISO
CES community energy storage
DC direct current
DOE U.S. Department of Energy
ERCOT Electric Reliability Council of Texas
ESA Electricity Storage Association
FERC Federal Energy Regulatory Commission
GW gigawatt
HVAC heating, ventilating, and air conditioning
ISO independent system operator
ISO-NE ISO of New England
kV kilovolt
kVA kilovolt-ampere
KW kilowatt
KWh kilowatt-hour
Li lithium
MISO Midwest ISO
MW megawatt
MWh megawatt hour
NaS sodium sulfur
Ni-Cd nickel cadmium
NYISO New York ISO
PJM PJM Interconnection
PV photovoltaic solar
R&D research and development
RPS renewable portfolio standard
RTO regional transmission organization
SPP Southwest Power Pool
TOU time of use
T&D transmission and distribution
1. Executive
Summary
Project Summary
Commissioned by the Copper Development Association Inc. (CDA), this paper evaluates the near-term market for grid energy storage in the United States (U.S.) and the copper content associated with this market. The CDA is the market development, engineering, and information services arm of the copper industry, chartered to enhance and expand markets for copper and its alloys in North America. To support the CDA with its objectives for an energy storage market assessment, KEMA focused on four core points of analysis:
1. Defining the current market for energy storage in the U.S.
2. Assessing initiatives that are shaping the U.S. energy storage market
3. Forecasting the near-future U.S. market for energy storage from 2011 to 2016 4. Projecting copper demand associated with the U.S. energy storage market
To forecast an annual market size of grid storage in the U.S., KEMA used its energy storage market penetration model. The analysis incorporated information on current and planned U.S. grid-storage activities, known grid-storage market trends, and proposed energy-storage incentives. KEMA supplemented analysis of the current market and five-year market potential with information on longer term market drivers to provide further insight into the U.S. market potential. The study considers technologies including electrochemical, mechanical and thermal storage, and grid applications ranging from distributed community energy storage (CES) to centralized, bulk storage. The study focuses on the four applications of ancillary services, transmission services, community energy storage, and other distributed storage.
To estimate the copper demand associated with the U.S. energy storage market, KEMA developed estimates of storage-device copper content based on its knowledge of storage materials and on input from storage developers. KEMA also estimated the storage intensity of storage installations, which it paired with the storage market forecasts to estimate market-wide copper demands.
Methodology
The market for energy storage in the U.S. is a rapidly changing one, with new technologies being developed and new applications being investigated on regular basis. In the midst of this evolution, however, a number of common applications and technologies have arisen. To create a snapshot that is representative of the U.S. grid energy storage market, KEMA’s analysis focuses on these predominant applications and technologies positioned for near-term growth. As such, the first step of the analysis was to identify the predominant storage applications and pair them with the predominant technologies to identify technology/application bundles that represent the market. Current activities around copper-intensive technologies and applications are also examined and summarized in this step.
After identifying energy storage bundles, KEMA researched current and planned installations by bundle. To develop estimates of future growth, KEMA combined information on current
activities and investments with its payback-based technology penetration model. The model leverages energy technology adoption “S-curves” developed based on KEMA’s experience with and insights on renewable and energy storage technologies; energy and utility market
dynamics; and energy end-use market trends, dynamics, and forecasting. To account for the potential influence of financial policy, KEMA defined two scenarios: one that implements a tax incentive based on the latest proposal made by members of the U.S. Congress1 and one with no financial incentive.
With the storage market assessment underway, KEMA estimated the associated copper demand for storage in two stages. In the first stage, KEMA identified the copper intensities of energy storage units for each technology type represented in the market model. KEMA based these estimates on published research and interviews with product developers. In the second stage, KEMA estimated the copper intensities of the energy storage units as installed in their associated applications. For these estimates, KEMA included assumptions about the
equipment that would be needed to operate the storage device and about the copper content of such equipment. With many storage applications in the demonstration phase, energy storage installations have yet to conform to standard configurations. However, to develop estimates of the order of magnitude of copper for installed applications of energy storage, KEMA developed representative configurations and derived copper intensity ranges.
1
The U.S. STORAGE Act of 2011 (S.1845), introduced in November 2011, would provide tax incentives for grid storage as well as for on-site and residential applications.
Summary of Results
Based on the U.S. energy storage market assessment and analysis of the copper intensities of storage device and their installations, this research finds that the U.S. market for grid energy storage could result in a sizeable demand for copper. In particular, the copper intensity of storage installations appears to be significant though varied, ranging from zero to over three tons per megawatt (MW), depending on the installation configuration, type of electrical
equipment, and storage type.2 The total incremental copper demand associated with U.S. grid energy storage is estimated to range from roughly 900 tons of copper to over 3,000 tons of copper. Additional findings from this research are noted below, by topic area.
Copper Demand by Market Segment. Applications for renewable energy integration and ancillary services appear to have the largest near-term associated demand for copper, with additional copper intensive applications, such as CES poised for strong growth.
• Renewable energy integration applications for energy storage appear to have a strong associated demand for copper. Because of the timelines of pumped hydropower investment, lithium-ion, compressed air energy storage (CAES), and lead acid storage are the largest contributors for this market. Estimates for the cumulative associated copper demand range from more than 650 tons to almost 2,200 tons, depending on the existence of financial incentives. The associated incremental copper demand ranges from over 300 tons to over 1,800 tons.
• Energy storage for ancillary services also appears to have a strong associated demand for copper, due to its relatively high copper intensities and relatively high expectations for near-term growth. Estimates for the cumulative associated copper demand range from more than 630 tons to almost 840 tons, depending on the existence of financial
incentives. The associated incremental copper demand ranges from over 520 tons to over 720 tons.
• Though the market for distributed thermal storage is relatively large, the copper intensity is relatively limited, limiting the overall associated copper demand of this segment. Other types of distributed energy storage have higher copper intensities, but will likely have limited market penetration over the next five years. Estimates for the cumulative associated copper demand range from more than 100 tons to 160 tons, depending on
2
The results of the low and high scenarios KEMA analyzed, which vary the copper intensities of associated equipment, range from 0 to 8 tons of copper per MW.
the existence of financial incentives. The associated incremental copper demand ranges from over 50 tons to over 100 tons.
• The market for transmission-related storage applications is potentially limited in the near term, though the copper intensities for these applications can be relatively strong. Estimates for the cumulative associated copper demand range from more than 85 tons to more than 250 tons, depending on the existence of financial incentives. The
associated incremental copper demand ranges from over 5 tons to over 170 tons.
• CES also appears to have a limited associated demand for copper in the near term, due to expectations of limited market growth over the next five years. However, because of its strong copper intensity and potential for large mid- to long-term growth, this area could have strong associated copper demand over time. Estimates of the cumulative associated copper demand range from almost 20 tons to almost 225 tons, depending on the existence of financial incentives. The associated incremental copper demand ranges from almost 15 tons to over 220 tons.
Copper Demand by Application. The demand for copper associated with the U.S. energy storage markets noted earlier comes from not only the copper content of the storage units themselves but also from the electrical equipment needed to operate the energy storage with the grid.
• The copper content of grid energy storage installations appears to be significant, ranging from zero to over three tons per MW.
– On average, the CES and ancillary services applications have an estimated associated copper intensity from around two to over two and a half tons per MW. – Other distributed storage could offer high copper intensity, but the majority of these
installations, such as thermal energy storage, offer the lowest copper intensity at 0.04 tons per MW.
– Applications for renewable energy integration and transmission services can range from 0.3 to 3 tons per MW.
• Copper intensities can vary significantly by installation and storage technology.3
3
To develop estimates of the order of magnitude of copper for installed applications of energy storage, KEMA estimated representative configurations based on current market trends and derived copper intensity ranges.
– With many storage applications in the demonstration phase, energy storage installations have yet to conform to standard configurations.
– Distributed applications, however, generally have higher copper intensities because they use more lower-voltage equipment, which typically has higher copper intensity. Lower voltage components are more likely to use copper due its higher conductivity and lower maintenance requirements.
Copper Demand by Energy Storage Type. At the unit level, energy storage devices range from zero to nearly 0.3 tons of copper per MW.
• Copper can play a role in the fundamental design of storage units by contributing toward internal connections and current collectors in battery technologies or motors for pumped storage or CAES devices.
• Lithium-ion, flow, and sodium batteries as well as flywheels, CAES, and pumped
hydropower are strong users of copper at the unit level, ranging from over 0.10 to nearly 0.3 tons per MW
• Thermal storage, lead-acid batteries, and super capacitors exhibit the lowest copper intensities, ranging from 0 to 0.03 tons per MW.
The U.S. Energy Storage Market. Overall, opportunity abounds as the market is strong and robust, and has large potential. However, the market is still developing with technology and policy still evolving. The market needs to continue with initiatives to reduce costs and increase experience in order for growth to meet expectations. KEMA estimates that over the next five years, the U.S. grid storage market could grow to between two to four gigawatts (GW), depending on the existence of financial incentives.
• Many new technologies are under development and a handful is ready for commercialization.
– Mature energy storage technologies currently constitute the majority of the energy storage market today. These include thermal energy storage, pumped hydropower, and CAES. 4, 5
4
While 16,000-20,000 MW of pumped hydro capacity are currently installed in the U.S., only a fraction of it is used for applications similar to other storage technologies (i.e., renewables and ancillary services).
– In the near term, battery technologies and thermal storage are expected to have the strongest growth areas.
– Second generation technologies are emerging and research is continuing to be fruitful.
– Venture capital investment is booming both inside and outside of the U.S.
• The ability to scale quickly is seen as a challenge, as is the ability to bring down costs. – Financial incentives could have a large impact on market size in the next five years
by defraying initial investment costs and helping to grow the market.
• The U.S. markets around grid-storage applications are still evolving.
– Policy developments are continuing to shape the development of markets around grid applications, and demonstrations are continuing to define grid application success and inform technology value propositions.
– Markets around some of the grid storage applications are expanding now, such as ancillary services, and markets for other applications that are developing now, such as peaker plant applications, will likely come to fruition after five years.
• In the next five years, costs are expected to come down (via improved system
integration, increased production, and enhanced distribution capability), investments are expected to continue, and areas currently in the demonstration phase will likely start to commercialize.
Copper and Other Industries Associated with Energy Storage.Because of its potential role in supporting the integration of renewable energy, energy storage may also help bolster the copper demand associated with renewable generation.
• Energy storage is one of many tools available to help address renewable intermittency.
• Energy storage can also assist in the integration of renewable energy by helping to address transmission constraints.
• The estimated copper intensities of typical wind farms and typical centralized solar plants, according to prior CDA studies, are three to six tons per MW and two to five tons per MW, respectively.
5
Though CAES makes up a significant share of the total installed capacity, there are a limited number of applications in the market today.
2. Introduction
Energy storage technology holds the promise to provide many benefits across the energy delivery value chain—from generation to transmission and distribution (T&D) to end-users. (See Figure 1 for an illustration). Specifically, energy storage technology is considered a key
component for integration of high levels of renewable energy penetration and as an essential tool for smart, future electricity grids. In addition, a number of societal benefits, such as
reducing emissions, serving as an alternative to a traditional generation plant, or acting as a tool for demand response, can be captured with the deployment of storage technologies.
Figure 1. Benefits of Energy Storage along the Electricity Value Chain
Energy storage has been a part of our electric energy system for decades. Pumped-hydro, for example, is a well-known technology with mature applications installed globally. The concept of CAES has also been known for many years, as has the use of lead-acid batteries in power systems applications. Newer energy storage technologies now in the early market adoption stages, such as lithium-ion batteries, flow batteries, flywheels, and sodium-sulfur battery (NaS) systems, offer improved operational flexibility, improved charge/discharge cycle life, and in some cases longer duration or fast response capabilities.
The following subsections outline information about energy storage technologies and the types of services, or applications, they can provide.
2.1
Energy Storage Technologies
The term energy storage refers to a number of different types of storage technologies, including those whose primary methods are electrochemical, mechanical, or thermal. Within these technology types, several flavors of storage products exist today or are under development.
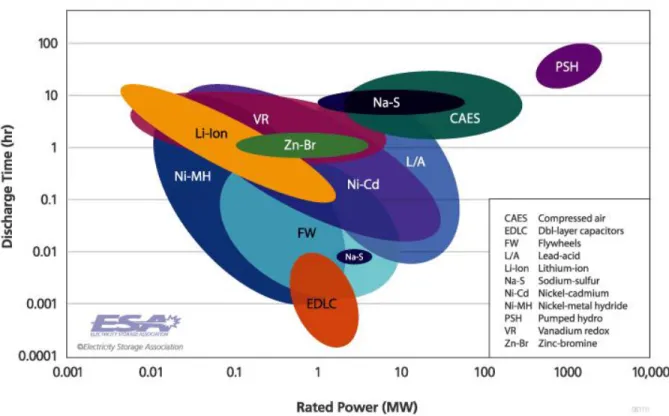
The different types of products and technologies carry with them performance characteristics and costs that make them more or less suitable for given applications. For example, some applications may emphasize fast response over duration, while others require longer durations. As such, no technology fits all applications. Figure 2 characterizes storage technology types according to two characteristics commonly used to different technologies: rated power and discharge duration. Together, they describe how much power a storage unit can provide (in MW) and for how long (in hours). Overall, there is a great deal of overlap in technology ratings, and even within a given technology type, the range of ratings can be large. The specific
products ultimately determine the storage characteristics by unit and are often tailored to the applications for which they are designed.
Figure 2. Storage Ratings by Technology Type
*Based on installed systems, as of November 2008.
Source: Electricity Storage Association.
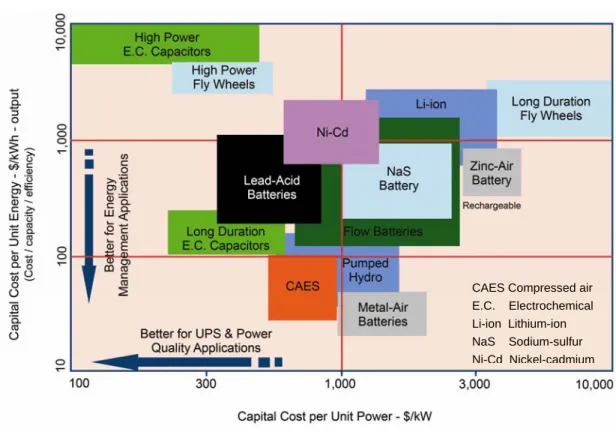
Figure 3 depicts storage technologies according to their capital costs, power rating, and energy rating, in dollars per kilowatt ($/kW) and dollars per kilowatt-hour ($/kWh), respectively. Apart from performance characteristics, capital and operating costs also determine whether a technology is viable for a given applications. For example, though a product might be suited
technically for a given application, the cost of the product might not justify its costs. Ultimately, the answer to which storage device is best for a given application depends on its technical capabilities as well as the financial viability of the product, based on product costs and application revenues.
Figure 3. Storage Capital Costs by Technology Type
Source: Electricity Storage Association.
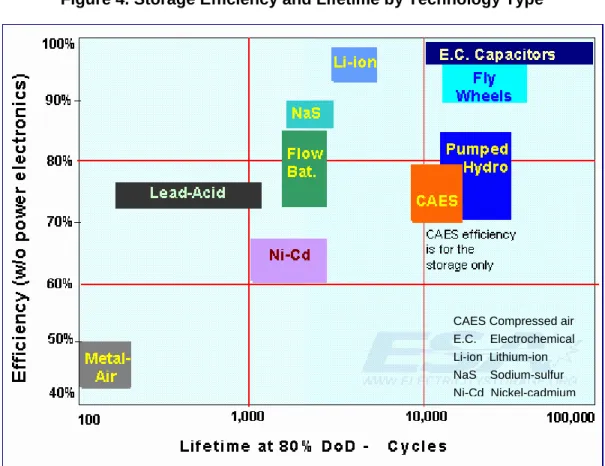
Two additional factors that can affect the lifetime costs of an energy storage device, which are also used commonly to describe storage features, are efficiency and cycle life. Cycle life refers to the number of charge and discharge cycles that a storage device can provide before
performance decreases so as to make it no longer capable of suitably performing the functions it needs to in an application.
CAES Compressed air E.C. Electrochemical Li-ion Lithium-ion NaS Sodium-sulfur Ni-Cd Nickel-cadmium
Figure 4 illustrates the efficiency and lifetime of energy storage technologies. Figure 4. Storage Efficiency and Lifetime by Technology Type
Source: Electricity Storage Association.
2.2
Energy Storage Grid Applications
Energy storage has the ability to serve multiple grid services. A 2010 report by Sandia National Laboratories, for example, identifies 19 different energy storage grid services (see Appendix B for the list and descriptions). These grid services have specific requirements, such as duration and response times, which determine for which technologies they are best suited. In addition, under current energy storage costs and energy market policies and regulations, it can be difficult to justify the cost of an energy storage device for a single application. As such, it is
CAES Compressed air E.C. Electrochemical Li-ion Lithium-ion NaS Sodium-sulfur Ni-Cd Nickel-cadmium
possible that products would combine several applications, which have both technical and business compatibility, to help make energy storage investments economically more feasible.6 The potential markets for many of these applications are large. Figure 5 illustrates the range of estimates for maximum market potential by application.
Figure 5. High Potential Storage Applications
*TOU refers to time of use electricity rates
Application market potential is based on a sampling of industry analyses, including those from Sandia National Laboratories and the Electric Power Research Institute
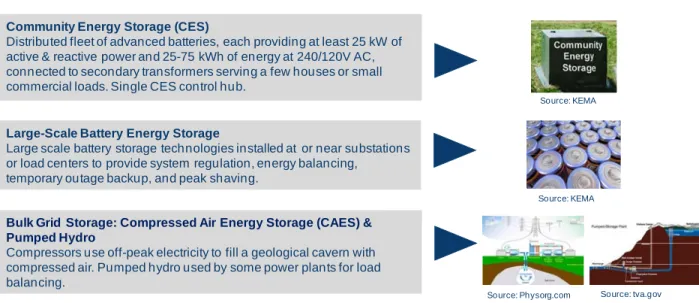
As the name implies, grid storage is connected at various locations along the electric grid system—ranging from distributed energy storage at the community scale on the order of kilowatts (kW) in capacity, to large-scale battery energy storage on the order of 1–2 MWs often
6
The benefits of combined applications cannot be calculated as the straight sum of the individual
applications, as one of the services provided by a unit might constrain the ability to provide other services on that unit.
High Potential Application Markets
(Maximum potential, not forecasted value)
Load shifting 50 – 85 GW
TOU* energy cost management 30 – 64 GW
Load following 20 – 37 GW
Transmission congestion relief 20 – 37 GW Renewable time shift 20 – 37 GW Renewable capacity firming 20 – 37 GW Demand charge management 20 – 32 GW Wind integration: long duration 14 – 18 GW Electric energy time shift 10 –18 GW Electric supply capacity 10 –18 GW T&D deferral 15 – 20 GW Frequency regulation 3 – 12 GW
aggregated up to 50 MW in size, and to bulk grid storage on the order of tens of MWs. Figure 6 summarizes the different categories of grid energy storage.
Figure 6. Grid Energy Storage Summary
The applications analyzed by KEMA in this study include those which KEMA believes have the largest near-term market growth. These include CES, ancillary services, transmission services, renewable energy integration, and other distributed storage. The following provides a brief description of each.
CES Application—CES is a small, distributed energy storage unit connected to secondary transformers serving a few houses or small commercial loads. As the name implies, local communities are the primary beneficiaries of an energy storage device—CES enhances
reliability, reduces the required capital investment by flattening peak loads, compensates for the variability of distributed renewable resources, such as roof top solar photovoltaics (PV), and provides a source of back-up power during grid events for residential and commercial and industrial customers. As such, it combines multiple applications to serve grid needs at the end of the distribution system.
Ancillary Services—Ancillary services are tools used by grid operators to help maintain a continued balance between electricity production and demand.7 Studies, such as KEMA’s “The Benefits of Fast Response Storage Device for System Regulation in ISO Markets,” have shown that fast-response storage devices have the ability to provide frequency regulation and spinning
7
FERC defines six categories of ancillary services in FERC Order No. 888, 1 75 FERC ¶ 61,080 (1996).
Community Energy Storage (CES)
Distributed fleet of advanced batteries, each providing at least 25 kW of active & reactive power and 25-75 kWh of energy at 240/120V AC, connected to secondary transformers serving a few houses or small commercial loads. Single CES control hub.
Bulk Grid Storage: Compressed Air Energy Storage (CAES) & Pumped Hydro
Compressors use off-peak electricity to fill a geological cavern with compressed air. Pumped hydro used by some power plants for load balancing.
Large-Scale Battery Energy Storage
Large scale battery storage technologies installed at or near substations or load centers to provide system regulation, energy balancing, temporary outage backup, and peak shaving.
Source: KEMA
Source: KEMA
reserve grid services, a subset of the full set of ancillary services. Independent system operators and regional transmission organizations (ISOs/RTOs) are currently examining the potential for fast-response storage devices to act as an alternative to traditional generation technologies to help balance system supply and demand through regulation and spinning reserves services. In addition, increased implementation of variable renewable generation resources—especially wind and solar—may increase grid volatility, requiring an increased need for frequency regulation services. Advanced energy storage technologies with fast-response capabilities show promise as a potential solution to addressing the volatility introduced by renewables.
Renewable Energy Integration—The renewable energy integration application is directly linked to intermittent renewable implementation on the grid (e.g., wind and solar) and the amount that occurs on a percentage basis. Energy storage can address three “buffering” challenges that variable energy resources introduce on the grid system:
1. Capacity firming—as previously discussed under ancillary service/regulation
2. Smoothing or ramp control—a function to help reduce the adverse impacts of a very fast change in renewable generation level or output
3. Time-shifting—to match typically off-peak renewable energy supply with on-peak demand
Some of the services provided in the ancillary services market will help with the integration of renewable resources. However, it remains to be seen whether the intermittency of renewable resources will be addressed in the markets or outside of them. For example, today, obligations to firm wind capacity—that is to maintain the power output at a committed level for a reasonable time—vary by region. For the most part, the obligation lies with the ISO/RTO. However, there has been movement toward requiring generators of intermittent or variable energy resources to firm their power to minimum requirements before placing their power on the grid. Separately, needs such as management of localized voltage issues could potentially still be addressed by energy storage outside of market-based services.
Transmission Services—Transmissionservices include primarily the deferral of transmission and distribution equipment, or “T&D deferral,” transmission congestion, and transmission support. T&D deferral is the use of storage to defer the installation or upgrade of transmission and distribution equipment, which can often be difficult to site. Transmission support refers to the use of storage to address electrical anomalies and disturbances on the grid. Transmission congestion relief refers to the use of storage to avoid the need to transmit power during periods
of high system demand. For example, energy stored by devices could be used during on-peak hours when the transmission systems are congested.
Other Distributed Storage—Additional distributed grid storage applications beside CES are under development. For example, thermal storage currently constitutes a large portion of the storage market today. Here, storage can be used to help shift cooling or heating loads to off-peak hours. More recently, thermal storage associated with water heaters has demonstrated the ability to participate in the ancillary services markets. In addition, microgrid demonstrations are underway that integrate storage into the portfolio of onsite resources, such as distributed generation or demand response capability. Furthermore, storage can play a role in assisting with integrating intermittent renewables on a customer site, and with providing temporary back-up power services.
3. Methodology
The methodology used in the U.S. energy storage market assessment involved quantifying key storage market application areas, creating a market penetration “S-curve” for each energy storage application area, and assessing the yearly MWs of energy storage penetration. From the annual MW estimates, the market model then calculated the associated copper demand that can be expected in each of the application areas. Figure 7 offers a visual of this methodology, depicting KEMA’s conceptual approach:
1. Examine and identify the energy storage applications poised for the largest near-term growth and assess their current market size and maximum five-year market potential.
2. Assess the cost and revenues of energy storage technologies in each of these applications.
3. Estimate the economic payback period for each of the selected technologies and applications, and create penetration curves for each bundle.
4. Estimate the likely five-year market sizes, in MWs, for each bundle based on the paybacks, market penetration curves, and maximum potential.
5. Estimate the copper intensities, in tons per MW, of the storage devices and of the full configurations required for installation.
6. Calculate the estimated copper demand associated with the near-term storage market.
Figure 7. U.S. Energy Storage Market Penetration Methodology Overview
Applications
Model
Outcomes
Screen relevant grid applications The Model Associated copper demand (tons) Payback Calculation Escalation Factors Total Potential
Identify Potential Develop Model & Select Inputs Assess Model
Applications Outcomes
Estimate copper intensities
and associated demand:
•Market penetration (MW)
•Copper intensity (tons/MW)
Determine Model Inputs
•Application Revenues
& Costs ($/MW)
•Escalation Factors
•Market Potential (MW)
•Market Adoption Curves
Tabulate Mode Outputs
•Payback (years) •Market Penetration (MW) Market Acceptance Calculation Revenues & Costs Market Adoption Curve
3.1
Market Penetration Model Summary
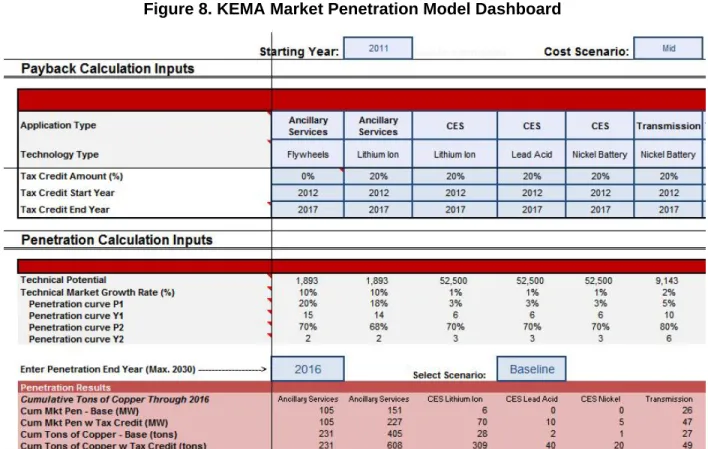
KEMA used its market penetration model to assess the potential size of specific energy storage applications in selected markets. The model is designed to determine year-on-year penetration rates, in MWs, for specific identified applications. The model outputs are cumulative and annual penetration rates for the defined energy storage application.
The energy storage market model estimates market penetration based on penetration curves defined by application and based on payback calculations per technology/application bundle. To assess payback, the model incorporates characteristics of the device such as cost, duration, and expected decreases in cost of each application over the time horizon of the analysis. Benefits for each application are determined and used to create an average payback for that year of operation. For each application, the model inputs a maximum technical potential. The maximum technical potential is the size of the market that a storage device could obtain, based on technical feasibility regardless of project economics or other limiting factors. Addressable market sizes and growth are derived from technical market potential estimates that are based upon reasonable assumptions about technology, market readiness, and persistence of
outstanding challenges. For a given storage application, the addressable market size provides an upper bound on the amount of achievable market penetration. The model also includes parameters to limit growth in the first and subsequent years so as not to exceed what the storage industry could realistically accomplish. As such, for each year, the payback is compared against the penetration curve and the addressable market to create the yearly penetration. The yearly amount is then summed to create a cumulative total of the cost/market data and market potential. Figure 8 provides a snapshot of the model dashboard.
Figure 8. KEMA Market Penetration Model Dashboard
3.2
Costs and Payback Periods
Today, advanced energy storage markets are generally in a pre-commercialized stage. As such, the cost of energy storage devices is expected to decrease over the next 20 years. In addition, energy storage is comprised of a number of competing technologies at varying price points. To address these factors, KEMA listed developing energy storage technologies across a range of durations. These average cost curves were used to estimate the expected cost of energy storage over time. KEMA estimated the economic payback period for each of the energy storage applications over the five-year study period. The payback period was determined by dividing the initial cost of the storage equipment by the net annual benefit derived from the storage equipment to determine the period of time required for the benefits to repay the original investment. Costs represented total installed costs, which included the battery system, power conversion systems, engineering, site work, and shipping.
The net benefits were determined for each storage application based upon a combination of primary and secondary research. The net benefits were determined by identifying the possible
value streams for storage, which could include electricity sales or avoided electricity costs less the costs of operating the storage device. For some storage applications, an escalation factor was applied to account for changes to the net benefits over the five-year study period. The combination of decreasing cost curves and increasing storage benefits resulted in payback curves that improved over the course of the analysis study period. Payback curves were calculated with and without a tax incentive.
3.3 Copper
Intensity
With many storage applications in the demonstration phase, energy storage installations have yet to conform to standard configurations. Though energy storage installations come in a wide array of sizes and configurations, and though few best practices have evolved with regard to defining storage configuration, common pieces of equipment will likely be needed to
interconnect energy storage to the electric grid. Such equipment includes:
• Transformers
• Interrupting devices (breakers and switches)
• Protection and communication systems
• Monitoring and control systems
• Inter- and intra-system wiring
To develop estimates of the magnitude of copper demand associated with installed applications of energy storage, KEMA estimated representative configurations based on manufacturer interviews and industry experience. KEMA used copper intensity ranges from published research, interviews with storage developers and interviews with copper experts.
The ranges address two sources of uncertainty:
• Configurations
– A variety of potential applications, from low-voltage to high-voltage installations, means that there can be a variety of electrical equipment associated with storage installations. Furthermore, best practices are yet to develop.
• Electrical equipment copper intensity
– Electrical equipment offers a range of copper intensities, depending on sizes, but also depending on market offerings. KEMA used reasonable ranges for the devices to note impacts on total tonnage.
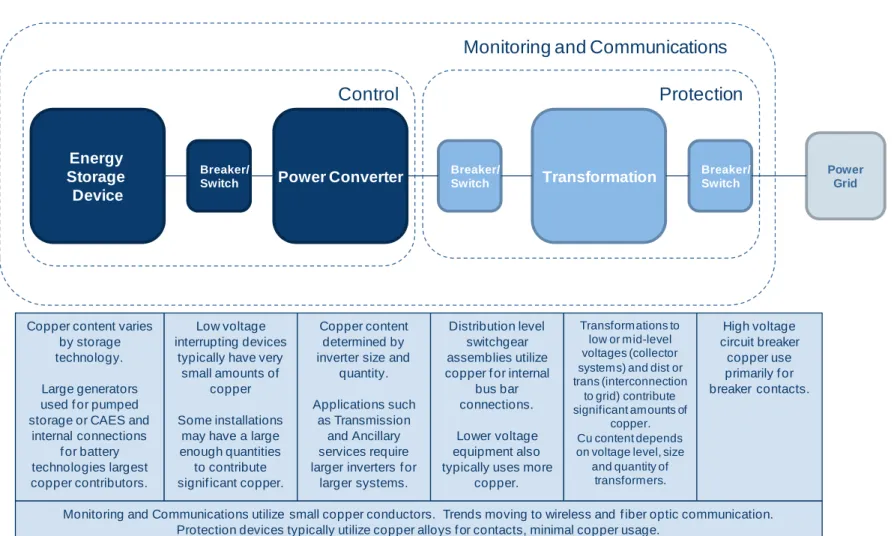
Figure 9 depicts a generic configuration, representative of those used to estimate the copper intensity of storage installations. Storage device intensities described prior were used to estimate unit intensities. The copper content of the associated electrical equipment was estimated based on sample configurations either planned or already in the field. The copper content of the electrical equipment was estimated based on assumptions about equipment sizes and types. The following are the ranges in quantity and unit size, respectively, per installation:
• Power transformers—1 to 11; 25 kW to 360 MW
• Breakers—1 to 20; 480V to 138 kV
• Generators—2 to 200; 100 kW to 300 MW
• Inverters—1 to 48; 5 kW to 3.5 MW
• Cooling—small window units to large rooftop systems
Figure 9. Storage Installation Methodology 33 Energy Storage Device Breaker/
Switch Power Converter
Breaker/
Switch Transformation
Breaker/ Switch
Monitoring and Communications
Protection
Control
Power Grid
Copper content varies by storage technology.
Large generators used f or pumped storage or CAES and
internal connections f or battery technologies largest copper contributors. Low voltage interrupting devices
typically have very small amounts of
copper
Some installations may have a large enough quantities
to contribute signif icant copper.
Copper content determined by inverter size and
quantity. Applications such as Transmission and Ancillary services require larger inverters f or larger systems. Distribution level switchgear assemblies utilize copper f or internal bus bar connections. Lower voltage equipment also typically uses more
copper.
Transformations to low or mid-level voltages (collector systems) and dist or trans (interconnection
to grid) contribute significant amounts of
copper. Cu content depends on voltage level, size
and quantity of transformers. High voltage circuit breaker copper use primarily f or breaker contacts.
Monitoring and Communications utilize small copper conductors. Trends moving to wireless and f iber optic communication. Protection devices typically utilize copper alloys f or contacts, minimal copper usage.
Control utilize smaller copper conductors.
4.
Relevant Initiatives in Energy Storage
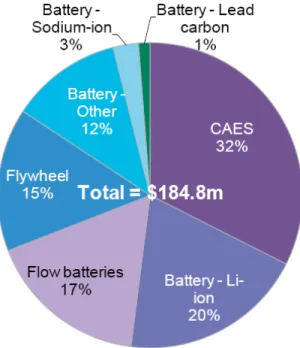
A number of policy initiatives are underway that will impact the energy storage market in the U.S.—some directly and some indirectly. A notable initiative that has had a strong impact in the past year, and whose efforts will likely continue to make an impact in coming years, is the provision of matching funds by the U.S. Department of Energy (DOE) to support energy storage projects. According to a 2011 report by the Electricity Advisory Committee on energy storage activities in the U.S., the funds provided by the federal government totaled almost $185 million and supported projects valued roughly at $772 million in total. Associated with these projects was approximately 537 MW of storage capacity, including storage for ancillary services (20 MW), distributed storage (7.5 MW), CAES (450 MW), and storage associated with renewable power (57 MW). Figure 10 illustrates the breakdown of American Recovery and Reinvestment Act funding by storage technology type.
Figure 10. DOE Smart Grid Demonstration Grants
Source: Bloomberg Finance, April 2011
In addition to the injection of public funding for demonstration projects, the U.S. storage market has also witnessed a surge of private investment. According to a recent survey by Ernst & Young, energy storage was the largest segment for cleantech investment in the third quarter of 2011, increasing by 1,932 percent over the same period last year. Overall, the energy storage
segment raised $865.2 million up through the third quarter of 2011, with $421 million raised during the third quarter.
Several recent national and regional policy initiatives are also likely to impact the U.S. energy storage market in the near- to mid-term. Figure 11 provides a summary of some of the notable policy initiatives likely to impact the U.S. energy storage market.
Figure 11. Policy Initiatives Shaping the U.S. Energy Storage Market
In October of 2011, FERC issued a final rule on frequency regulation compensation, which requires ISOs/RTOs to compensate frequency regulation resources—including energy
storage—based on actual performance.8 The order, Order No. 755, directs the ISOs/RTOs to create market rules that would implement a “pay for performance” approach, which could result in higher payments for faster responding resources like storage. Expectations are that this rule could have the effect of increasing the revenue that storage devices obtain for providing
ancillary services compared to other traditional resources. This is because many energy
8
FERC Final Rule RM11-7-000; FERC Order No. 755, 137 FERC ¶ 61,064 (2011).
Initiative Description Market impact
FERC Final Rule
(RM11-7-000; Final Order No. 755)
Clarifies frequency regulation compensation for quick-response storage services in the wholesale markets (Oct. 2011)
TIME FRAME: Near/Mid-term
• Potential increase in regulation revenues due to higher value with f ast response resources
California State Law
(AB 2514)
Sets energy storage procurement targets in the State of California (Enacted 2010)
TIME FRAME: Near/Mid-term
• Increased awareness of storage capability and benef it
U.S. STORAGE Act of 2011 (S.1845)
Legislation would provide tax incentives for grid storage as well as for on-site and residential applications. (Introduced Nov. 2011)
TIME FRAME: Longer-term
•Accelerate the market by def raying initial investment ISO/RTO Ancillary Markets Currently Open to Storage (PJM, NYISO, ISO-NE, MISO, CAISO)
Five open-bid energy markets including ancillary market participation, are now accessible to energy storage: PJM, NYISO, ISO-NE, MISO and CAISO (Underway as of 2011)
TIME FRAME: Near-term
• Creates an incentive to use storage f or regulation
ISO/RTO Storage Ancillary Market Participation Pending
(ERCOT)
ERCOT is considering new rules for storage participation in the ancillary services markets. (In process as of 2011)
TIME FRAME: Near/Mid-term
• Expanded market f or regulation
Renewable Portfolio Standards (29 states & DC – 16 state w/solar & DG provisions)
RPS mandates and goals to increase the relative share of renewable capacity / generation. Targets range from 10% - 40% (Hawaii)
TIME FRAME: Near/Mid-term
• Increased need to mitigate impacts of intermittency (load f ollowing, regulation, voltage disturbances, etc.)
storage devices have the ability to respond quickly, compared to other resources, and a pay-for-performance approach would reward fast response devices. Final rules for compensation, however, have yet to be determined but are expected to be unveiled in 2012.
Assembly Bill (AB) 2514, from California, is likely to impact all of the applications for energy storage reviewed in this study. This is because it prompts the evaluation of energy storage procurement targets that are technology and application neutral. Though the scope of the policy applies to California only, it could indirectly affect the market as a whole by increasing the awareness of storage capabilities.
The U.S. Storage Act of 2011 represents a push by some members of Congress to create tax incentives for energy storage investments. Various versions of a tax incentive have been discussed, and it is feasible that future efforts could ultimately turn one of these versions into law, affecting all storage applications and potentially accelerating the market by defraying costs. Currently, the ancillary services markets in five of the U.S. ISOs/RTOs are accessible to energy storage: PJM Interconnection, New York ISO, ISO-New England, Midwest ISO and CAISO.9 ERCOT is also considering new rules for energy storage participation in the ancillary services markets. New rules by the Electric Reliability Council of Texas (ERCOT) on storage’s ability to provide ancillary services will potentially open the market further in this area.
Finally, renewable portfolio standards are a strong driver for the renewable energy market. This, in turn, will affect the markets for ancillary services and renewable integration applications of energy storage.
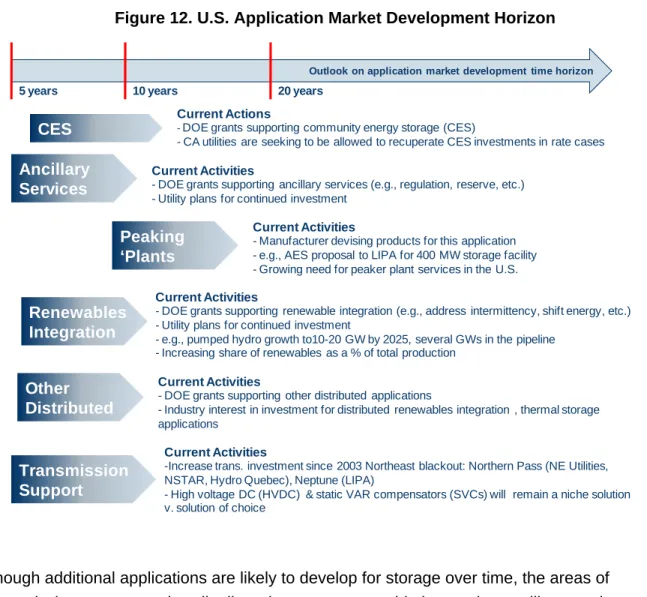
Figure 12 provides an overview of recent market developments, by application, noting activities prompted by recent investments and policy. The figure also notes expected time horizons for the development of various application markets.
9
CAISO is moving towards inclusion of energy storage for ancillary services with revised market rules undergoing implementation.
Figure 12. U.S. Application Market Development Horizon
Though additional applications are likely to develop for storage over time, the areas of
transmissions support, other distributed storage, renewable integration ancillary services, and CES are expected to be the primary applications for grow in the near term.
15
Current Actions
-DOE grants supporting community energy storage (CES)
- CA utilities are seeking to be allowed to recuperate CES investments in rate cases
Current Activities
- DOE grants supporting ancillary services (e.g., regulation, reserve, etc.) - Utility plans for continued investment
Current Activities
- DOE grants supporting renewable integration (e.g., address intermittency, shift energy, etc.) - Utility plans for continued investment
- e.g., pumped hydro growth to10-20 GW by 2025, several GWs in the pipeline - Increasing share of renewables as a % of total production
Current Activities
- DOE grants supporting other distributed applications
- Industry interest in investment for distributed renewables integration , thermal storage applications
Current Activities
-Increase trans. investment since 2003 Northeast blackout: Northern Pass (NE Utilities, NSTAR, Hydro Quebec), Neptune (LIPA)
- High voltage DC (HVDC) & static VAR compensators (SVCs) will remain a niche solution v. solution of choice
Outlook on application market development time horizon
5 years 10 years 20 years
Current Activities
- Manufacturer devising products for this application - e.g., AES proposal to LIPA for 400 MW storage facility - Growing need for peaker plant services in the U.S.
CES Ancillary Services Renewables Integration Other Distributed Transmission Support Peaking ‘Plants
5.
Results of Market Penetration Study
5.1 Market
Summary
Currently, the largest application for storage is distributed storage, primarily in the form of thermal storage used for reducing thermal heating or cooling loads. Renewable energy applications constitute the second largest storage application in terms of installed capacity, primarily due to pumped hydro and CAES systems. The remaining applications and technologies currently constitute less than 10 percent of the installed capacity. Figure 13 depicts the estimated energy storage capacity installed in the U.S. by technology type, and Figure 14 depicts the same by application.
Figure 13. Estimated Current Installed Capacity by Technology (MW)
500 1,000 55 11545 25 18 28 0 Pumped Hydro Thermal Li‐ion CAES Lead Acid Nickel Sodium Flywheels Flow
Figure 14. Estimated Current Installed Capacity by Application (MW)
The largest growth in energy storage in the near term is expected to be in other distributed storage, ancillary services, and renewable integration applications. This reflects current
investments and trends. The growth in CES and transmission is expected to be gradual, though the potential for the overall CES market is expected to be quite large. Figure 15 illustrates the estimated five-year incremental growth in storage by application.
Figure 15. Estimated Five-year Incremental Growth, by Application, with No Credit
48 2 44 685 1,010 Ancillary Services CES Transmission Renewables Other Distributed
208
5 3
136
284
Ancillary
Services
CES
Transmission
Renewables
Other
Distributed
Figure 16 depicts the five-year incremental growth in storage by technology, with no tax
incentive. Given the development timescale, pumped hydro is not expected to grow significantly over the next five years. Battery technologies and thermal storage are expected to be the strongest growth areas in the near term.
Figure 16. Estimated Five-year Incremental Installed Capacity by Technology, No Credit
A financial incentive for energy storage could significantly affect the market’s size. In particular, CES and transmission applications would be the most affected, in terms of potential percentage change, and renewable integration and other distributed storage would be the most affected in terms of absolute MWs. Figure 17 illustrates the impact of a tax incentive of incremental market growth between now and the next five years.
222
255
7
72
1
0
77
2
Thermal
Li
‐
ion
CAES
Lead
Acid
Nickel
Sodium
Flywheels
Flow
Figure 17. Estimated Five-year Incremental Installed Capacity by Financial Incentive Scenario
Figure 18 depicts the projected market for storage without a tax incentive by application, and Figure 19 does the same by technology. Distributed storage already has a large share of the market and will likely continue to grow. Energy storage for renewables also has a significant share and will likely experience growth. Overall, the market adoption for ancillary services will likely accelerate but still constitute a smaller share of energy storage.
0 500 1,000 1,500 2,000 2,500
Tax Credit No Tax Credit
In
cr
em
en
ta
l
In
st
alle
d
Ca
p
ac
ity
(MW
)
Other Distributed Renewables Transmission CES Ancillary Services 630 2,300Figure 18. Estimated Five-year Total Installed Capacity by Application (MW), No Incentive
Traditional storage technologies are expected to stay strong over the next five years, as a share of total storage technologies. For example, thermal storage is expected to stay as a large share of total storage, and even without growth, pumped hydro will likely stay a large share. However, growth is expected for the other technologies, including strong growth for lithium-ion batteries.
Figure 19. Estimated Five-year Installed Capacity by Technology (MW), No Incentive
256
7
47
820
1,294
Ancillary
Services
CES
Transmission
Renewables
Other
Distributed
500
1,221
310
122
118
26 18
105 2 0
Pumped
Hydro
Thermal
Li
‐
ion
CAES
Lead
Acid
Nickel
Sodium
Flywheels
Flow
Fuel
Cells
5.2
Market Drivers & Trends
The following sections provide a summary of the key trends shaping the direction and growth of the U.S. energy storage markets:
Ancillary Services/Regulation—Currently, regulation requirements as a percentage of peak load is on the order of one to two percent. With intermittent renewable generation growing to a significant portion of total generation, regulation requirements are expected to grow. Estimates range from a doubling to a tripling of regulation requirements in the wholesale markets by 2020. In addition, the rules governing the participation of energy storage in the ancillary services markets are evolving. The trend is towards an opening of the markets for energy storage technologies, and potentially revised reward mechanisms. Other resource types, such as demand response resources, however, will also likely compete for the expanding market. Over time, as experience with energy storage grows, it is expected that the regulation application will grow outside of the wholesale markets as well.
Renewable Energy Integration—The renewable energy integration storage application is currently evidenced in island grid systems such as the state of Hawaii, where requirements have been put in place to limit the ramping of intermittent renewable sources. In the continental U.S., utilities and the ISO/RTOs understand the potential problems of intermittent generation. However firming requirements are less prevalent. Nevertheless, several demonstrations and test project have begun to increase the size of this market. As the implementation of renewable resources grows, so too will the potential for energy storage for renewable energy integration. Overall, the requirements for addressing renewable intermittency will have a strong impact on the market for this application.
CES Application—Bundled services are generally targeted towards utility-use applications under the CES concept. While bundled services can offer a range of promising benefits, market penetration is subject to the utility timeline for deployment. The CES market tends to be the largest evaluated market in the U.S.—the ability to group multiple applications helps achieve better paybacks and thus higher levels of penetration. However, regulated utilities tend to be highly risk averse. Though the CES market is large, the timeline to large-scale deployment is longer than is typically seen with ancillary services and renewable integration applications. Utilities currently demonstrating or testing CES technologies are American Electric Power, Con Edison, Detroit Edison, Duke Energy, First Energy, and Southern California Edison. Some utilities are currently seeking mechanisms to rate-base CES investments.
Transmission Support— The use of storage for transmission support has been demonstrated through installed projects. However, transmission support services are targeted towards the utility sector, and adoption can be slow due to financing and risk aversion. As such, these markets show promise but how the applications get financed is an open question.
Other Distributed Storage—Thermal storage is growing in market size due to its low cost and recent developments in control technology. Recently, thermal energy storage has been used in demonstrations for the provision of service in the wholesale markets.10 In addition, the
microgrid market is expected to grow quickly in the education campus and military sectors. While several technologies are in the demonstration phase, many believe this market will develop quickly.
5.3
Market Potential Conclusions
In assessing the current and near-term market for grid energy storage, KEMA analyzed the markets for the applications poised for the strongest near-term growth. These include:
• Ancillary services
• Renewables energy integration
• Transmission support
• Community energy services
• Other distributed applications
Ancillary services are the most promising near-term application. However, this market, due to an increasing number of participants with other technologies capable of providing services and due to fluctuating prices, is not expected to grow in the long term. In the near term, the
application is poised for growth.
Renewable energy integration offers a large potential market. However, to date, these applications have been seen only in island applications where the renewable intermittency is already causing issues. In the continental U.S., where penetration of renewables is much less, few requirements exist. This market’s development in the long term will be dependent on whether storage becomes a requirement for renewable integration to the grid.
10
PJM is evaluated the ability of electric water heater thermal storage to provide regulation services via dispatches by PJM.
CES offers the most potential of the applications in the long term because the application taps into multiple revenue sources and the product lends itself to easy installation and production. However, the market will likely be driven by regulated utilities, which likely indicates a slower rise to mass deployment compared to other markets.
The market’s development for transmission support is likely to be slow in the near term due to long-time horizons with adoption and difficulties in finding financing. The market for CES could potentially grow faster than transmission support, as the sizes of the projects tend to be smaller and therefore lower cost.
Other distributed storage will likely continue to grow in the near term. This is in large part due to expectations about the adoption of low-cost thermal energy storage.
In the short term, based on planned investments and policies, the market for renewable
integration, other distributed storage, and ancillary services are likely the strongest growth areas in the market.
6.
Results of Copper Demand Analysis
6.1 Copper
Demand
Summary
The near-term U.S. energy storage market could carry an associated demand for copper of thousands of tons of copper. The primary drivers for this demand are expected to be storage associated with ancillary services and renewable energy integration. Additional markets, poised for growth in the longer term, carry additional potential for copper demand.
Figure 20 illustrates the results for storage associated with renewable energy integration. The renewable energy integration applications appear to have a strong associated demand for copper due to expectations about strong market growth and sizeable intensities. In particular, lithium-ion appears to carry the largest associated demand in this area over the near term.
Figure 20. Renewables Integration Copper Demand
Figure 21 illustrates the results for the ancillary services market. Energy storage for ancillary services appears to have a strong associated demand for copper, due to its relatively high copper intensities and expectations about near-term growth.
Figure 22illustrates the results for the transmission services application. Transmission is potentially limited in its near-term associated demand for copper though the copper intensities can be relatively strong. This limitation is because of expectations about slow market growth.
Figure 22. Transmission Services Copper Demand
Figure 23 illustrates the results for the other distributed storage applications. Though the
market for thermal storage is relatively large, the copper intensity is relatively limited, limiting the overall associated copper demand. The markets of non-thermal types of other distributed storage are likely to be slow, limiting near-term demand for copper.
Figure 23. Other Distributed Storage Copper Demand
Figure 24 illustrates the results for CES. CES appears to be a limited market for copper intensity in the near term, due to expectations about limited market growth over the next five years. However, because of its relatively high copper intensity and potential for large mid- to long-term growth, this area could have strong associated copper demand.
Figure 24. CES Copper Demand
6.2
Storage Unit Copper Intensities
The per-unit copper potential of storage devices can vary significantly by technology. However, copper can play a fundamental role in their make-up. For example, some battery chemistries use copper in battery cells as current collectors. An additional component where copper is used is in internal wiring to connect the battery cells. Battery voltages and energy densities can determine the wiring needs for a storage unit. For many types of mechanical storage, motors or large generators can be significant contributors to copper intensity.
Figure 25 summarizes the copper densities in tons per MW by technology type. Lithium-ion, flow, and sodium batteries as well as flywheels, CAES, and pumped hydropower are strong users of copper at the unit level.
Figure 25. Storage Unit Copper Intensities
6.3
Copper Intensities of Installed Storage Applications
Figure 26 illustrates the copper intensity of storage, in tons per MW, by technology, and
application. The copper content of storage installations appears to be significant—ranging from zero to more than three tons per MW. The estimates vary based on technology type,
configuration, and type of electrical equipment used for the installation. On average, CES, transmission and ancillary services offer sizeable intensities, and renewable and other
distributed storage offer lower intensities. The other distributed storage market is dominated by thermal storage, which has lower intensities.
Technology Copper Density (tons/MW) Comments Unit Copper Potential
Pumped Hydro 0.11 – 0.16 Generator only; full configuration follows
CAES 0.18 – 0.26 Generator & compressor motor only; full configuration follows
Flywheel 0.23 Defined as module only
Lithium-ion 0.22 Battery pack
Sodium 0.25 Battery pack
Flow 0.27 Battery pack
Lead Acid 0.01 Limited to no use in battery pack
Nickel 0.08 Limited use in battery pack
Thermal 0.03 Limited copper in device or for installation
Figure 26. Copper Intensity of Storage Installations
6.4
Copper Intensity of Associated Industries
In addition to prompting demand based on its own installations, energy storage has the potential to promote other industries where market is copper is intensive. For example, energy storage has the potential to facilitate the integration of distributed and centralized renewable generation to the U.S. grid. In particular, storage can help address the impacts of renewable intermittency, at the generation source or in the wholesale markets, and it can help address stymied
investments in the transmission that connects remote renewable sources. Debate today focuses on whether storage should be used as an integration tool for renewable generation, as compared to other resources. Figure 27 illustrates the different options for renewable
integration, as presented by the American Wind Energy Association.
Fl yw heel Li ‐ Io n Li ‐ Io n Le ad Ac id Ni ck e l Le ad Ac id Pu m pe d Hy dr o CA ES Lit hiu m Io n Ni ck e l Fl ow So di um Li ‐ Io n Th e rm al Le ad Ac id
Estimated Intensity Tons Cu/MW 2.2 2.7 2.7 2.5 2.6 1.4 0.3 0.5 2.6 1.0 2.5 3.0 3.5 0.0 0.4
Low Tons Cu/MW 2.1 2.5 2.1 1.9 2.0 1.4 0.3 0.4 2.2 1.0 2.3 2.6 2.7 0.0 0.4
% Difference from Baseline 4% 5% 22% 24% 23% 1% 7% 9% 13% 4% 7% 13% 21% 0% 10%
High Tons Cu/MW 3.4 3.8 2.9 2.7 2.8 1.7 0.5 0.7 3.8 1.1 3.9 4.0 3.7 0.0 0.5
% Difference from Baseline 55% 41% 7% 8% 8% 20% 62% 58% 46% 3% 59% 36% 6% 0% 10%
Transmission Other Distributed
Technologies
Application Ancillary
Figure 27. Flexibility Supply Curve
Source: AWEA 2009
In this chart, storage is presented as the most expensive option. However, though storage costs are declining, it is noted that costs may not be the only driver in determining which
solution is the better approach. Other resources listed in Figure 27 may have limited capacity or trade-offs that favor storage for some applications, such as emissions, ramping limitations, societal costs, or fatigue. Studies are ongoing to determine the relative emissions effects of storage devices and the realizable potential of demand response, and conversely,
developments are being made to increase the flexibility of traditional gas turbines and wind turbines in order to minimize the trade-offs listed. Nevertheless, it is expected that energy storage could play a role in the integration of renewable energy.
Per prior studies commissioned by the CDA, the copper intensity of centralized renewable plants can be significant. The copper intensity of an average wind farm can total from about three tons to six tons per MW while that of an average centralized solar plant can total from around two tons to five tons per MW.
High
Cost
Low Cost