NSAA STATISTICS REPORT
2019 - 2020
2
Introduction
The NSAA Statistics Report is published annually and provides key system performance data for the fiscal period and, in comparison, to previous years.
The Agency continues to increase the number of apprentices in the system. Ongoing efforts to contact employers who were not engaged in the apprenticeship system for over five years has resulted in the reengagement of 224 employers who registered a new apprentice.
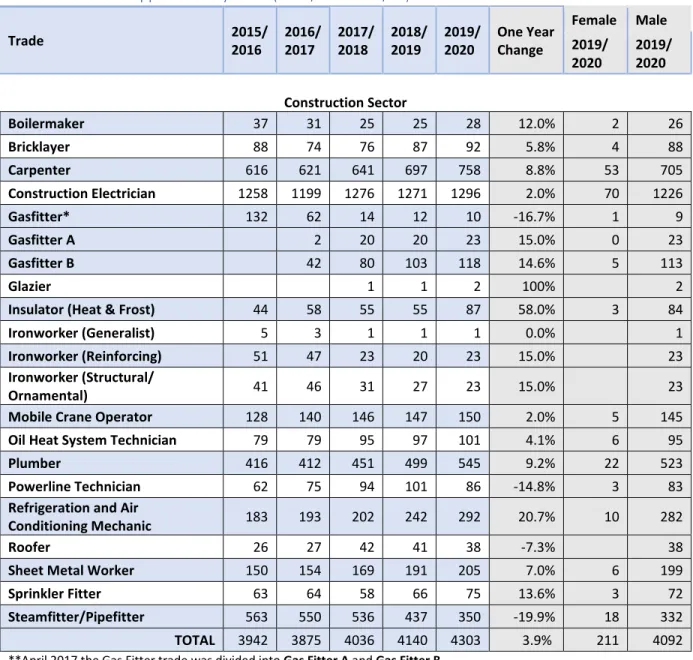
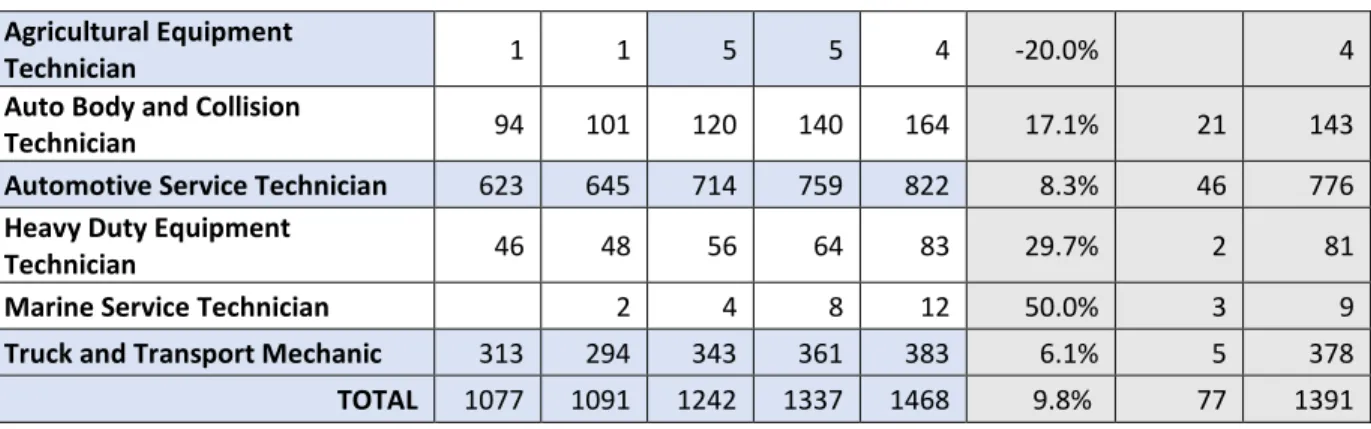
The number of apprentices has increased by 5.3% since 2018-2019 and is led by significant increases in Insulator (58%), Heavy Duty Equipment Technician (29.7%), Refrigeration and Air Conditioning Mechanic (20.7%), Auto Body and Collision Technician (17.1%), Sprinkler Fitter (13.6%) , Gasfitter (11.8%), and Machinist (10.6%). The following trades have seen significant decreases in the number of apprentices: Steamfitter/Pipefitter (-29.9%), Instrumentation and Control Technician (-15.7%), and Powerline Technician (-14.8%.).
All four sectors experienced increases in the number of apprentices: Motive Power (9.8%), Service (8.1%), Industrial/Manufacturing (4.3%), and Construction (3.9%).
The percentage of women registered as apprentices increased to 7.4%, and 15.3% of apprentices identified as diverse. The Construction Electrician, Carpenter, Automotive Service Technician and Welder trades had the highest number of female apprentices at the end of the year.
Effective March 2019, the Motor Vehicle Body Repairer (Metal and Paint) trade name was changed to
Auto Body and Collision Technician and the Sprinkler System Installer trade name was changed to
3
Apprentices
Figure 1 highlights the total number of apprentices from 2010-2020. Table 1 outlines the number of apprentices by trade organized by sector.
Figure 1: Active apprentices by fiscal year
Table 1: Number of apprentices by trade (2015/16 – 2019/20)
Trade 2015/
2016
2016/ 2017
2017/ 2018
2018/ 2019
2019/ 2020
One Year Change
Female Male 2019/
2020
2019/ 2020
Construction Sector
Boilermaker 37 31 25 25 28 12.0% 2 26
Bricklayer 88 74 76 87 92 5.8% 4 88
Carpenter 616 621 641 697 758 8.8% 53 705
Construction Electrician 1258 1199 1276 1271 1296 2.0% 70 1226
Gasfitter* 132 62 14 12 10 -16.7% 1 9
Gasfitter A 2 20 20 23 15.0% 0 23
Gasfitter B 42 80 103 118 14.6% 5 113
Glazier 1 1 2 100% 2
Insulator (Heat & Frost) 44 58 55 55 87 58.0% 3 84
Ironworker (Generalist) 5 3 1 1 1 0.0% 1
Ironworker (Reinforcing) 51 47 23 20 23 15.0% 23
Ironworker (Structural/
Ornamental) 41 46 31 27 23 15.0% 23
Mobile Crane Operator 128 140 146 147 150 2.0% 5 145
Oil Heat System Technician 79 79 95 97 101 4.1% 6 95
Plumber 416 412 451 499 545 9.2% 22 523
Powerline Technician 62 75 94 101 86 -14.8% 3 83
Refrigeration and Air
Conditioning Mechanic 183 193 202 242 292 20.7% 10 282
Roofer 26 27 42 41 38 -7.3% 38
Sheet Metal Worker 150 154 169 191 205 7.0% 6 199
Sprinkler Fitter 63 64 58 66 75 13.6% 3 72
Steamfitter/Pipefitter 563 550 536 437 350 -19.9% 18 332
TOTAL 3942 3875 4036 4140 4303 3.9% 211 4092
**April 2017 the Gas Fitter trade was divided into Gas Fitter A and Gas Fitter B. 5381
5675
5937 6030 5923
6260 6167
6611
6888
7254
4000 4500 5000 5500 6000 6500 7000 7500
4
Motive Power Sector Agricultural Equipment
Technician 1 1 5 5 4 -20.0% 4
Auto Body and Collision
Technician 94 101 120 140 164 17.1% 21 143
Automotive Service Technician 623 645 714 759 822 8.3% 46 776
Heavy Duty Equipment
Technician 46 48 56 64 83 29.7% 2 81
Marine Service Technician 2 4 8 12 50.0% 3 9
Truck and Transport Mechanic 313 294 343 361 383 6.1% 5 378
TOTAL 1077 1091 1242 1337 1468 9.8% 77 1391
Industrial/Manufacturing Sector
Boat Builder 18 15 19 23 27 17.0% 4 23
Industrial Electrician 196 151 157 176 188 7.0% 19 169
Industrial Mechanic (Millwright) 166 152 185 189 204 7.9% 16 188
Instrumentation and Control
Technician 72 75 76 70 59 -15.7% 4 55
Machinist 64 62 73 66 73 10.6% 6 67
Metal Fabricator (Fitter) 123 139 148 147 136 -7.5% 21 115
Power Engineer 167 169 178 194 191 -1.6% 6 185
Power Engineer (Plant Operator) 4 16 22 33 49 48.0% 1 48
Welder 197 193 206 218 237 8.7% 38 199
TOTAL 1007 972 1064 1116 1164 4.3% 115 1049
Service Sector
Baker 2 2 0% 2
Cook 223 215 257 270 294 8.9% 125 169
Hairstylist 6 9 8 -11.0% 7 1
Landscape Horticulturalist 9 12 12 14 15 7.1% 2 13
TOTAL 232 227 275 295 319 8.1% 136 183
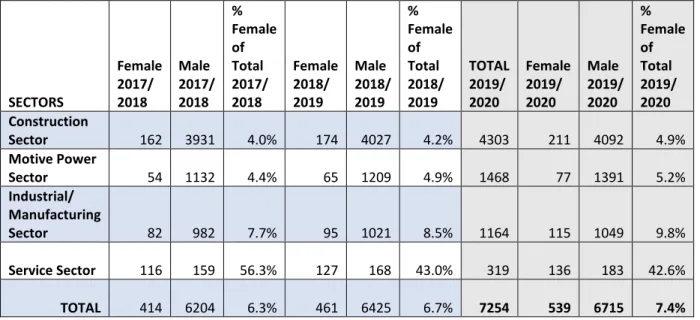
Increasing the participation, retention, and completion of women in the trades remains a top priority of the Nova Scotia Apprenticeship Agency. (Table 2).
Table 2: Total apprentices by sector and 2019-2020 gender and diverse community representation
Total Apprentices by Sector
2015/ 2016
2016/ 2017
2017/ 2018
2018/ 2019
2019/ 2020
One Year Change
Female 2019/
2020
Male 2019/
2020
Identifying as from a
Diverse community
2019/2020 Construction Sector 3942 3875 4036 4140 4303 3.9% 211 4092 1577
Motive Power
Sector 1077 1089 1238 1337 1468 9.8% 77 1391
655
Industrial/ Manufacturing Sector
1007 972 1064 1116 1164 4.3% 115 1049
321
Service Sector 232 227 206 295 319 8.1% 136 183 192
TOTAL 6259 6167 6611 6888 7254 5.3% 539 6715 *
*’Diverse’ refers to individuals who identify as a member of a community underrepresented in the Apprenticeship and Trades
Qualification System. Individuals may identify as being from more than one diverse community.
The Industrial/Manufacturing Sector experienced the highest increase in the number of female apprentices likely due to the efforts of our Women in the Skilled Trades program that offers incentives to employers to hire female apprentices. Women in trades now represent 7.43% of apprentices, due to an increase of women in underrepresented trades of 78 women and a small increase in the number of women in the Service Sector.
5 Table 3: Changes in gender representation in each of the Sectors
SECTORS Female 2017/ 2018 Male 2017/ 2018 % Female of Total 2017/ 2018 Female 2018/ 2019 Male 2018/ 2019 % Female of Total 2018/ 2019 TOTAL 2019/ 2020 Female 2019/ 2020 Male 2019/ 2020 % Female of Total 2019/ 2020 Construction
Sector 162 3931 4.0% 174 4027 4.2% 4303 211 4092 4.9%
Motive Power
Sector 54 1132 4.4% 65 1209 4.9% 1468 77 1391 5.2%
Industrial/ Manufacturing
Sector 82 982 7.7% 95 1021 8.5% 1164 115 1049 9.8%
Service Sector 116 159 56.3% 127 168 43.0% 319 136 183 42.6%
TOTAL 414 6204 6.3% 461 6425 6.7% 7254 539 6715 7.4%
Figure 2 represents the top five trades based on the number of registered apprentices. The top 5 trades did not change from 2018-2019.
Figure 2: Five trades with the most apprentices (2015/16 – 2019/20)
Table 4. The number of new apprentices in 2019-2020 has remained steady with 1480 new apprentices registered in 2019-2020.
Table 4: Newly registered apprentices in Nova Scotia by fiscal year
Year Total
NEW*
Total Active Apprentices (at end of period)
Percentage of Total Apprentices
2015/2016 1374 6260 21.9%
2016/2017 1416 6167 22.9%
2017/2018 1522 6611 23%
2018/2019 1490 6888 21.6%
2019/2020 1480 7254 20.4%
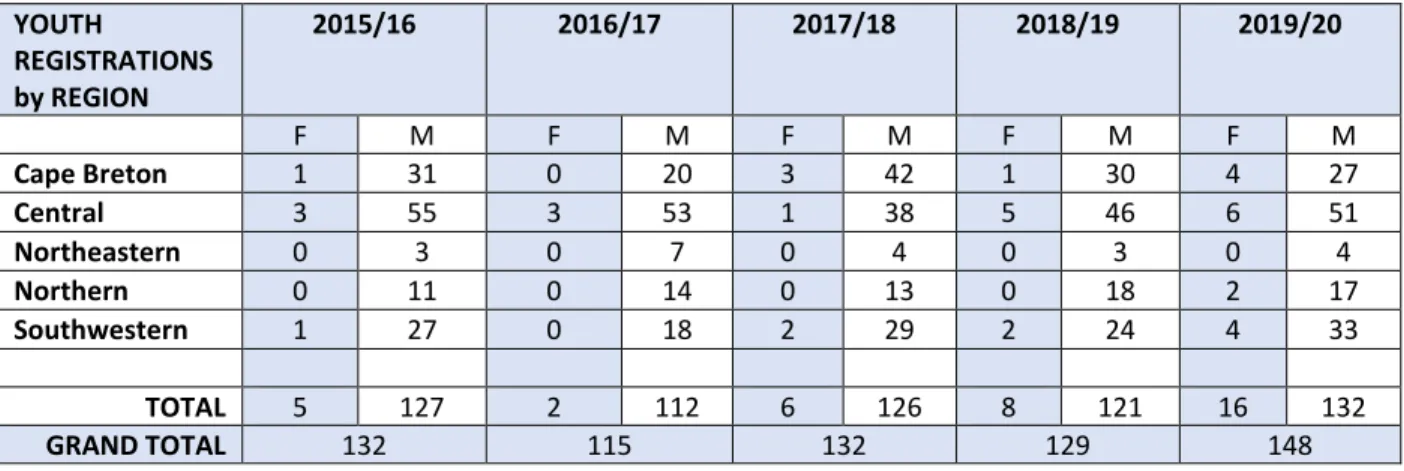
Youth Apprentices
The Nova Scotia Apprenticeship Agency actively engages youth to explore career opportunities in the skilled trades. This is accomplished by in-class presentations from NSAA throughout the school year, hands-on activities at various youth and career fairs, as well as the provision of funding to organizations that engage students and collaborate on initiatives with educators, schools, and industry
representatives to offer experiential opportunities in the skilled trades. The number of youth
apprentices has increased by 15.5% since 2018-2019. The number of female youth apprentices has also doubled since 2018-2019.
1271 759 697 499 361 1296 822 758 545 383 0 200 400 600 800 1000 1200 1400
Construction Electrician Automotive Service Technician
Carpenter Plumber Truck and Transport
Mechanic 2015/2016 2016/2017 2017/2018 2018/2019 2019/2020
6 Table 5: Youth apprentice registrations by fiscal year and region
YOUTH
REGISTRATIONS by REGION
2015/16 2016/17 2017/18 2018/19 2019/20
F M F M F M F M F M
Cape Breton 1 31 0 20 3 42 1 30 4 27
Central 3 55 3 53 1 38 5 46 6 51
Northeastern 0 3 0 7 0 4 0 3 0 4
Northern 0 11 0 14 0 13 0 18 2 17
Southwestern 1 27 0 18 2 29 2 24 4 33
TOTAL 5 127 2 112 6 126 8 121 16 132
GRAND TOTAL 132 115 132 129 148
School visits take place in a classroom environment and other venues. In-school visits are supported through coordination with the Department of Education and Early Childhood Development, as well as with Youth Pathways Consultants at each Regional Centre for Education and Conseil Scolaire Acadien Provincial. In-school presentations are lower in number this year as NSAA was without a Youth Outreach Coordinator from August to November.
Apprenticeship information is also presented and shared at career fairs, panel discussions, professional development events held for teachers and guidance staff, and industry events. Table 6 shows the number of in-school and additional presentations.
Table 6: School visits and presentations
IN-SCHOOL PRESENTATIONS 2015/16 2016/17 2017/18 2018/19 2019/20
Number of Presentations 67 18 66 62 6
Number of Schools 44 11 54 44 5
Number of Students 1418 339 1593 1353 187
ADDITIONAL
PRESENTATIONS (outside of school)
Number of Presentations 36 51 53 39 39
Direct Interaction with Attendees 1704 2626 1858 1332 1027
Number attending all presentations
4084 5073 7555 3909 1810
The NSAA provides funding to a number of Youth Program delivery partners including Skills Canada Nova Scotia, Techsploration, the Trades Exhibition Hall (TEH), and the Mobile Construction Experience (MCE), the latter two hosted by the Nova Scotia Construction Sector Council. Youth Program delivery partners embed the apprenticeship pathway message into a variety of activities that impact both individual participants, community partners and industry. Figures 3, 4 and 5 (below) show the participants and partners engaged in youth outreach.
The large increase in visitors to the Trades Exhibition Hall (TEH) is due to a number of factors. Usually the TEH does not offer tours/activities during the summer months, but during the summer of 2019 the Nova Scotia Construction Sector Council (NSCSC) partnered with the NSAA to host a Skilled Trades Family Boot Camp. Many organizations who had not visited before participated in this Camp and made return visits in the Fall and Winter. Additionally, many of the NSAA’s diverse community partners visited the TEH. The Aboriginal Peoples Training and Employment Commission (APTEC) and Mi’kmaw
Kina’matnewey (MK) added adult tours in addition to its annual youth tours and also arranged a tour for guidance counselors and chaperones; African Nova Scotian Affairs (ANSA) and African Nova Scotian community partners also visited. National representatives of the Canadian Council of Directors of Apprenticeship (CCDA) Essential Skills Community of Practice, hosted in Halifax by the NSAA, and the Occupational Health and Safety Branch of Labour and Advanced Education also toured the Hall in 2019-2020.
7 Figure 3: Number of participants by funded partner activity – Trades Exhibition Hall and Mobile
Construction Experience
Figure 4: Number of participants by funded partner activity – Skills Canada Nova Scotia and Techsploration
Since 2008, the NSAA has supported summer sector youth apprenticeship programs for approximately 1000 students in Grades 10 and 11. These programs are delivered in partnership with the Construction Association of Nova Scotia, Automotive Sector Council of Nova Scotia, and the Nova Scotia Tourism Human Resources Sector Council. Participants explore the skilled trades through a paid summer work placement combined with some in-class training. Participating students obtain high school credits as well as apprenticeship hours of practical credit. Building Futures for Youth (BFY) is the original program and connects youth to the Construction Sector; TestDrive (TD) supports students in the Motive Power Sector; and Serve It Up (SIU) supports students in the Service Sector with a specific focus on the Cook trade. Note, TestDrive was under review and did not operate as usual in 2019-2020.
Figure 5: Number of participants by funded partner activity – Building Futures for Youth, TestDrive, and Serve It Up
This figure shows the number of students completing all aspects of the program for each of the years listed. TestDrive was under review and did not operate as usual in 2019-2020.
908 1358 1446 1216
7005
730
92 150 194 179 298 9
0 1000 2000 3000 4000 5000 6000 7000 8000
2015-16 2016-17 2017-18 2018-19 2019-20 2019-20
Trades Exhibition Hall Mobile
Construction Experience
Number of Participants By Funded Partner Activity
2015-2020
Youth Participants Number of visits/locations
5958 7144
10257
14025
9073
1275 1183 1001 1030 1550
663 754 897 1000 620 226 186 185 225 352
0 2000 4000 6000 8000 10000 12000 14000 16000
2015-16 2016-17 2017-18 2018-19 2019-20 2015-16 2016-17 2017-18 2018-19 2019-20
Skills Canada Nova Scotia Techsploration
Number of Participants By Funded Partner Activity
2015-2020
Youth Participants Non-participant Attendees
73 73 74 73
89
20 19 25 24
0
0 3 7 8 15
0 50 100
2015 2016 2017 2018 2019
Number of Participants By Funded Partner Activity
2015-2020
8
Joint Registration Agreements
Table 7 shows the current Joint Registration Agreements (JRA) with unions and industry organizations, the trades that are represented under these agreements, and the number of apprentices represented under each JRA. After four years of decline, the number of apprentices in these JRAs has increased slightly since 2018-2019 and was led by the Heat and Frost Insulators, Local 116. Due to the reductions in the number of Steamfitter/Pipefitter apprentices, the UA, Local 56 has 27.7% fewer apprentices over the last five years.
Table 7: Number of apprentices in Joint Registration Agreements (JRAS) by JRA holder and trade
JRA Holder Trade 2016 2017 2018 2019 2020
International Association of Heat and Frost Insulators and Asbestos Workers, Local 116
Insulator (Heat & Frost) 44 58 55 54 88
International Brotherhood of Boilermakers,
Local 73
Boilermaker 37 35 30 30 29
International Brotherhood of Electrical Workers, Local Union 625
Construction Electrician 178 165 176 171 177
International Brotherhood of Electrical Workers, Local Union 1852
Construction Electrician, Industrial Electrician, Instrumentation and Control Technician
114 115 148 120 117
International Brotherhood of Electrical Workers, Local Union 1928
Industrial Electrician, Industrial Mechanic (Millwright)
8 14 16 16 13
International Union of Bricklayers and Allied Crafts Workers Local 1
Bricklayer 33 19 17 18 15
International Union of Operating Engineers Local 721
Mobile Crane Operators 121 132 134 135 138
Joint Apprenticeship Training Committee of Ironworkers, Local 752
Ironworker
(Generalist, Reinforcing, Structural/ Ornamental)
96 93 52 47 45
Mainland Nova Scotia J.T.C., Local 83
Carpenter 86 80 60 74 77
Millwright and Machine Erectors, Local Union 1178
Millwright 22 28 31 33 25
Nova Scotia Boatbuilders Association
Boat Builder 18 17 20 24 27
Recreation Facility Association of Nova Scotia
Refrigeration Plant N/A 10 17 23 36
Sheet Metal Workers’
International Association Joint Apprenticeship
Training Committee, Local 56
Sheet Metal Worker, Roofer 10 18 21 27 23
United Association of Journeymen and
Apprentices of the Plumbing and Pipefitting Industry of United States and Canada, Locals 244,682,56
Gas Fitter, Instrumentation Control Technician, Metal Fabricators, Oil Heat System Technicians, Plumber,
Refrigeration and A/C Mechanic, Sprinkler System Installer, Steamfitter/Pipefitter, Welder
588 525 493 466 425
United Brotherhood of Carpenters and Joiners of America Joint Apprenticeship Training Committee, Local Union 1588
Carpenter 80 70 80 52 58
TOTAL 1421 1369 1332 1274 1293
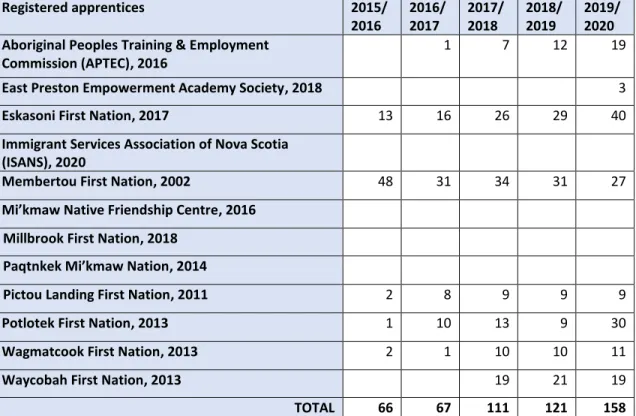
9 The number of apprentices associated with JRAs signed with First Nations and equity organizations has
increased over the last year (24.7%) led by the Unama’ki First Nations in Cape Breton. Over the last year,
staff members have been meeting with the First Nations communities in Cape Breton to renew their Agreements.
Table 8: Number of apprentices in Joint Registration Agreements with First Nations and Equity Organizations
Registered apprentices 2015/ 2016
2016/ 2017
2017/ 2018
2018/ 2019
2019/ 2020 Aboriginal Peoples Training & Employment
Commission (APTEC), 2016
1 7 12 19
East Preston Empowerment Academy Society, 2018 3
Eskasoni First Nation, 2017 13 16 26 29 40
Immigrant Services Association of Nova Scotia (ISANS), 2020
Membertou First Nation, 2002 48 31 34 31 27 Mi’kmaw Native Friendship Centre, 2016
Millbrook First Nation, 2018
Paqtnkek Mi’kmaw Nation, 2014
Pictou Landing First Nation, 2011 2 8 9 9 9
Potlotek First Nation, 2013 1 10 13 9 30
Wagmatcook First Nation, 2013 2 1 10 10 11
Waycobah First Nation, 2013 19 21 19
TOTAL 66 67 111 121 158
Demographics
Figure 6 shows the age distribution of registered apprentices in Nova Scotia in 2019-2020.
Apprentices aged 22-30 represent the largest group of age cohorts of all apprentices. Apprentices aged 24 have the single largest number at 437.
Figure 6: Age Distribution of Active Apprentices in 2019 - 2020
0 50 100 150 200 250 300 350 400 450 500
17 19 21 23 25 27 29 31 33 35 37 39 41 43 45 47 49 51 53 55 57 59 61 63 65 67 69 71 73
Number of Registered apprentices by Age in 2019-2020 Mean = 32.22, Median = 29.5
10
Women and Underrepresented Groups
Figures 7 and 8 show a steady increase in the number of female apprentices in the apprenticeship system. The percentage of women registered as apprentices has increased to 7.4%. Since the number of female apprentices in the traditional trades has very small increases, the total increase can be attributed to participation in the non-traditional trades. The Agency recognizes that there is more work to do and with funding support from the Federal Government created a Women in Trades unit to facilitate the successful participation of women in the trades.
Figure 7: Female apprentices in Nova Scotia – 10 Years
Figure 8: Percentage breakdown of female apprentices registered in traditional and non-traditional trades
Table 9 and Figure 9 reflect representation of underrepresented groups throughout the Nova Scotia apprenticeship system. The Agency has increased the participation of underrepresented groups in all categories. 15.3% of apprentices identify as diverse.
Table 9: Total number of underrepresented groups and percentage of total apprentices YEAR Aboriginal
Peoples
% of Total
African Nova Scotians
% of Total
New-comer s
% of Total
Other Diverse Persons
% of Total
Persons with Disabilities
% of Total 2015/
2016
208 3.3% 8 0.12% 42 0.7% 237 3.8% 126 2.0%
2016/ 2017
223 3.6% 28 0.45% 55 0.9% 242 3.9% 122 1.9%
2017/ 2018
314 4.7% 71 1.1% 79 1.2% 264 3.9% 180 2.7%
2018/ 2019
342 4.9% 105 1.5% 112 1.6% 305 4.4% 234 3.4%
2019/ 2020
404 5.5% 138 1.9% 138 1.9% 351 4.8% 369 5.0%
*All diversity information is based on self-identification and some individuals select more than one category.
244 273
313 342 322 357 350
408
463
539
0 100 200 300 400 500 600
2010/2011 2011/2012 2012/2013 2013/2014 2014/2015 2015/2016 2016/2017 2017/2018 2018/2019 2019/2020
Female Apprentices in Nova Scotia - 10 Years
235 251 300 336 403
113 99 114 125 134
0% 20% 40% 60% 80% 100%
2015/2016 2016/2017 2017/2018 2018/2019 2019/2020
Female Apprentices in Non-Traditional Trades
11 Figure 9: Underrepresented populations in apprenticeship – 5 years
Figure 10: Underrepresented populations as a percentage of total apprentices – 5 years
Employers
After a small dip in 2018-2019 in the number of new employers, NSAA gained 224 new employers in the system in 2019-2020. There was a significant effort made to re-engage employers who had been inactive for over five years that accounts for the number of new employers. The total number of employers in the system dropped slightly due to a reduction in the number of employers in the JRA sector.
Figure 11: New employers participating in the apprenticeship system
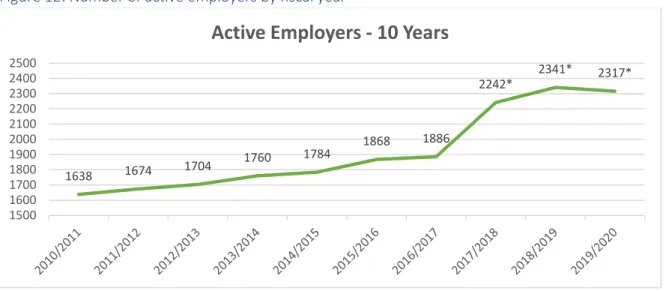
The trend for the number of employers participating in the apprenticeship system is shown in Figure 12. 0
100 200 300 400 500
2015/16 2016/17 2017/18 2018/19 2019/20
Underrepresented Groups in Apprenticeship System
-5 Years
Aboriginal Immigrant Status Persons with Disabilities
Other Diverse Persons African Nova Scotian
4.66%
6.87%
10.30%
13.60%
15.30%
0.00% 2.00% 4.00% 6.00% 8.00% 10.00% 12.00% 14.00% 16.00% 18.00%
2015/16 2016/17 2017/18 2018/19 2019/20
Representation of Underrepresented Groups - 5 Years
188
260
211
196
224
0 50 100 150 200 250 300
2015-2016 2016-2017 2017-2018 2018-2019 2019-2020
12 Figure 12: Number of active employers by fiscal year
*2017-2020 counts include JRA employers. The total without JRA employers in 2018/19 is 2096 and in 2019/20 is 2149.
Table 10: Number of employers with number-range of apprentices
Employers Apprentices
1971 employers 1-5 apprentices 170 employers 5-10 apprentices 37 employers 10-15 apprentices 12 employers 15-20 apprentices 23 employers 20-100 apprentices 5 employers 100-500 apprentices
Technical Training
The number of apprentices who completed technical training dropped in the 2019-2020 training year. This was due to disruptions in training during the last quarter (January – March) caused by the COVID-19 pandemic which resulted in the closure of our largest training provider, the Nova Scotia Community College. Technical training in some trades resumed in April via remote delivery in response to physical distancing directives issued by public health officials. Several classes with significant practical
components, however; were cancelled because remote delivery was not an option. Online training remained stable in 2019-2020.
Figure 13: Trends for apprentices scheduled for technical training
*numbers include those who have completed online training 1638 1674 1704
1760 1784
1868 1886
2242*
2341* 2317*
1500 1600 1700 1800 1900 2000 2100 2200 2300 2400 2500
Active Employers - 10 Years
1926 2169
2418 2581
2226
0 500 1000 1500 2000 2500 3000
2015/2016 2016/2017 2017/2018 2018/2019 2019/2020
13 Table 11: Classroom training offered by trade and academic year, September 2019-August 2020
NOTE: Motor Vehicle Body Repairer renamed Auto Body and Collision Technician and Sprinkler System Installer renamed Sprinkler Fitter
*Includes multiple NSCC locations and concurrent classroom sessions ** Training provided by Unions
TRADE NAME Number
Clients Scheduled
Number Clients Attended
Classroom training total weeks
Refresher Training Total Weeks
Auto Body and Collision Technician 71 66 36
Automotive Service Technician (includes ASEP)
292 278 152
Boilermaker 42 42 24
Bricklayer 15 13 15
Carpenter 170 141 115
Cook 48 44 30
Electrician - Construction and Industrial 507 471 306 4
Electrician- Industrial 23 21 12
Gasfitter A/B 15 15 6
Glazier 11
Heavy Duty Equipment Tech Level 3 & 4 31 31 11
Heavy Duty/Truck and Transport level 1 & 2
92 70 45
Industrial Mechanic Millwright 89 85 49
Instrumentation and Control Technician 6 5 7
Insulator (Heat & Frost)** 18 18 12
Ironworker Reinforcing 19 18 15
Ironworker Structural/Ornamental 17 17 14
Machinist 12 12 12
Metal Fabricator (Fitter) 41 37 24
Oil Heat System Technician 32 32 18
Plumber 198 189 89
Power Engineer 54 54 15
Powerline Technician 76 72 32
Refrigeration and Air Conditioning Mechanic
116 112 54
Refrigeration Plant Operator Review 7 7 1
Roofer 25 18 18
Sheet Metal Worker 78 78 42
Sprinkler Fitter** 22 21 16
Steamfitter/Pipefitter 72 64 49
Truck and Transport Mechanic Level 3 & 4
113 109 45
Welder 36 29 21
14 Table 12: Virtual Campus, online technical training – 5 years
Full academic year not included in 2019-20 - dates. Dates shown below are September 4, 2019 to May 12, 2020*
*Cook is now blended delivery and is no longer considered online training. **includes Refrigeration Plant Operator 2nd Class
The Agency participates in the Atlantic Apprenticeship Harmonization Project (AAHP). Under AAHP, we are aligning apprenticeship standards in the Atlantic Provinces, including introducing harmonized apprenticeship level exams in a phased-in approach, level-by-level, year-by-year.
We implemented our inaugural Phase 1 harmonized exams in the 2015/16 training year. We continue to implement for all of the Phase 2 trades and have started development of Phase 3 trades. Some of these trades, such as Boilermaker, Sprinkler Fitter and Steamfitter/Pipefitter, already had level exams
embedded into their apprenticeship programs (pre-harmonization). Others, like Construction Electrician, Cook, and Metal Fabricator, had not; level exams for these trades are a new experience and represent a
‘culture shift’, which is reflected in the average exam results being lower.
For trades with multi-year data, if the average pass rate for a level 1 exam is below 70%, the pass rate has increased for the subsequent levels, except for Cook and Metal Fabricator. For Cook, the low level 3 exam results could be due to clients who have come into apprenticeship after having completed a pre-apprenticeship program for which they have been granted credit for levels 1 and 2. Over the coming years, we anticipate an improvement in pass rates for these trades.
Table 13: Level Exam Performance 2015/16 to 2019/20*
Trade Name Level 2015/
2016
Pass Rate
2016/ 2017
Pass Rate
2017/ 2018
Pass Rate
2018/ 2019
Pass Rate
2019/ 2020
Pass Rate Automotive
Service Technician
Level 1
- - - 46 35%
Boilermaker Level
1
10 100% 7 100% 11 91% 5 80% n/a 50% Level
2
10 100% 10 100% 8 100% 10 90% 5 100%
Bricklayer Level
1
- - - - 5 100% 4 50% 9 67% Level
2
- - - - 7 0% 13 77% 15 60% Level
3
- - - 8 100% 5 100%
Carpenter Level
1
4 75% 20 45% 35 69% 45 47% 64 34% Level
2
- - - 28 89% 23 91% Level
3
- - - 34 79% 54 67% Level
4
- - - 18 89%
Online Training Programs 2015-16 2016-17 2017-18 2018-19 2019-20*
Automotive Service Technician 106 89 74 63 78
Carpenter 57 45 34 60 52
Construction Electrician 106 100 94 129 138
Cook 70 38 44 *0 *0
Gasfitter 61 64 61 53 64
Industrial Electrician 12 13 18 10 18
Machinist 4 5 6 6 6
Oil Heat Systems Technician 11 15 16 13 8
Power Engineer 20 27 10 **17 **28
Plumber 29 38 45 38 31
Steamfitter/Pipefitter 1 1 1
15
Trade Name Level 2015/
2016 Pass Rate 2016/ 2017 Pass Rate 2017/ 2018 Pass Rate 2018/ 2019 Pass Rate 2019/ 2020 Pass Rate Construction Electrician Level 1
n/a* 0% 41 32% 37 43% 44 55% 39 51% Level
2
- - n/a 0% - - 135 59% 140 54% Level
3
- - - 26 73%
Cook Level
1
8 75% 15 60% 9 78% 23 70% 16 44% Level
2
- - 4 75% 16 69% 13 69% 24 71% Level
3
n/a 50% 3 33% 4 75% 24 67% 43 49%
Industrial Electrician
Level 1
n/a 100% - - n/a 100% 4 75% n/a 100% Level
2
- - - 8 75% 9 89% Level
3
- - - n/a 100%
Industrial Mechanic (Millwright)
Level 1
- - - 4 75%
Instrumentation and Control Technician
Level 1
3 67% 3 33% - - n/a 100% - -Level
2
- - n/a 100% n/a 100% - - n/a 50% Level
3
- - 22 100% 4 100% 5 100% - -Level
4
8 75% 10 70% 14 64% 5 100% 4 75%
Insulator (Heat & Frost)
Level 1
- - 9 100% 7 100% 14 86% 20 95% Level
2
8 75% - - 14 100% - - 9 100% Level
3
20 75% - - n/a 0% 18 100% -
-Metal Fabricator (Fitter)
Level 1
n/a 100% 21 95% 6 17% n/a 50% 3 67% Level
2
- - - - 14 57% 6 33% 7 14% Level
3
- - - 29 38% 37 41%
Plumber Level
1
n/a 50% n/a 100% 53 96% 86 97% 92 93% Level
2
- - n/a 100% - - 31 65% 91 68% Level
3
- - - 5 60% 30 87%
Roofer Level
1
- - - -Level
2
8 88% n/a 100% 5 80% - - 7 86% Level
3
n/a 100% 8 88% n/a 0% - - 6 83%
Sheet Metal Worker
Level 1
5 80% 15 73% 6 67% 27 96% 31 84% Level
2
- - - - 17 82% 19 68% 15 100% Level
3
- - - - 14 57% 18 61% 21 67% Level
4
16 88% 11 82% 11 91% 27 81% 23 61% Level
3 *
-16
Trade Name Level 2015/
2016
Pass Rate
2016/ 2017
Pass Rate
2017/ 2018
Pass Rate
2018/ 2019
Pass Rate
2019/ 2020
Pass Rate
Sprinkler Fitter Level
1
5 100% 10 100% 9 78% 8 100% 14 86% Level
2
- - - 10 90% 9 89%
Steamfitter/ Pipefitter
Level 1
16 81% 36 89% 12 67% 3 67% n/a 100% Level
2
50 98% 48 88% 50 78% 33 55% 29 66% Level
3
45 80% 63 86% 41 85% 35 100% 15 100% Level
4
- - 16 100% 76 64% 83 84% 53 79%
Welder Level
1
- - 6 33% 10 40% 11 45% 9 33% Level
2
- - - 21 86% 4 75% Level
3
- - - 37 73% 34 74%
*Previously called Block 3 Sheet Metal Worker *n/a (not available) indicates all results less than 3 have been suppressed for privacy reasons
*Some trades in the table have mandatory level exams but are not harmonized. Please refer to this document for a list of the Phase 1, 2 and 3 harmonized trades: https://nsapprenticeship.ca/sites/default/files/docs/pubs/NSAA-FactSheet-AAHP.pdf
Apprenticeship START Program
Through the Apprenticeship START Incentive, $2,992,500 was distributed in 2019-2020 to employers who hired, progressed and completed their apprentices. As of March 31, 2020, there are 1187 active apprentices and 1080 employers participating in the Apprenticeship START Program as indicated in Table 14. Twenty-nine per cent (29%) of apprentices are diverse and eleven per cent (11%) are women.
Table 14: Employers and Apprentices in START Program 2019-2020
Employers and Apprentices in START Program 2019-2020
Active Employers 1080
Active Employers Hiring Diverse Apprentices 329
Active Apprentices 1187
Active Apprentices - Diverse 344
Active Female Apprentices 105
Since the investment of an additional $2,000,000 in the program in 2017, 140 apprentices have completed their program and 15% were diverse. The percent of diverse apprentices completing their programs is significantly higher if the employer receives the START incentive.
Table 15: Apprentice completion of START Program
Level of Apprenticeship Number of Apprentices Percentage of Diverse Apprentices
Level 1 667 33%
Level 2 174 28%
Level 3 144 28%
Level 4/IP Exam 54 31%
Completions 140 15%
Apprentice Progression and Completion Awards
Apprentice Progression and Completion Awards are disbursed during each fiscal year in September and April upon successful completion of an eligible level of apprenticeship or of all apprenticeship requirements. These monetary awards are made possible through the Apprentice Award Trust and help to defray the costs of participating in apprenticeship training. In 2019-2020, awards totaling $300,500 were issued to 384 apprentices. Government announced in the budget for 2020-2021 that the Trust would be continued for another three years.
17 Table 16: Apprentice progression/completion awards by trade
Trade Name 2014/
2015
2015/ 2016
2016/ 2017
2017/ 2018
2018/ 2019
2019/ 2020 Auto Body and Collision
Technician
5 4 13 2
Automotive Service Technician 55 46 63 82 68 61
Boat Builder 2 3 2 1
Bricklayer 1 1 1
Boilermaker 2
Carpenter 64 38 33 42 46 33
Construction Electrician 102 128 145 111 101 94
Cook 1 1
Gasfitter 9 15 16 22
Glazier 1 1
Heavy Duty Equipment Technician
3 7 8 6 1 8
Industrial Electrician 45 28 44 38 24 12
Industrial Mechanic (Millwright)
11 17 12 19 14 11
Instrumentation and Control Technician
1 6 6 8 1
Machinist 6 7 7 7 11 4
Metal Fabricator (Fitter) 5 11 12 13 4 1
Oil Heat Systems Technician 1
Plumber 51 44 28 22 40 42
Power Engineer 9 11 17 13 13 10
Powerline Technician 1 4 15 3 15
Refrigeration and Air Conditioning Mechanic
12 15 24 24 26 17
Sheet Metal Worker 7 7 11 9 5 7
Sprinkler Fitter 1
Steamfitter/Pipefitter 64 50 34 28 9 18
Truck and Transport Mechanic 42 42 24 26 27 45
Welder 2
TOTAL 487 480 495 494 408 384
*In 2019, two trades had formal name changes; Motor Vehicle Body Repairer was changed to Auto Body and Collision Technician and Sprinkler System Installer was changed to Sprinkler Fitter.
Figure 14 shows those who have completed apprenticeship training and attained a Certificate of
Qualification over the past ten years. There was a reduction in the number of Certificates of Qualification issued in 2019-2020 which may be attributed to the introduction of level exams in the larger trades. Some individuals would have been unsuccessful in their level exams, which would delay the certification exam. It is expected that these numbers will rebound over the next couple of years.
Figure 14: Nova Scotia apprenticeship completions 2010-2020
520
651 620 631
741
592 648
678
762
636
400 500 600 700 800 900 1000
18 Figure 15: Examination pass rates for Red Seal trades 2015-2020
The number of Certificates of Qualification issued to Automotive Service Technicians has dropped since 2018-2019 after several years of significant increases. Efforts to complete carpenter apprentices have increased the number of Certificates of Qualification issued in that trade. Table 17 shows Certificates of Qualification issued in Nova Scotia.
Table 17: All Certificates of Qualification issued by trade and year in Nova Scotia – Apprentices and Trade Qualifiers
Construction Sector 2015-2016 2016-2017 2017-2018 2018-2019 2019-2020
Blaster 5 5 3 5 6
Boilermaker 7 10 11 8 7
Bricklayer 6 3 6 10 5
Carpenter 33 47 40 33 52
Concrete Finisher 1
Construction Electrician 145 134 151 170 165
Elevating Device Mechanic 2
Gasfitter A** 1 5 4
Gasfitter B** 15 17 15
Glazier 1 13
Insulator (Heat and Frost) 7 3 5 22
Ironworker (Generalist) 3
Ironworker (Reinforcing) 10 18 1 12 4
Ironworker (Structural/Ornamental) 15 10 19 1 7
Mobile Crane Operator 11 10 5 9 2
Oil Heat System Technician 7 14 10 7 6
Painter and Decorator 2
Plumber 41 48 46 36 37
Powerline Technician 4 5 16 15 31
Refrigeration and A/C Mechanic 19 27 24 31 34
Restoration Stone Mason 1
Roofer 1 10 7 5
Sheet Metal Worker 38 21 18 15 19
Sprinkler Fitter* 4 4 8 7 5
Steamfitter/Pipefitter 51 50 57 60 40
Tower Crane Operator 2 1 1
Welder 39 38 44 46 28
TOTAL 447 459 487 510 490
Industrial/Manufacturing Sector 2015-2016 2016-2017 2017-2018 2018-2019 2019-2020
Boat Builder 3 1 2 2 1
Cabinetmaker 1
Industrial Electrician 28 33 30 17 13
Industrial Mechanic (Millwright) 46 34 16 35 29
Instrumentation and Control Technician
8 2 11 7 7
Machinist 7 11 4 10 7
Metal Fabricator (Fitter) 13 1 12 16 19
Welder 39 38 44 46 28
TOTAL 144 120 119 134 104
67%
76% 76% 75%
74%
65%
58%
64%
61%
58%
40% 45% 50% 55% 60% 65% 70% 75% 80%
2015/2016 2016/2017 2017/2018 2018/2019 2019/2020
Examination Pass Rates
19
Motive Power Sector 2015-2016 2016-2017 2017-2018 2018-2019 2019-2020
Agricultural Equipment Technician 5 1
Auto Body and Collision Technician* 10 16 13 14 10
Automotive Service Technician 66 63 160 181 128
Elevating Device Mechanic 2
Heavy Duty Equipment Technician 10 19 5 14 10
Marine Service Technician 1 11 4
Motorcycle Mechanic 6 3 5 8 6
Parts Technician* 1
Recreation Vehicle Service Technician
2
Transport Trailer Technician 2 1
Truck and Transport Mechanic 46 64 44 69 60
TOTAL 140 166 246 286 222
Service Sector 2015-2016 2016-2017 2017-2018 2018-2019 2019-2020 Alarm and Security
Technician
1
Appliance Service Technician 1
Baker 2 1 3 7 3
Cook 28 17 24 21 23
Hairstylist 2 2 20 2 2
Landscape Horticulturalist 2 3 2
TOTAL 32 22 47 33 32
* Effective March 2019, the Motor Vehicle Body Repairer (Metal and Paint) trade name was changed to Auto Body and Collision Technician and the Sprinkler System Installer trade name was changed to Sprinkler Fitter. Effective 2020, the Partsperson trade name was changed to Parts Technician.
**April 2017 the Gasfitter trade was divided into Gasfitter A and Gasfitter B.
Overall, the number of Certificates of Qualification issued this year has decreased therefore the number of women and diverse apprentices receiving a Certificate of Qualification has also decreased.
Table 18: Certificates of Qualification issued to Apprentices who self-identify as female or diverse*
C of Qs Apprentices
TOTAL ALL Women Aboriginal African NS
Persons with Disabilities
Newcomers Other Diverse Persons
Pass Rate
IP Prov IP Prov IP Prov IP Prov IP Prov IP Prov IP Prov IP Prov
2019/20 601 38 28 2 12 0 4 0 21 0 7 1 11 1 62% 58%
2018/19 642 58 36 1 24 1 1 2 16 3 2 1 16 3 63% 77%
2017/18 625 49 21 2 8 0 1 0 13 2 4 0 20 0 68% 73%
2016/17 579 54 31 2 15 1 1 0 10 0 5 1 17 2 67% 69%
2015/16 532 50 21 1 7 1 0 0 21 1 4 0 7 1 67% 76%
*’Diverse’ refers to individuals who identify as a member of a community underrepresented in the Apprenticeship and Trades
Qualification System
Table 19: Certificates of Qualification issued to Trade Qualifiers who identify as female or diverse*
C of Qs Trade Qualifiers
TOTAL ALL Women Aboriginal African NS
Persons with Disabilities
Newcomers Other Diverse Persons
Pass Rate
IP Prov IP Prov IP Prov IP Prov IP Prov IP Prov IP Prov IP Prov
2019/20 93 13 6 1 1 0 2 0 1 0 3 0 0 0 49% 46%
2018/19 101 8 7 0 0 1 0 0 5 0 0 0 0 0 51% 62%
2017/18 112 22 11 0 1 0 2 0 1 0 8 0 4 0 52% 44%
2016/17 113 16 7 0 2 0 0 0 2 0 2 0 3 2 50% 33%
2015/16 126 16 3 0 1 0 0 0 2 1 0 0 1 0 55% 55%
*’Diverse’ refers to individuals who identify as a member of a community underrepresented in the Apprenticeship and Trades