Hungarian Association of Agricultural Informatics European Federation for Information Technology in Agriculture, Food and the Environment
Journal of Agricultural Informatics. 2015 Vol. 6, No. 2 journal.magisz.org
Development of an open source agricultural mobile data collector system
Róbert Szilágyi1, Mihály Tóth2
I N F O
Received 10 May 2015 Accepted 22 Jun 2015 Available on-line 29 Jun 2015 Responsible Editor: M. Herdon
Keywords:
Data collection, system development, mainboard, sensor,
A B S T R A C T
The information is important in every decision area. The Big Data philosophy lead to collect every possible data. Nowadays these applications are more and more successful in the following agricultural areas: different parts of food industry, extension services, precision agriculture. While studying the use of these new ICT technologies can be concluded that different types of services offer different possibilities. Firstly we compared the possible mainboards and sensors. General information about the existing mobile main boards. We compared the Atmel AVR, the Raspberry PI and the LEGO Mindstorms NXT. We choosed the Arduino system board. We described the main system architecture and connection possibilites. We found the temperature sensor widely useable. The software was also briefly mentioned. We can say there are several advantages of the Arduino. The whole system can be upgradeable, and there are several Arduino based mainboards and sensors too. Nowadays the block programming support are increasing (etc. MIT Appinventor), but there are disadvantages too. The system has several limitation: the number of the connected sensor, the connection type, the system energy supply, the data loss, the creation of user friendly interface and the system failure tolerability.
1. Introduction
The development of information technology has had a considerable influence on the agriculture. There have emerged a number of new industry-specific technologies and new applications over the past few years, including the ever widening agricultural application of mobile communications devices and technologies. Further considerable improvement is expected in the use of the mobile data collector devices.
The focus of our research was to develop mobile data collector device and the assessment of their effects on agriculture. Due to the fact that the development of applications and user applications require wide-ranging condition and effect the investigation of several conditions and effect mechanisms and research tasks were carried out.
Providing information: Management in agriculture is a large extent of the ability to make decisions under uncertainty, the latter being accumulated from three main sources (Thysen 2000)
uncertainty due to lack of data about the current state of nature;
uncertainty due to incomplete knowledge about the biological and physical systems and
uncertainty due to inherently random processes.
The farmers' use of IT must be looked upon from the point of view of farm economics. The majority of farmers will only use IT if they consider this to be economically beneficial. There are, however, reasons to believe that the economical value of IT in farming is increasing, which eventually will lead to a higher uptake of the technology (Herdon & Lengyel, 2013). The main reason to expect a higher value of IT is the public concern about agriculture's negative impacts on the environment and the widespread fears concerning food safety. These consumer concerns are causing governments and primarily the food industry to enforce restrictions on the use of assumed harmful chemicals and,
1 Róbert Szilágyi
University of Debrecen
[email protected] 2 Mihály Tóth
secondly, to demand a precise documentation of the primary production process (Herdon & Füzesi, 2011). ICT evolution is well advancing Moore’s Law prediction of computer performance indexes. Indeed, these technologies are not only fast developed but, are giving birth to newer ones. These innovations of ICT are not only regenerating the agriculture (Sideridis et al., 2010).
The developments in wireless sensor technologies and classified the applications in agriculture and food production under several categories (Wang et al., 2006).They identified environmental monitoring (weather monitoring, geo referenced environmental monitoring) and precision agriculture (spatial data collection, precision irrigation) as the most spatially dependent. Environmental data are very important in agriculture, since crop yields depend on environmental conditions, and the response of plant growth to changing environmental conditions is extremely complicated (Lee et al., 2010).
We think that the importance of the big data is increasing in the field of agriculture. The idea of big data is not new but the current data analysis, data mining, data visualization simplify the farmers decision. Few possible fields of the sensor based big data are the following: yields, soils, weather analysis, crop models, market information, and complexity of them. The cloud based computing and mixture of the mobile sensor network are also a good combination.
2. Recent trends in mobile data collecting
2.1. Technology
Sensors are used for collecting information about physical and environmental attributes. There are several wireless sensors network application in agriculture (Aqell-ur-Rehman, et al., 2014). Agriculture information requirements could be the following:
1. Collection of weather, crop and soil information 2. Monitoring of distributed land
3. Multiple crops on single piece of land
4. Different fertilizer and water requirement to different pieces of uneven land 5. Diverse requirements of crops for different weather and soil conditions 6. Proactive solutions rather than reactive solutions.
Wireless communication technologies like ZigBee, Bluetooth, Wibree and WiFi are frequently used in Wireless Sensor Network (WSN). These technologies have different capabilities and properties on which they are complemented.
Wireless sensor node is a basic unit of wireless sensor network. It comprises of four basic modules including Sensor/Actuator module, Communication module, Processing/computation module and Power module. External memory is an optional module that could be needed in case of data storage requirement for local decision making (Aqeel-ur-Rehman, et al, 2014).
2.2. Typical agricultural data collector applications
A heterogeneous distributed network of hierarchical agricultural sensors.
Communication infrastructure and standardized interfaces between sensors and the Internet.
Web-enabled geoinformation infrastructure for effective visualization of sensor data.
Cartographic visualization rules and modeling tools for effective support of agricultural decision-making.
An agricultural knowledge base and data warehouse for sensor data storing.
The wireless sensors also useable for irrigation water management (Stefanos et al, 2015; Navarro-Hellín et al., 2015). The GSM/GPRS protocol seem to be more flexible for data collection. The suggested subsystem are the following:
1. An electronic board, the Main-Board, this board is responsible for sensors’ data and for the communication with the rest of the boards.
2. The Sensor-Board provides the interface with the connected sensors.
3. The GPRS-Board is in charge of establishing the communication with the mobile network by means of a GSM/GPRS protocol.
2.3. Agricultural application development
Studies of the situation of mobile communication and the new ICT technologies revealed that the international trends show the possibilities of these usage. The mobile devices indicate that both the interest and the potential volume of users are available in agriculture and every chance is there to exploit the opportunity of growth. As regards the devices themselves, they can be said to have increasingly more functions; a development which is ensured by the high level of integration. The earlier shown applications and innovative spread of the wired and the mobile Internet are primarily limited by economic and social factors.
3. The system development
3.1. Methodology
Firstly we did some research about the existing mobile data collector systems. The main idea was to develop an open source system architecture with cheap system parts. We collected information about the typical sensors. Secondly we created our system structure, then begun the programming. Thirdly after the first useable prototype we made practical data collecting experiment to check the system stability.
3.2. Technology
General information about the existing mobile main boards are the following.
Atmel AVR
The Atmel AVR is basically an 8 bit RISC microcontroller family (recently, the 32-bit version is also available), based on modified Harvard architecture. Some of these devices are on the market since 1996. Within the family we distinguish between 32 bit AVR UC3, 8 bit AVR XMEGA, mega AVR, tiny AVR types. These microcontrollers applied flash memory for the first time instead of the usual ROM, EPROM and EEPROM. In 2005, Arduino began selling its own development boards based on this microcontroller. Over the years more and more libraries have appeared, which made it possible to connect sensors and accessories to the system. This quickly made the developer motherboard popular for regular users as well.
Raspberry PI
hardware. The Raspberry PI is efficiently when used for computing-intensive operations, or graphical applications rather than control tasks.
LEGO Mindstorms NXT
This is a programmable robotics kit released by LEGO in late July 2006. It replaced the first-generation LEGO Mindstorms kit, which was called the Robotics Invention System. It comes with the NXT-G programming software, or optionally LabVIEW for LEGO MINDSTORMS. A variety of unofficial languages exist, such as NXC, NBC, leJOS NXJ, and RobotC. A new version of the set, the new Lego Mindstorms NXT 2.0, was released on August 1, 2009, featuring a color sensor and other upgraded capabilities. There is now a new Lego Mindstorms Robot, called the EV3. The main component in the kit is a brick-shaped computer called the NXT Intelligent Brick AKA(Ciara). It can take input from up to four sensors and control up to three motors. The brick has a 100×60 pixel monochrome LCD display and four buttons that can be used to navigate a user interface using hierarchical menus. It has a 32-bit Atmel microcontroller with 256KB of FLASH memory and 64KB of RAM, plus an 8-bit Atmel AVR ATmega48 microcontroller, and bluetooth support.
3.3. System architecture
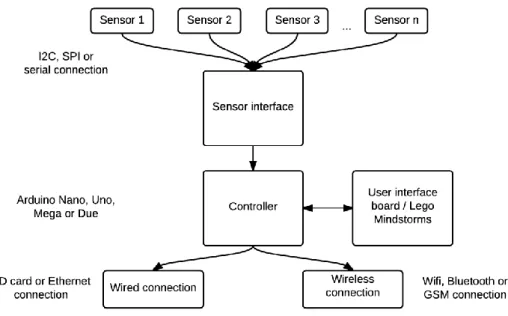
The system structure can be separated into three main parts. The sensor interface is responsible for the connection of the sensors. The controller is responsible for the communication of the user interface and the data connection. The user interface allows the user to use the system. The main parts of the system can be seen in Figure 1.
Figure 1. The main structure of the data collector system
Device control
The key component of a data collector device is the control unit, because it determines decisively the devices performance, expandability, and it sets the limits at the programs complexity. We will mention several systems later which can be used as opportunity, including the modular designed Lego Mindstorms system, which contains enough components for basic experiments, and the Arduino developer board, which gives us more customization possibility, but the use requires electronic design.
Control board
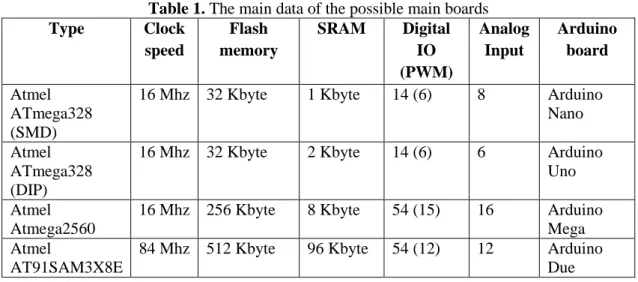
The basic unit is an Atmel ATmega 328p microcontroller, which offers 32 Kbytes program memory, 13 digital and 5 analog inputs and outputs (with the support of I2C and SPI buses). It's considered as the simplest microcontroller what we used during the experiments. This microcontroller is used by the Arduino Uno developer board. The performance is good enough to perform more complex tasks, but the size of the memory is not sufficient to run the entire application what we made. The memory size cannot be changed because of the Harvard architecture, but a lot of microcontrollers also exists in the family, which may be suitable for this purpose.
Next opportunity is the Atmel ATmega 2560, which has much more memory compared to the previous one. With 256 Kbytes of program memory it is usable to make the whole system, and has approximately the same performance as the Uno. The power supply used by the devices is also seated on the motherboard. The module is quite simple, in case of using the ATmega 2560 or 328p because they have operating voltage of 5V. The maximum current provided by the device is 1.5A, which sufficient for the tasks, but aiming to reduce heat generation and provide enough power to the supplements may be used in the future is worth thinking about to equip the sensor board with an own power supply. The main data of the possible main boards can be seen in Table 1.
Table 1. The main data of the possible main boards
Type Clock
speed
Flash memory
SRAM Digital
IO (PWM)
Analog Input
Arduino board
Atmel ATmega328 (SMD)
16 Mhz 32 Kbyte 1 Kbyte 14 (6) 8 Arduino
Nano
Atmel ATmega328 (DIP)
16 Mhz 32 Kbyte 2 Kbyte 14 (6) 6 Arduino
Uno
Atmel Atmega2560
16 Mhz 256 Kbyte 8 Kbyte 54 (15) 16 Arduino
Mega Atmel
AT91SAM3X8E
84 Mhz 512 Kbyte 96 Kbyte 54 (12) 12 Arduino
Due
User interface
We can use more method to achieve the user interactivity. We designed a panel, which fits to the Arduino board as a shield. It contains 5 buttons for the navigation, from which is one equipped with interrupt capability. To set the value of the settings during the application we can use a matrix keyboard (with analog output) or a potentiometer, depending on the configuration. The former has the advantage that we have the opportunity to transmit exact values to the controller, but using it may result in more program inaccuracy because of the analog values. We used the matrix keyboard as an analog device, because with this method it reserves only one pin. We used a PCD8544 type 84x48 pixel monochrome display during the tests, which is connected via SPI bus of the microcontroller, however, in the case of development the size of the display, and the functions can greatly increase demands and the amount of information needs to be displayed.
Sensor boards
There was more concept born to design the sensor boards. The basic requirements are modularity, corresponding expandability and to minimize the need of user interaction to be done with an operation. To achieve this, the sensors or sensor panels must be identified to the system in some way. This method covers more options. Assume that there is the sensor panel, which contains more sensors inside of a printed circuit board. The panel has specific structure and connects to the motherboard based on a pre-designed interface with a 32-wire ribbon cable. With only one panel it would be easy, because we only have to write one program to make it function, but with more panels we have to achieve the identification as mentioned above. Information about few possible sensors can be seen in Table 2.
Table 2. The main data of the typical sensors
Type Application area Accuracy Interval Interface
DHT11 Temperature and
humidity measurement
5% humidity and ±2 °C temperature
20-80% humidity and 0 to 50°C temperature
OneWire
BMP085 Barometric Pressure and temperature ±0.5 °C temperature ±0.2 hPa pressure
300 to 1100 hPa barometric pressure,
I2C
- Soil moisture
measurement
- 0 to 1023
(uncalibrated analog) or 0-1 (digital)
Analog or digital (logical)
MG-811 Carbon dioxide measurement
- 0 to 1023
(uncalibrated analog) or 0-1 (digital)
Analog or digital (logical)
TSL2561 Luminosity measurement
- 0.1 to 40000
Lux
I2C
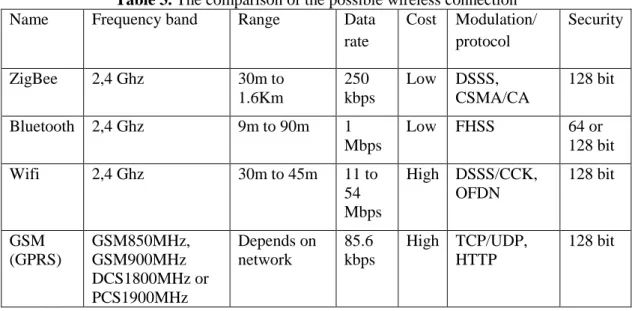
Connecting the sensors can be done with simple digital, analog method, or with using I2C, and SPI bus system. Other concept describes the sensor board as a blank printed circuit, with sensor-specific interfaces, which act as a separated system, and the sensors can be replaced by the user (Table 3).
Table 3. The comparison of the possible wireless connection
Name Frequency band Range Data
rate
Cost Modulation/ protocol
Security
ZigBee 2,4 Ghz 30m to
1.6Km
250 kbps
Low DSSS,
CSMA/CA
128 bit
Bluetooth 2,4 Ghz 9m to 90m 1
Mbps
Low FHSS 64 or
128 bit
Wifi 2,4 Ghz 30m to 45m 11 to
54 Mbps
High DSSS/CCK, OFDN 128 bit GSM (GPRS) GSM850MHz, GSM900MHz DCS1800MHz or PCS1900MHz Depends on network 85.6 kbps
High TCP/UDP, HTTP
It would increase the usability, but in addition to it would increase the production cost, because we have to redesign all the used sensors in a specific way to make it compatible with the custom interface and useable with the identification system.
3.4. The software
When the software starts, it declares the global variables, and gives values from an EEPROM, to the variables contains the settings, which determines the system functions. The EEPROM is connected to the microcontroller via I2C bus, and the values contained by it are defined by a custom memory map. After the value assignment the software initializes the connected devices, in addition a basic debugging starts, which gives to the user feedback, when a sensor is malfunctioning during the launch.
The microcontroller are responsible for the sensor data read, the data are stored in global variables, so we can reach anywhere the measured data. During the experiments we used a 16x2 character matrix display, and an 84x48 pixel resolution graphic display. Depending on the configuration, it was able to show data from 6 sensors simultaneously, but this can be expanded with multiple pages.
After the display is done, the events are happening depending on the settings. If at the memory address 5 binary 1 value has been saved, the device tries to perform data saving to the SD card. If there is an issue with the card, or cannot be detected in the system, an error message is generated to warn the user. With operating card, the device creates a directory structure, and the data collection begins to a .txt file using defined file structure. This structure facilitates the subsequent processing.
The next step is data collection using the Ethernet connection. The binary value at memory address 8 activates this function. In this case the device uploads the measured values to a pre-structured SQL database automatically. There is SQL library specifically for this purpose which can be used, but the library uses large amounts of memory. This resource usage is noticeable during the usage. Another option works with a PHP website. We use this site as a data processor, which takes the value from the system as a String and properly transfers it to the database.
We had experiment related to data analysis, but in other application area. The Ethernet connection can be replaced by WiFi or GSM based data transmission as well. These two methods is probably much more practical, since they are wireless communications, but due to lack of equipment, we have focused to the Ethernet.
3.5. Testing results
The application based on the system are tested on every module. With this method we can achieve easier debug opportunity and optimized program. The first step was to read the sensors, the conversion of the measured data, then to send them to the serial monitor. It was necessary to test the proper connection and functionality of the sensors. The connection is usually clear, but hardware conflicts should be corrected. Since this has worked successfully, the data should be visible to the user. We used a 16x2 character matrix display and a 84x48 pixel graphic display. At this stage we have not used the menu system, but assuming the future development, we created the function when we first time used the display. The sensors and the display worked properly, so it was necessary to develop the data collection methods. The first, and also the easiest solution was to collect data to an SD card. Due to the complexity of the system, the actual limitations are the following: the optimization of the battery time is still an issue, the compact and weather resistant case is not completed yet, the sensor calibration is depends on the actual usage type, the user interface is only in a beginning state.
We did not make a data analysis because of the prototype device, when we calibrate all the sensors and finalize the control board we will make the collected data evaluation.
The results show the base system is applicable and the structure can be upgradeable. The full system durability test are the next step and after it we can say the final verdict about it. We hope it will be capable to achieve more results.
3. Conclusion
software support is great. Also there are good possibilities in block programming (predefined program modules). The block programming support are increasing (etc. MIT Appinventor). Of course there are disadvantages too. The system has several limitation: the number of the connected sensor, the connection, the system energy supply, the data loss, the creation of user friendly interface and the system failure tolerability. As regards the devices themselves, they can be said to have increasingly more functions; a development which is ensured by the high level of integration. Finally we can say both the main board technology and the potential sensors are available in agriculture data collection.
References
Aqeel-ur-Rehman, Abbasi, A. Z., Islam N., Shaikh Z. A (2014) A review of wireless sensors and networks' applications in agriculture, Computer Standards & Interfaces no.36, pp. 263–270. doi: 10.1016/j.csi.2011.03.004
Herdon M, Füzesi I (2011) Information Technologies in Quality Management Systems of Meat Product Chains, In: Zacharoula Andreopoulou, Basil Manos, Nico Polman, Davide Viaggi (edited), Agricultural and
environmental informatics, governance and management: emerging research applications. pp. 207-226., ISBN:978-1-60960-621-3 (hbk.) doi: 10.4018/978-1-60960-621-3.ch012
Herdon M, Lengyel P (2013) Building and Using Knowledge Repositories for Agriculture: An Innovation Case Study, EFITA WCCA CIGR 2013 Conference: Sustainable Agriculture through ICT innovation. Torino: pp. 180-187.
Kodaira M., Shibusawa S (2013) Using a mobile real-time soil visible-near infrared sensor for high resolution soil property mapping, Geoderma no 199, pp. 64–79. doi: 10.1016/j.geoderma.2012.09.007
Kubicek P., Kozel J., Stampach R., Lukas V (2013) Prototyping the visualization of geographic and sensor data for agriculture, Computers and Electronics in Agriculture no.97 pp. 83–91. doi: 10.1016/j.compag.2013.07.007
Lee, W.S., Alchanatis, V., Yang, C., Hirafuji, M., Moshou, D., Li, C (2010) Sensing technologies for precision specialty crop production, Computers and Electronics in Agriculture no.74 (1), pp. 2–33.
doi: 10.1016/j.compag.2010.08.005
Nadimi E.S., Jřrgensen R.N., Blanes-Vidal V., Christensen S (2012) Monitoring and classifying animal behavior using ZigBee-based mobile ad hoc wireless sensor networks and artificial neural networks, Computers and Electronics in Agriculture no 82, pp. 44–54. doi: 10.1016/j.compag.2011.12.008
Navarro-Hellín H., Torres-Sánchez R., Soto-Valles F., Albaladejo-Pérez C., López-Riquelme J.A., Domingo-Miguel R (2015) A wireless sensors architecture for efficient irrigation watermanagement, Agricultural Water Management no. 151, pp. 64–74. doi: 10.1016/j.agwat.2014.10.022
Sideridis, A. B., Koukouli, M., & Antonopoulou, E (2010) ICT and farmers: lessons learned and future developments, Agricultural Informatics (2010) Vol. 1, No. 2, pp. 35-41. doi: 10.17700/jai.2010.1.2.18
Stefanos A. Nikolidakis Dionisis Kandris,Dimitrios D. Vergados Christos Douligeris (2015) Energy efficient automated control of irrigation in agriculture by using wireless sensor networks, Computers and Electronics in Agriculture no 113, pp.154–163. doi: 10.1016/j.compag.2015.02.004
Wang, N., Zhang, N., Wang, M (2006) Wireless sensor in agriculture and food industry – recent development and future perspectives, Computers and Electronics in Agriculture no. 50 (1), pp. 1–14.