Hungarian Association of Agricultural Informatics European Federation for Information Technology in Agriculture, Food and the Environment
Journal of Agricultural Informatics. Vol. 8, No. 3 journal.magisz.org
Biotype identification of Bemisia tabaci by acoustical method
Hiroki Nakabayashi1, Koichi Mizutani2, Tadashi Ebihara3, Naoto Wakatsuki4, Hiroyuki Uga5, Kenji Kubota6, Masahisa Ishii7
I N F O
Received 17 Jul 2017 Accepted 6 Nov 2017 Available on-line 21 Nov 2017 Responsible Editor: M. Herdon
Keywords:
Whitefly,
Biotype identification, Acoustics
A B S T R A C T
Bemisia tabaci has two major biotypes: B and Q. Biotype identification is necessary for whitefly control, since different biotypes have different pesticide resistance. However, slow and expensive techniques are needed for accurate biotype classification. In this paper, we propose a whitefly biotype identification scheme using an acoustic signature, and evaluate its performance. The proposed scheme achieves biotype identification by three steps: signal detection, frequency-domain matching, and classification of biotypes. We evaluated the performance of the proposed scheme by processing actual whitefly sounds obtained in a recording experiment, and calculated the accuracy of the classification.
Results showed the proposed biotype identification method achieved a correct detection rate of 92% in Bemisia tabaci. This result suggests that the proposed scheme is a viable alternative for biotype identification of whitefly.
1.
Introduction
Whitefly (e.g., Bemisia tabaci and Trialeurodes vaporariorum) is a major pest insect commonly found in greenhouse environments (Brown et al. 1995; Denholm et al. 1998). Once whitefly invade a greenhouse environment, they quickly become distributed over the entire greenhouse, and immediately attack a huge assortment of vegetables, causing millions in damage. Specifically, they transmit more than 100 kinds of virus, in particular the tomato yellow leaf curl virus—one of the most damaging pathogens of tomato, with losses up to 100% in commercial fruit production (Czosnek et al., 2001; Jones, 2003; UC IPM, 2016a). Hence, control of whitefly is an urgent issue for increased crop yield.
Physical, chemical and biological methods have widely been proposed to control whitefly (Denholm et al., 1998; UC IPM, 2016b), and a combination thereof is currently in actual use. In terms of chemical control, species and biotypes of whitefly are important information for determining optimum pesticide, since pesticide sensitivity is different according to whitefly species and biotypes (Horowitz et al., 2005; Prabhaker et al., 2005). To determine species and biotypes of whitefly, appearance check using microscope (Ma et al., 2007) and genetic testing (Ma et al., 2007) are employed, respectively.
1Hiroki Nakabayashi
Graduate School of Systems and Information Engineering, University of Tsukuba
2Koichi Mizutani
Faculty of Engineering, Information and Systems, University of Tsukuba
Focusing on biotype testing, however, is slow, high-cost and complicated, since whiteflies with different biotypes have a similar appearance. Nevertheless, to the best of our knowledge, these schemes [e.g. RAPD-PCR method, (Qiu et al. 2009)] are the only alternative for accurate determination, resulting in decreased utilization of biotype testing.
We focus here on the acoustic communication of Bemisia tabaci, which are spread globally and cause remarkable economical loss in many countries (De Barro et al. 2011; Perring 2001; Tay et al., 2012).
Bemisia tabaci have two major biotypes: Middle East-Asia minor 1 (B-biotype) (Bellows et al., 1994; Lima et al 2000;) and Mediterranean (Q-biotype) (Perring 2001; Chu et al. 2006; Ueda and Brown 2006; Boykin et al. 2007). Meanwhile, hybridization of the B- and Q-biotypes has not been reported, which means that the whitefly reproduction and development process is closed within each biotype. It has been reported that whiteflies make unique sounds before reproduction, and one study found that the acoustic communication plays an important role in the mating process (Kanmiya 1996). Thus, one possibility is that whitefly biotypes could be identified from the characteristics of their sound communication. It has been reported that acoustic sounds of whiteflies vary depending on species (Kanmiya et al. 2011; Kashima et al. 2016) and biotype (Nakabayashi et al. 2016). Hence, biotype identification of whitefly could be achieved by acoustic means.
In this paper, we propose a scheme to identify Bemisia tabaci using acoustic signature, to provide fast, reliable, and cost-effective biotype identification. More specifically, we design a signal-processing method that can detect the sound of whitefly and determine its biotype automatically. The performance of the proposed scheme is then evaluated by experiments. Section 2 presents an overview of the acoustics sounds of Bemisia tabaci and their characteristics. Section 3 describes the biotype identification scheme of Bemisia tabaci by acoustic signature. We evaluate the performance of the proposed scheme in experiments in Section 4, and Section 5 contains our conclusions.
2.
Acoustic sound of Bemisia tabaci
In this section, we present an overview of an acoustic monitoring system that can record the acoustic communication signals of Bemisia tabaci (B-biotype and Q-biotype) as naturally as possible (Nakabayashi 2015), and examine the differences in recorded sounds (Nakabayashi 2016) in 2.1 and 2.2, respectively.
2.1. Acoustic monitoring system of Bemisia tabaci
2.2. Overview of acoustic sound of Bemisia tabaci and their characteristics
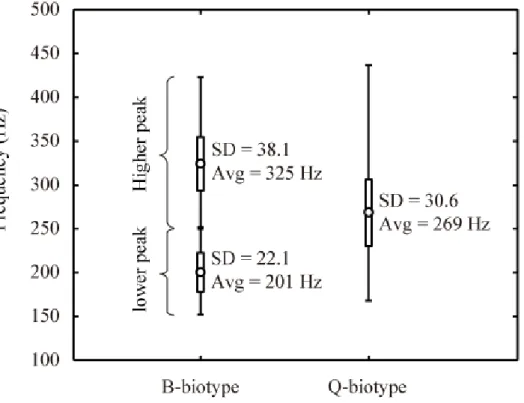
Figure 2 shows the time- and frequency-domains of recorded sounds of Bemisia tabaci B-biotype and Q-biotype obtained from experiments. The time-domain of the recorded sounds [B-biotype: Figure 2(a-1) and Q-biotype: Figure 2(b-1)] revealed that the duration of the sounds was about 0.5 s regardless of biotype. However, for the frequency-domain of sounds [B-biotype: Figure 2(a-2) and Q-biotype: Figure 2(b-2)], it was found that the power spectrum shape of the B- and Q-biotypes were different. Specifically, the power spectrum shape of the (B-biotype) whitefly sound had two peaks at over 300 Hz and under 250 Hz, while the (Q-biotype) spreads were mainly under 300 Hz. Figure 3 shows the maximum, minimum, average and standard deviation of frequency peaks of 3,734 or 5,151 sound samples for each biotype. The results indicate that the power spectrum shape of whitefly sound would be a reliable characteristic for the identification of biotype.
Figure 2. Recorded sound in the time-domain (a-1): B-biotype and (b-1): Q-biotype; and, recorded sound in the frequency-domain (a-2): B-biotype and (b-2): Q-biotype
Figure 3. Maximum, minimum, average (circle) and standard deviation of frequency peaks
3.
Biotype identification scheme of Bemisia tabaci by acoustic signature
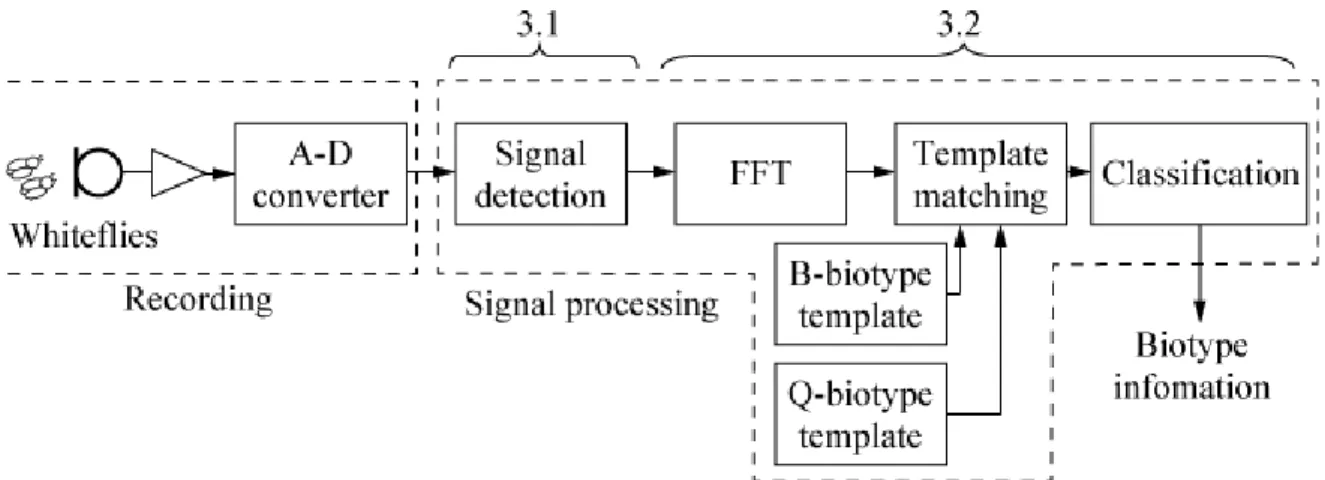
recording step is the same as in our previous study, as shown in Figure 1. The signal processing step consists of three sub-steps; signal detection, frequency-domain matching, and classification of biotype. The details of each sub-step are described in subsections 3.1 and 3.2.
3.1. Automatic detection of whitefly sound
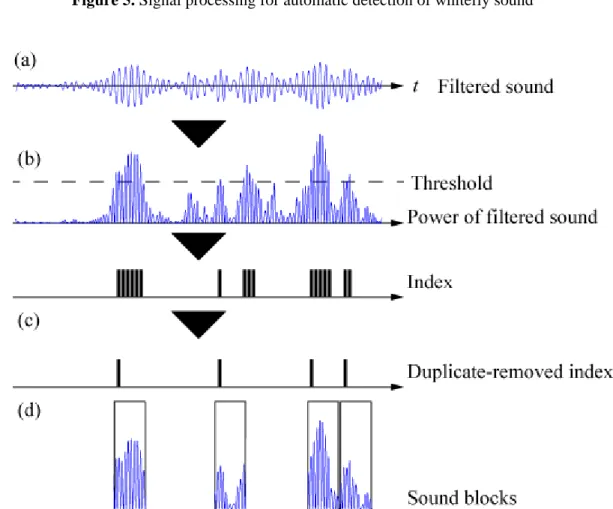
Figure 5 contains a schema that outlines the signal-processing procedure for automatic detection of whitefly sound. The detector first applies a bandpass-filter on the recorded sound [Figure 5(a)]. It then finds an index where the amplitude of the bandpass-filtered signal exceeds the threshold [Figure 5(b)]. After removing the duplicated index, the detector finally samples a specific 0.5-s section that corresponds to whitefly sound [Figure 5(c)].
In the bandpass-filtering process, a bandpass-filter (BPF) of 150-450 (Hz) is applied. Figure 6(a) shows the bandpass-filtered signal of the B-biotype. An index is then created where the power of the bandpass-filtered signal exceeds the threshold [Figure 6(b)]. As shown in this figure, the created index does not correspond to the whitefly sound one-to-one, because there are multiple index elements during a single whitefly sound duration. Hence, index elements whose neighbor difference is within 0.4 s are treated as duplicate records, and duplicates are removed [Figure 6(c)]. Finally, 0.5 s of sound (triggered 0.1 s before each index) is sampled and output as detected whitefly sound [Figure 6(d)].
In this detection process, the value of the threshold determines the performance. Figure 7 shows a relationship between the threshold (0 dB: background noise power) and the number of indexes [blue: index of sound (SUCCESS); red: false alarm (FAIL)] obtained from 5 min of recorded sound. As shown in this figure, it was found that threshold of 20 dB was sufficient to obtain a maximum number of sound indexes in both the B- and Q-biotypes. Hence, the threshold of 20 dB was used. In addition, the number of false alarms increased as the threshold decreased; however, the number of duplicate indexes increased more than the number of false alarms. Hence, the number of false alarms decreased with decreasing threshold after duplication removal.
Figure 5. Signal processing for automatic detection of whitefly sound
Figure 6. Example of signal processing: (a) bandpass-filtered signal; (b) index that exceeds the
Figure 7. A Relationship between threshold and number of indexes [Blue: Index of sound (SUCCESS); Red: False alarm (FAIL)]
3.2. Frequency-domain matching for biotype identification
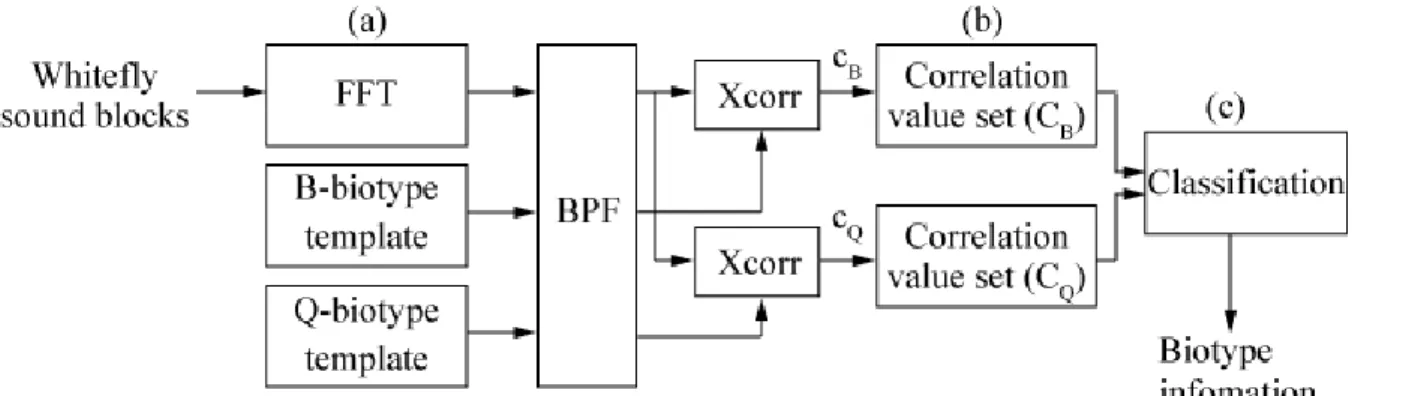
Figure 8 presents a schema detailing the signal-processing approach for biotype identification of whitefly. The identifier first converts the detected whitefly sound in the time domain into the frequency domain by calculating a fast Fourier transform (FFT) [Figure 8(a)]. In this paper, the parameters of the FFT calculation are as follows: the sound sampling frequency is 40 kHz, and duration is 0.5 s, therefore sample size is 20,000 samples, and the window function is a rectangular window. The identifier then compares the detected whitefly sound with the known whitefly sound (template) of the B- and Q-biotypes by calculating a spectrographic cross correlation, and outputs the correlation value [Figure 8(b)]. Finally, the identifier identifies the biotype of the whitefly by analyzing a set of correlation values [Figure 8(c)].
Figures 9 and 10 are examples of the detected B-biotype and Q-biotype whitefly sounds, and template sounds in the frequency domain, respectively. As shown in these figures, both the power spectrum shape and template of detected (B-biotype) whitefly sound spreads mainly over 300 Hz. On the other hand, both the power spectrum shape and template of detected (Q-biotype) whitefly sound spreads mainly under 300 Hz. Hence, the identifier calculates two correlation values, cB and cQ [cB/cQ: correlation value
of the detected whitefly sound and that of template (B/Q-biotype) at 150-450 (Hz)], and stores them as CB and CQ, respectively. Finally, the identifier compares the mean value of CB and CQ, and judges that
Figure 8. Signal processing for biotype identification of whitefly
Figure 9. Examples of the detected whitefly sound: (a) B-biotype, and (b) Q-biotype
4.
Experiments and discussion
The performance of the proposed scheme was evaluated in experiments. The whitefly sound recording was performed using the acoustic monitoring system described in Section 2, and the monitoring and simultaneous biotype identification was performed by software (LabVIEW, National Instruments and MATLAB) on a personal computer (Figure 1).
Prior to the experiment, the template sounds shown in Figure 10 were prepared. Specifically, B-biotype and Q-B-biotype sounds were recorded for 5 min, and 50 sound blocks of 0.5 s were obtained manually for each biotype. Sound templates for the B- and Q-biotypes were then calculated by averaging the power spectrum of each sound block.
The experiment was performed for 280 min for each biotype, and biotype identification was performed every 5 min. Figure 11 shows an example of the distribution of a correlation value set, CB
and CQ. The horizontal axis shows relative correlation value [correlation value divided by
max(CB∪CQ)], and the vertical axis indicates the frequency (the number of cases in each bin). As shown
in this figure, it is clear that the two distributions were separated. Hence, if a suitable threshold were set, biotype identification of Bemisia tabaci using acoustic signatures would be successful. Figure 12 shows the distribution of mean(CB) and mean(CQ), plotted over 280 min, every 5 min. As shown in this figure,
Figure 12. Distribution of mean(CB) and mean(CQ) obtained through the experiment (circle: failure
point of biotype identification)
Figure 13. Number of detected sounds during the experiment (circle: failure point of biotype
5.
Conclusions
The objective of this paper was to develop a biotype identification system for Bemisia tabaci, to enable fast, reliable, and cost-effective biotype testing. To achieve this, a signal-processing method for automatic detection and classification of whitefly biotypes was proposed and designed. Performance of the proposed scheme was evaluated in an experiment. The experiment was performed for 280 min for each biotype, and biotype identification was performed every 5 min. Experimental results showed that biotype identification of Bemisia tabaci could be achieved with a correct detection rate of 92%. The obtained results suggest that the proposed scheme is a viable alternative for biotype testing of whitefly. Our future work will seek to improve the identification performance of this proposed scheme by adjusting sound detection and processing period by adaptively referring the number of detected sounds.
References
Bellows, T, Perring, T, Gill, R, & Headrick, D, 1994 ‘Description of a species of Bemisia (Homoptera: Aleyrodidae) infesting North American agriculture’. Ann Entomol Soc Am vol. 87, no. 2, pp.195-206. https://doi.org/10.1093/aesa/87.2.195
Boykin, LM, Shatters, RG, Rosell, RC, McKenzie, CL, Bagnall, RA, De Barro, P, Frohlich, DR, ‘Global relationships of Bemisia tabaci (Hemiptera: Aleyrodidae) revealed using Bayesian analysis of mitochondrial COI DNA sequences’ Mol. Phylogenet. Evol., vol. 44, no. 3, pp. 1306-1319. https://doi.org/10.1016/j.ympev.2007.04.020
Brown, JK, Frohlich, DR, Rosell RC, 1995. ‘The sweetpotato or silverleaf whiteflies: biotypes of Bemisia tabaci or a species complex?’ Annu Rev Entomol, 40, pp. 511–534. https://doi.org/10.1146/annurev.en.40.010195.002455
Chu, D, Zhang, YJ, Brown, JK, Cong, B, Xu, BY, Wu, QJ, 2006. ‘The introduction of the exotic Q biotype of Bemisia tabaci from the Mediterranean region into China on ornamental crops’, Fl Entomol., vol. 89, no. 2 pp. 168-174. https://doi.org/10.1653/0015-4040(2006)89[168:TIOTEQ]2.0.CO;2
Czosnek, H, Ghanim, M, Morin, S, Rubenstein, G, Frieadman, V, Zeidan, M, 2001 ’Whiteflies: Vectors, and victims (?), of geminiviruses’. Advances in virus research, vol. 57, pp. 291-322. https://doi.org/10.1016/S0065-3527(01)57006-2
De Barro, PJ, Liu, SS, Boykin, LM, Dinsdale, AB 2011. ‘Bemisia tabaci: a statement of species status’ Annual Review of Entomology, vol. 56, pp. 1-19. https://doi.org/10.1146/annurev-ento-112408-085504
Denholm, I, Cahill, M, Dennehy, TJ, Horowitz, AR, 1998. ‘Challenges with managing insecticide resistance in agricultural pests, exemplified by the whitefly Bemisia tabaci’, Philos Trans R Soc Lond B Biol Sci, 353, pp. 1757– 1767. https://doi.org/10.1098/rstb.1998.0328
Horowitz, AR, Kontsedalov, S, Khasdan, V, Ishaaya, I, 2005. ‘Biotypes B and Q of Bemisia tabaci and their relevance to neonicotinoid and pyriproxyfen resistance’, Arch Insect Biochem Physiol, vol. 58, no. 4, pp. 216– 225. https://doi.org/10.1002/arch.20044
Jones, DR 2003. ‘Plant viruses transmitted by whiteflies’. European Journal Plant Pathology, vol. 109, no. 3, pp. 195–219. DOI: 10.1023/A:1022846630513
Aleyrodidae) biotypes in Brazil using RAPD markers’. Genet Mol Biol, vol. 23, no. 4, pp. 781– 785. https://doi.org/10.1590/S1415-47572000000400012
Ma, D, Gormanc, K, Devine, G, Luo, W, & Denholm, I 2007. ‘The biotype and insecticide- resistance status of whiteflies, Bemisia tabaci (Hemiptera: Aleyrodidae), invading cropping systems in Xinjiang Uygur autonomous region, northwestern China’, Crop Protection, vol. 26, no. 4, pp. 612– 617. https://doi.org/10.1016/j.cropro.2006.04.027
Nakabayashi, H, Kawagishi, T, Koichi, M, Ebihara, T, Naoto, W, Hiroyuki, U & Kenji, K 2016. ‘Observation of acoustical behavior of some biotypes of Bemisia tabaci’, International Conference on Agricultural Engineering (CIGR), ID. 486, Available from: CIGR-2016 Full Papers, [26 May 2017]
Nakabayashi, H, Kawagishi, T, Koichi, M, Ebihara, T, Naoto, W, Hiroyuki, U & Kenji, K 2015. ‘Observation of Acoustical Behavior of Whitefly Colony’, 7th International Conference on Sustainable Agriculture for Food, Energy and Industry in Regional and Global Context (ICSAFEI2015), Kuala Lumpur, Malaysia, CD-ROM, ICSAFEI-132.
Perring, T. M., 2001. ‘The Bemisia tabaci species complex’, Crop Protect. 20, 725. DOI; 10.1016/S0261-2194(01)00109-0
Prabhaker, N, Castle, S, Henneberry TJ & Toscano, NC, 2005 ‘Assessment of cross-resistance potential to neonicotinoid insecticides in Bemisia tabaci (Hemiptera: Aleyrodidae)’. Bull. Entomol. Res. Vol. 95, no. 6, pp. 535–543. https://doi.org/10.1079/BER2005385
Qiu, B, Chenb, Y, Liua, L, Penga, W, Lia, X, Ahmeda, MZ, Mathurc, V, Dud, Y, Rena, S 2009 ‘Identification of three major Bemisia tabaci biotypes in China based on morphological and DNA polymorphisms’, Progress in Natural Science, vol. 19, no. 6, pp. 713–718. https://doi.org/10.1016/j.pnsc.2008.08.013
Tay, WT, Evans, GA, Boykin, LM, De Barro, PJ, 2012. ‘Will the real Bemisia tabaci please stand up?’ PIoS One, 7, e50550. https://doi.org/10.1371/journal.pone.0050550
UC IPM 2016, ‘Tomato: PEST MANAGEMENT GUIDELINES FOR AGRICULTURE’, Available from: http://ipm.ucanr.edu/PMG/r783103311.html pp. 106-107. [26 May 2017]
UC IPM 2016, ‘Tomato: PEST MANAGEMENT GUIDELINES FOR AGRICULTURE’, Available from: http://ipm.ucanr.edu/PMG/r783103311.html pp. 68-71. [26 May 2017]

![Figure 7. A Relationship between threshold and number of indexes [Blue: Index of sound (SUCCESS); Red: False alarm (FAIL)]](https://thumb-us.123doks.com/thumbv2/123dok_us/8063192.2135410/7.893.116.767.147.408/figure-relationship-threshold-number-indexes-index-success-false.webp)