Hungarian Association of Agricultural Informatics European Federation for Information Technology in Agriculture, Food and the Environment
Journal of Agricultural Informatics. Vol. 7, No. 2 journal.magisz.org
New methodology for measuring the floating velocity of grain particles
Polyák N I1, Csizmazia Z2
I N F O
Received 13 Jun. 2016 Accepted 15 Jul. 2016
Available on-line 15 Aug. 2016 Responsible Editor: M. Herdon
Keywords:
physical properties of particles, aerodynamic characteristics of grains, new method, image processing.
A B S T R A C T
The physical characteristics of particles used in agriculture (seeds, fertiliser particles) can strongly influence their movements in the agricultural machine as well as in the air. The knowledge of the physical characteristics of particles is essential for the designer and operators. In this respect the size, size distribution, shape, mass, bulk density, real density, coefficient of friction and aerodynamic resistance of particles are of great importance. Among physical characteristics, aerodynamic properties are the most important for the description of seed movement in the air.
The knowledge of the aerodynamic characteristics of grains (floating velocity, aerodynamic resistance coefficient) is significant for the construction and operation of machines, which treat substances with air flow and in all cases when substances are moved in the air. The theory of the aerodynamic characteristics of regularly shaped bodies is well elaborated; however, grains (seed grains, fertilizer particles) applied in agricultural practice are irregularly shaped. Therefore, in our earlier research we started to study the physical characteristics of irregularly shaped grains. Due to their irregular shape, determining the size of grains is a troublesome process. A precise description of grains has to include several sizes (length, width, thickness) and can be obtained from the screen size of the corns.
To identify the aerodynamic characteristics of seeds, we have developed a new elutriator, in which airflow is supplied by a centrifugal fan. The air velocity was measured with a thermal sensor. The collecting of data was supported by a digital camera, and we analysed the collected data by an image processing, so we can describe the movement of the seeds, and we can determine precisely the terminal velocity of irregular shaped seeds. The average moisture content of the samples was 13.42%. The individual mass of seeds varied between 0.1889 and 0.3758 g. The value of the mass of 1000 seeds used in general practice was 317.562 gr. The grain size varied: length between 7.76 and 11.81 mm, width between 6.77 and 9.99 mm, thickness between 4.41 and 5.85 mm. The suspension velocity varied between 9.14 m/s and 10.65 m/s.
1. Introduction
One of the main research areas of the Department of Agricultural Engineering of the Debrecen University, Hungary is to define the physical properties of particles used in Agriculture (seed grains, fertilizer particles) (Csizmazia & Polyák 2001, Csizmazia & Polyák 2003, Csizmazia & Polyák 2004a, b, Csizmazia & Polyák 2008, Polyák & Csizmazia 2003a, b). On the basis of our research it can be said that there is a difference in the physical properties of the grains even within the same species (Csizmazia, Polyák & Kazsa 1994, Polyák 1998, Polyák 2000, Polyák 2001). The knowledge of the physical characteristics of seeds is essential for the designers and operators of agricultural machines (spreaders, sowing-machines, grain cleaners, etc.). Among physical characteristics, the most important are the frictional and aerodynamic properties for the description of particle movement.
In order to determine grains aerodynamic characteristics, we cooperated with the Budapest University of Technology and Economics (BMGE) for development of a perpendicular air-tube, which we used for determination of the aerodynamic properties of seed grains and fertilizer particles. With
1 Ilona Nagyné Polyák
Debrecen University
2 Zoltán Csizmazia
Debrecen University
these irregularly shaped bodies, floating velocity varies in a rather wide spectrum, even in the case of a single grain. Using a visual – and therefore subjective - method for floating velocity measurement made it impossible to generate a sufficiently large number of exact measured data. So it was essential to improve our measuring methods. To achieve this objective, we planned to further develop our former equipment in a way that it should allow the analysis of the aerodynamic properties of grains from data gained by digital measurements on the movements of grains and by image processing on the distribution of the floating velocity of a single grain (Polyák, Csizmazia & Szilágyi 2009, Polyák & Csizmazia 2010)
2. Materials and Methods
We undertook our experiments on corn kernels. Investigations were performed in the analytical laboratory of the Department of Agricultural Engineering. The temperature of the laboratory was kept at 20 °C, relative humidity varied between 25-35%. 50 kg/air dry seed was available, which we stored in the test chamber for several months prior to the investigation. The moisture content of the samples of 3 x 25 g was defined at 103+1 °C in the course of 72 hours' drying. According to sampling standards, we chose 50 seeds for determining the size, shape and aerodynamic properties. Three grain dimensions (length, width, thickness) were carefully measured using a micro meter with an accuracy of 0.01 mm, and each grain was weighed by an electronic balance capable of reading to 0,1 mg. To identify the aerodynamic characteristics of seeds, an elutriator was designed and constructed (Csizmazia, Lajos, Marschall & Polyák 2000).
3. Theoretical and practical basis
Keck and Goss (1965) were among the first who tried to measure the aerodynamic resistance and the terminal velocity of seeds in free fall. They used drop tubes varying in height from about 0.6 m to about 9 m. The fall time of seeds and nylon spheres (3.175 mm diameter) was measured. The latter were used for comparison with the classical data for spheres. They used an approximation rule to compute the velocity for each drop. The particle terminal velocity was calculated by using the equation:
(1) p p a D
r
C
K
ρ
ρ
1
8
3
=
in to equation 2pt
v
g
K
=
and 𝐶𝐶𝐷𝐷 taken to be 0,44.Where: K aerodynamic resistance coefficient [m-1]
Cd drag coefficient ρa air density [kg/m3] ρp particle density [kg/m3] rp particle radius [m]
Another implementation of the time versus distance relationship method is based on the solution of the differential equation that describes the motion of a particle in still air. Mohsenin (1968) gives an analytical solution of this equation for the relationship between distance s and time t. This time versus distance relationship is based on the assumption that the value of CD or K is constant and known during the fall of the particle.
Bilanski (1971) summarizes the research on aerodynamic properties of agricultural products reported in the literature for a five-year period 1966-1971.
Hofstee (1993) studied the aerodynamic resistance coefficient of fertilizer particles and concluded that the aerodynamic resistance measurements show a large difference between the results of the elutriator method and the time versus distance relationship method. This experiment showed that fertilizers with a relatively smooth surface texture have a lower aerodynamic resistance coefficient than fertilizers with a rougher surface texture.
Sitkei (1981) summarizes the research on aerodynamic properties of agricultural products and draws graphs of the aerodynamic drag coefficient of different agricultural materials.
• the terminal velocity of the particle in free-fall through still air may be measured;
• the particles may be suspended stationary in a vertical air stream having the appropriate velocity; • particles of different aerodynamic characteristic may be suspended simultaneously in a vertical wind tunnel, which diverges to give a linear decrease in air velocity as a function of elevation.
The aerodynamic drag coefficient of a particle may be calculated for these three methods using the measured free-fall terminal velocity or suspension air velocity and knowing particle weight and frontal area. These methods are either limited to the study of single particles or to very small samples of the particles (Law & Collier, 1973).
An airborne particle moving relative to its surrounding air experiences gravitational, buoyant, frictional and inertial forces which are acting on it. For a given size particle moving through air at a given relative velocity, the magnitude of the aerodynamic drag coefficient CD is related to the Reynolds number for that particular flow condition. For a particle traversing a vertical path y = y(t) in a gravitational field, the Newtonian mechanics gives the equation of motion.
(2)
(
)
2 2 2 − − = dt dy k mg dt y d m s s
ρ
ρ
ρ
Where: m particle mass [kg]
g gravitational acceleration [m/s2]
ρs particle density [kg/m3]
ρ air density [kg/m3]
k aerodynamic resistance coefficient [kg/m]
For grain ρs»ρ. Thus, when the grain attains a terminal velocity of vt then
(1)
equation
and
and
0
2 2 tv
dt
dy
dt
y
d
=
=
(3) 2
t
v
mg
k
=
Experimental measurement of grain weight and terminal velocity relative to the surrounding air allows the calculation of the resistance coefficient k using equation (3). Mennel & Reese (1963) found the turbulent flow regime to exist at Reynolds numbers greater than approximately 50 for small irregular-shaped particles. For a spherical particle the use of k circumvents the necessity of determining the particle projected area A as measured in the plane perpendicular to the velocity vector. The resistance coefficient k is related to the aerodynamic drag coefficient CD as
(4)
ρ
A
k
C
D=
2
In equation (3) the relative velocity vt may exist either due to the grain falling through still air or by a vertically-blowing air stream suspending the grain. The latter approach is the basis for the elutriation technique.
To determine the suspension velocity of grains Gorial & O’Callaghan (1990) used a tube with a rectangular cross-section and two diverging walls (2°). A centrifugal fan delivered the air through a flow straightened section, which consisted of two layers of fine wire mesh above and below a honeycomb grid.
Brübach (1973) used a vertical Plexiglas tube to measure the terminal velocity of fertilizer particles. The air was supplied at the bottom side and the air velocity was regulated with a reduction valve.
A 0,84 mm (30 mesh) stainless steel screen separated the test channel from the plenum and supported the particles until the test began.
On the basis for the elutriation technique an apparatus was developed (Figure 1.) in this present study for the experimental determination of the aerodynamic properties of grains.
Figure 1. The plan of the elutriator
The developed elutriator consisted of a 865 mm long plexiglass vertical tube (1) with a diameter of 100mm in which an airflow is supplied by a centrifugal fan (2). The air velocity was regulated with the modification of the fan’s rpm. The air flowed from the fan through a plenum chamber (3) upward into the 400mm long test zone of the elutriator.
A stainless steel screen with bore size of 0.56 mm (about 45 mesh) separated the test zone from the plenum chamber and supported the grain until the test began. A large number of holes were bore on the mantle of the plexiglass tube along the test zone. Theoretically specified and precisely constructed perforation decreased air velocity with 20% in the test zone, so the suspension velocity of seeds could be measured efficiently. The perforation decreased the boundary layer and allowed the formation of a relatively flat air velocity profile in the cross-section of the test zone.
Figure 2. The developed elutriator
Elutriation tests were conducted to measure the aerodynamic properties of the kernel of corn. Three grain dimensions (length, width, thickness) were carefully measured using a micro-meter with an accuracy of 0.01 mm, and each grain was weighed by an electronic balance capable of reading to 0.0001 g. 50 random samples of grain were used by the test. A grain was placed on the stainless steel screen. The blower rpm was gradually increased until the grain was suspended in the air and the air velocity (terminal velocity) was measured with the thermal sensor. Ideal, stable conditions in the floating experiments could not be obtained because grains assumed different positions within the air stream, since they rotated and tumbled due to their irregular shape and the turbulence of flow. For this reason the average terminal velocity could only be recorded when the grains were suspended in the central region of the test zone.
Using a visual – and therefore subjective - method for floating velocity measurement made it impossible to generate a sufficiently large number of exact measured data. So it was essential to improve our measuring methods. To achieve this goal we planned to further develop our former equipment in a way that it should allow the analysis of the aerodynamic properties of grains from data gained by digital measurements on the movements of grains and by image processing on the distribution of the floating velocity of a single grain.
4 Calibration of the equipment
The mass m and the terminal air velocity vt were used in equation (2) to calculate the resistance coefficient k.
Air velocity profiles were measured in the test section of the elutriator at vertical distances of 0, 62, 130, 203, 282 and 365 mm above the lower hole line (Figure 3). The figure shows that air velocity began to decrease only 2-3 mm from the walls.
Figure 4. shows the air velocity measured in the test section of the elutriator without the boundary layer at different vertical distances above the lower hole line. According to Figure 4. the air velocity change was approximately linear along the axis of the test zone. The decrease of the air velocity was about 20 %.
Figure 4. Air velocity profiles in the test section
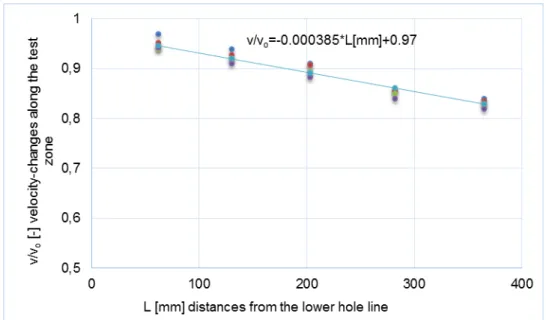
The comparison of the air velocity at the beginning of the test zone (v0) to the air velocity changing along the test zone (v) gave a linear equation (Figure 5.).
Figure 5. Velocity-changes along the test zone
v0= 16,65
v0= 14,40
v0= 10,68
v0= 7,00
0 3 6 9 12 15 18
0 50 100 150 200 250 300 350 400
v
[
m
/s
] av
er
age
ai
r
v
el
oc
it
y
i
n t
he c
ros
s
s
ec
ti
on
Figure 6. Velocity-changes along the test zone
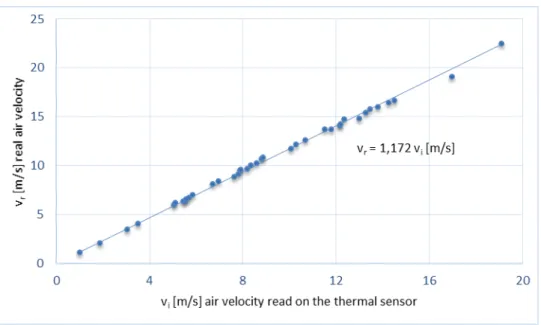
The thermal sensor (Testo 445) was calibrated in a ventilation shaft. The results of the calibration test are seen in Figure 6. The comparison of air velocity read on the thermal sensor (vi) to real air velocity
(vr) gave a linear equation.
5. Results
In order to determine the coordinates (200-250 coordinates per measurement) and the floating velocity of the seeds moving in the test zone, we took 10-seconds-long snapshots for each speed using a DCR-DVD505 digital camera. So we had 240-300 pictures at each measurement of the fifty corn particles (Figure 7). We used the NI Vision Builder software for image processing. Processing was difficult, because the 204 holes bored into the test zone appeared on the images as shining spots; and also the surface of the plexiglas tube was glary in some spots.
We planned to get the grain object by subtracting an empty picture (a picture without grain) from every picture received during measurement (the pictures of floating seeds) and then we could detect the object on the resulting picture and write the coordinates of this object into a file to calculate the air velocity at that given height. We thought that this was the best way, because the 204 holes bored into the test zone appeared as shining spots on the images; and also the surface of the plexiglass tube was glary in some spots. As a result of the material, shape, technological realization of the test tube and mainly the luminous phenomena during the measurement, differences were not only generated in the place of the floating seeds (Figure 8). We concluded that if we used this measurement method the experiment must be carried out under artificial lighting.
Figure 8. The difference between the two pictures
Figure. 9. The original image and the identification of the seed
Figure 10. Floating velocity values determined by the two methods
The distribution of the average floating velocity determined by the visual method can be seen on
(Figure 11.), and the distribution of the average floating velocity determined by the digital method can be seen on (Figure 12.)
Figure 12. The distribution of the average floating velocity determined by digital method
The average floating velocity determined by visual reading was (9.68 m/s) and the average floating velocity determined using the digital method was (9.81 m/s).
6. Conclusion
We can measure the floating velocity by processing the pictures. We can use the subtraction of pictures to detect the object if we use artificial light. With the visual method the terminal velocity can only be recorded when the grains are suspended in the central region of the test zone, therefore it requires a precise setting which is not necessary in case of the digital method.
We found a difference between the average floating velocity determined by visual reading (9.68 m/s) and the average floating velocity determined using the digital method (9.81 m/s), but the difference was statistically non-significant.
References
Bilanski, W K 1971 ‘Aerodynamic properties of agricultural products research, past and present’ ASAE Paper, pp 71-846, ASAE, St. Joseph, Mich. 49085.
Brübach, M 1973 ’Der Einfluss der Korngrösse, Granulatfestigkeit und der Reibung auf die Verteilung von Dünge- und Pflanzenschutz Granulaten (Effect of particle size, particle strength and friction on the distribution of fertilizer and plant protection granules)’ Dissertation TU-Berlin, Berlin, pp. 120.
Csizmazia, Z, Polyák, N I, & Kazsa, F 1994 ’The Determination of Physical Characteristics of Seeds for the Construction of Seeding Machines’ Hungarian Agricultural Engineering, No. 7, pp. 63-66.
Csizmazia, Z, Lajos, T, Marschall, J, & Polyák, N I 2000 ’Új rendszerű légcsatorna fejlesztése’ Mezőgazdasági Technika, évf. 41, sz. 9, pp. 2-5.
Csizmazia, Z, & Polyák, N I 2001 ’Movement of Particles in the Air’ Acta Agraria DebreceniensisJournal of Agricultural Sciences, 1, pp. 22-26.
Csizmazia, Z, & Polyák, N I 2003 ’The physical characteristics of hemp seed’ 4th International Symposium Materials from Renewable Resources, Erfurt, pp. 129.
Csizmazia, Z, & Polyák, N I 2004 ’Physical Properties of Grean-Pae Seeds’ IAMFE-RUSSI 2004. 12th
International Conference and Exhibition on Mechanization of Field ExperimentsSt. Petersburg-Pushkin, Russia. pp. 371-375
Csizmazia, Z, & Polyák, N I 2008 ’Physical Characteristics of Seeds and their Effects to the Sowing Accuracy. AgEng International’ Conference on Agricultural Engineering, Hersonissos, Crete, Grece, Abstracts Part 1, pp. 172-173.
Gorial, B Y, & O Callaghan, J R 1990 ’Aerodynamic properties of grain/straw materials’ Journal of Agricultural Engineering Research 46, 4, pp. 275-290.
Hofstee, J W 1993 ’Physical Properties of fertilizer in relation to handling and spreading’ Thesis Wageningen, ISBN 90-5485-149-X, 145.
Keck, H, & Goss, J R 1965 ’Determining aerodynamic drag and terminal velocities of agronomic seeds in free fall’ Transactions of the ASAE 8, 4, pp. 553-554, 557. doi: 10.13031/2013.40579
Law, S E, & Collier, J A 1973 ’Aerodynamic resistance coefficients of agricultural particulate determined by elutriation’ Transactions of the ASAE5, pp. 918-922.
Mennel, R M, & Reece, A R 1963 ’The theory of the centrifugal distributor, III: particle trajectories’ Journal of Agricultural Engineering Research 1, pp. 78-84.
Mohsenin, N N 1968 ’Physical properties of plant and animal materials’ New York and Breach, pp. 742.
Polyák, N I 1998 ’Some Physical Characteristics of Seeds’ IAMFE-ARGENTINA,98. First Latin American IAMFE Conference and Exhibition, pp. 247-255.
Polyák, N I 2000 ’Movement of Wheat Grains in the Air. IAMFE/AABUK’ The 11th International Conference and Exhibition on Mechanization of Field Experiments. 2000, pp.241-248.
Polyák, N I 2001 ’Búza vetőmag fizikai jellemzői (Physical characteristics of wheat seeds)’ PhD tézis, Debrecen, pp. 22.
Polyák, N I, & Csizmazia, Z 2003 ’The Physical Characteristics of Fertiliser Particles’ XXX CIOSTA-CIGR V Congress, Turin, Management and technology applications to empower agro-food systems,. ISBN 88-88854-09-6. pp. 759-7688-88854-09-6.
Polyák, N I, & Csizmazia, Z 2003 ’Phisical Properties of Seeds of Vegetables’ Hungarian Agricultural Engineering, No. 16, pp. 35-37.
Polyák, N I, Csizmazia, Z, & Szilágyi, R 2009 ’A New Method for Measuring the Floating Velocity of Particles’ XXIII.CIOSTA-CIGR V Conference 2009, Reggio Calabria, Technology and management to ensure sustainable agriculture, agro-systems, forestry and safety. ISBN 978-88-7583-031-2 Part 1. pp. 773-778.
Polyák, N I, & Csizmazia, Z 2010 Measuring the Terminal Velocity of Particles with an Elutriator Using Image Analysis. Image Analysis in Agriculture (CIGR Workshop), Budapest, pp. 50-56. ISBN 978-963-503-417-8.

![Figure 3. Air velocity profiles in the test section, L [mm] distances from the lower hole line](https://thumb-us.123doks.com/thumbv2/123dok_us/8063519.2135510/5.892.139.720.782.1112/figure-air-velocity-profiles-test-section-distances-lower.webp)