AN EMPIRICAL STUDY ON DISTRICT-WISE CHANGES IN CROPPING
PATTERN IN RAJASTHAN
Dasrath Kumar
1, Dr. Kalu Ram
2Department of Geography
1,2
OPJS University, Churu (Rajasthan) – India
ABSTRACT
Cropping pattern is a dynamic idea since it changes over reality. It tends to be characterized as the extent of area under different crops at a point of time. As such, it is a yearly succession and spatial plan of sowing and fallow on a given area. After point by point analysis of cropping pattern in state in various timeframe now, in this part it examine about cropping pattern of various crops like cereals crops – Wheat, Bajra, Maize, total cereals crops, in pulses crops – Moong, Moth, Gram and total pulses, total foodgrains crops, in oilseeds crops – Groundnut, Sesamum, Soyabean, Rapeseed and Mustard and total oilseeds, cumin, coriander, Cotton, Guar and all crop in state. In this paper we mainly study the district wise analysis of changing cropping pattern in Rajasthan.
1. INTRODUCTION
Rajasthan is an agrarian state, where 80% of the total population dwells in rural area and to a great extent dependent on agriculture as the source of their livelihood. The economy of state is for the most part depended on agriculture. 22.5 percent of state's GDP originates from agriculture. Perceived as the biggest province of India, Rajasthan has developed area of just about 20 million hectares however because of some unavoidable conditions on 20% of the total developed area is irrigated. This truly is a strained circumstance.
The climate is arid and hot. Vast part of terrain is dry. Droughts are normal in Rajasthan and state has encountered some serious droughts in most recent couple of decades. Because of temperamental climate conditions farmers need to depend on both rainfed and ground water agriculture. With the diminishing ground water level, the cropping circumstance is increasingly
horrendous as the farmers in the state need to endure for the most part on ground watergot from Punjab Rivers in the north, the Narmada River in the south and the Agra Canals from Haryana and Uttar Pradesh are the water giving sources to the dry land. Northwestern Rajasthan is irrigated by the Indira Gandhi Canal. Irrigation is done through electric pumps.
2. CROPPING PATTERN IN RAJASTHAN STATE
Cropping pattern alludes to extent of area under various crops at various purposes of time. It likewise shows the time and spatial arrangement or fallow in a specific land area. This infers any change in cropping pattern would show (1) an adjustment in extent of land under various crops (2) an adjustment in existence succession of the crops.
oxen. These days’ farmers are utilizing tractors for this reason. The utilization of synthetic fertilizers and pesticides has expanded the crop productivity and now the state is independent in the production of food grains. The two major crops sown in the region are Rabi crops and Khariff Crops.
Rabi Crops: Otherwise called winter crops are primarily the crops depended on ground water irrigation. These are the crops which are developed in the
long stretches of October and
November and are harvested in the long periods of March and April. .
Khariff Crops: Otherwise called rain bolstered crops are sown in the long stretches of June and July and harvested in the long periods of September and October. These are the crops which are totally depended on rains, where there is great rain there is bumper production.
3. CHANGES IN CROPPING PATTERN
This area examinations changes in cropping pattern of selected groups of crops over the
investigation time frame Cropping pattern here methods the crop diversification and changes in relative share of each group of crops in value of output, total cropped area and irrigated area. This area likewise investigations the cropping pattern as far as output per section of land and output per capita. The interconnections between these two measures are inspected crosswise over districts of Rajasthan for triennia1990-93, 2000-03 and 2011-14.
3.1 District-wise Analysis
Table 1 shows district-wise changes in cropping pattern. Based on land productivity the districts have been divided into four classifications containing as highly developed, developed, under developed and highly under developed districts. The principle objective is to dissect the cropping pattern among the districts divided into four classifications based on land productivity. Changes in cropping pattern are reflected by changes in the share of different groups of crops in total value of output, total cropped area, total irrigated area and crop yield.
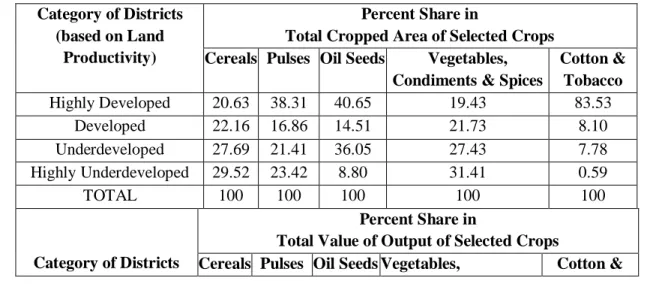
Table 1: Cropping Pattern and Crop Yields for Different Categories of Districts, 1990-93
Category of Districts (based on Land
Productivity)
Percent Share in
Total Cropped Area of Selected Crops Cereals Pulses Oil Seeds Vegetables,
Condiments & Spices
Cotton & Tobacco
Highly Developed 20.63 38.31 40.65 19.43 83.53
Developed 22.16 16.86 14.51 21.73 8.10
Underdeveloped 27.69 21.41 36.05 27.43 7.78
Highly Underdeveloped 29.52 23.42 8.80 31.41 0.59
TOTAL 100 100 100 100 100
Category of Districts
Percent Share in
Total Value of Output of Selected Crops
ondiments & Spices
Tobacco
Highly Developed 38.89 47.50 49.35 32.99 89.07
Developed 27.19 22.47 13.29 16.87 4.68
Underdeveloped 20.52 18.35 30.76 22.80 5.45
Highly Underdeveloped 13.41 11.68 6.60 27.35 0.79
TOTAL 100 100 100 100 100
Category of Districts Percent Share in
Total Irrigated Area of Selected Crops Cereals Pulses Oil Seeds Vegetables,
Condiments & Spices
Cotton & Tobacco
Highly Developed 42.43 37.31 45.99 22.55 42.43
Developed 37.49 33.48 29.04 25.32 37.49
Underdeveloped 15.27 27.04 19.02 47.63 15.27
Highly Underdeveloped 4.81 2.17 5.94 4.50 4.81
TOTAL 100 100 100 100 100
Category of Districts
Crop Yield (Rs per hectare)
Cereals Pulses
Oil Seeds
Vegetables, Condiments & Spices
Cotton & Tobacco
Highly Developed 5788.41 5807.91 7514.87 45328.46 3691.04
Developed 3983.16 4603.93 5134.10 18569.29 2756.51
Underdeveloped 2416.27 2962.86 5675.33 22764.40 2568.84
Highly Underdeveloped 1557.96 1952.49 5580.82 14582.41 8279.32
Source: Author’s Calculation
The group of highly developed districts with 20.63 percent share of total cropped area under cereals contributes 38.89 percent in value of output while the base group of highly underdeveloped districts with more share altogether cropped area under cereals (29.52) as was with highly developed district contributes just 13.41 percent share in value of output in 1990-93. There is practically fourfold contrast in crop yield of cereal between highly developed and highly under developed districts. One reason could be that highly developed districts have progressively proportionate share of irrigated area under these crops. Highly
developed districts have 42.43 percent irrigated area under these crops despite what might be expected it was 4.81 for highly underdeveloped districts in 1990-93. If there should arise an occurrence of developed districts their maximum share both altogether cropped area and value of output was from cereals group of crops. While in the event of underdeveloped districts it was oilseeds.
recently 11.68 percent share in value of output with 23.42 shares altogether cropped area under pulses. If there should arise an occurrence of oilseeds the highly developed districts share altogether cropped area was just about multiple times higher though in the event of value of output it was very nearly multiple times than highly underdeveloped districts.
If there should arise an occurrence of share altogether cropped area under vegetable (potato), condiment (ginger) and spice (red chillies) it was 1.6 occasions higher for highly underdeveloped districts than highly developed districts because of production of red chillies in highly underdeveloped districts, however their share in value of output was not exactly highly
developed districts. If there should be an occurrence of cotton and tobacco highly developed districts share altogether cropped area and value of output was a lot higher than the highly underdeveloped districts. There was wide variation in crop yield and area under irrigation for different groups of crops among different groups of districts in 1990-93.
Crop yield for cereal has been determined by separating total value of these crops by total cropped area under these crops. So also crop yield is determined for other group of crops. As crop yield (Rs per hectare) for cereals was right around multiple times higher for highly developed districts when contrasted with highly under developed districts for triennium 1990-93.
Table 2: Cropping Pattern and Crop Yields for Different Categories of Districts, 2000-03
Category of Districts (based on Land Productivity)
Percent Share in
Total Cropped Area of Selected Crops
Cereals
Pulses
Oil Seeds
Vegetables, Condiments
& Spices
Cotton & Tobacco
Highly Developed 23.37 23.62 45.60 19.82 77.29
Developed 25.28 23.91 25.89 22.48 0.97
Underdeveloped 19.05 26.76 14.72 16.19 10.98
Highly Underdeveloped 32.30 25.71 13.78 41.51 10.76
TOTAL 100.00 100.00 100.00 100.00 100.00
Category of Districts
Percent Share in
Total Value of Output of Selected Crops
Cereals Pulses
Oil Seeds
Vegetables, Condiments & Spices
Cotton & Tobacco
Highly Developed 44.57 33.01 54.82 32.92 76.06
Developed 29.83 43.01 23.72 19.77 1.90
Underdeveloped 14.31 19.16 11.51 10.93 10.26
Highly Underdeveloped 11.29 4.83 9.95 36.37 11.78
Category of Districts
Percent Share in
Total Irrigated Area of Selected Crops
Cereals Pulses
Oil Seeds
Vegetables, Condiments & Spices
Cotton & Tobacco
Highly Developed 38.52 29.14 44.08 19.39 56.39
Developed 29.54 36.11 24.11 17.41 1.42
Underdeveloped 22.13 31.85 22.16 16.67 36.94
Highly Underdeveloped 9.82 2.90 9.65 46.52 5.25
TOTAL 100.00 100.00 100.00 100.00 100.00
Category of Districts
Crop Yield (Rs per hectare)
Cereals Pulses
Oil Seeds
Vegetables, Condiments &
Spices
Cotton & Tobacco
Highly Developed 12524.11
1
3297.96 14309.85 70974.73 2699.81
Developed 7766.02 1 0702.27 11191.90 28659.45 7846.16
Underdeveloped 4930.35 7 678.31 8402.59 20322.55 2508.33
Highly Underdeveloped 2299.29 1 059.35 7906.64 33931.28 2957.62
Source: Author’s Calculation
The group of highly developed districts with 23.37 percent share of total cropped area under cereals contributes 44.57 percent in value of output while the base group of highly underdeveloped districts with significantly more share altogether cropped area under cereals (32.30) as was with highly developed district contributes just 11.29 percent share in value of output in 1990-93. There is 5.5 occasions distinction in crop yield of cereal between highly developed and highly under developed districts. Highly developed districts have 38.53 percent irrigated area under these crops despite what might be expected it was 9.82 for highly underdeveloped districts in 2000-03. If there should arise an occurrence of developed districts all group of crops have practically same share total cropped area with the exception of cotton and tobacco. Yet, the maximum share in value of output was from pulses as was in 1990-93.
While if there should be an occurrence of underdeveloped districts it was pulses.
There was wide contrast in the percentage share of pulses altogether cropped area and value of output for highly developed and highly underdeveloped districts in 2000-03. With higher share altogether cropped area under pulses, the percentage share in value of output was right around multiple times less for this group of districts than the highly developed district.
districts contribute twice to value of vegetable, condiment and spice production than their share in land area. In actuality underdeveloped group's share in production is not exactly their share in land area for same crops in 2000-03. If there should occur of cotton and tobacco highly developed districts share altogether cropped area and value of output was a lot higher than the
highly underdeveloped districts. There was wide variation in crop yield and area under irrigation for different groups of crops among different groups of districts in 2000-03. Crop yield (Rs per hectare) for cereals was in excess of multiple times higher for highly developed districts when contrasted with highly under developed districts in 2000-03.
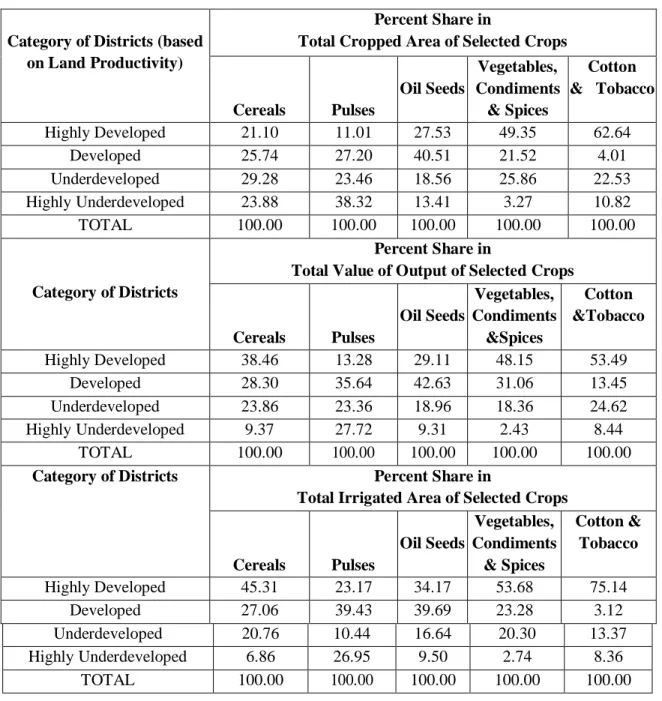
Table 3: Cropping Pattern and Crop Yields for Different Categories of Districts, 2011-14
Category of Districts (based on Land Productivity)
Percent Share in
Total Cropped Area of Selected Crops
Cereals Pulses
Oil Seeds
Vegetables, Condiments
& Spices
Cotton & Tobacco
Highly Developed 21.10 11.01 27.53 49.35 62.64
Developed 25.74 27.20 40.51 21.52 4.01
Underdeveloped 29.28 23.46 18.56 25.86 22.53
Highly Underdeveloped 23.88 38.32 13.41 3.27 10.82
TOTAL 100.00 100.00 100.00 100.00 100.00
Category of Districts
Percent Share in
Total Value of Output of Selected Crops
Cereals Pulses
Oil Seeds
Vegetables, Condiments
&Spices
Cotton &Tobacco
Highly Developed 38.46 13.28 29.11 48.15 53.49
Developed 28.30 35.64 42.63 31.06 13.45
Underdeveloped 23.86 23.36 18.96 18.36 24.62
Highly Underdeveloped 9.37 27.72 9.31 2.43 8.44
TOTAL 100.00 100.00 100.00 100.00 100.00
Category of Districts Percent Share in
Total Irrigated Area of Selected Crops
Cereals Pulses
Oil Seeds
Vegetables, Condiments
& Spices
Cotton & Tobacco
Highly Developed 45.31 23.17 34.17 53.68 75.14
Developed 27.06 39.43 39.69 23.28 3.12
Underdeveloped 20.76 10.44 16.64 20.30 13.37
Highly Underdeveloped 6.86 26.95 9.50 2.74 8.36
Category of Districts
Crop Yield (Rs per hectare)
Cereals Pulses
Oil Seeds
Vegetables, Condiments & Spices
Cotton & Tobacco
Highly Developed 44014 36247 44877 104371 26292
Developed 26675 30895 46538 102874 628209
Underdeveloped 21043 23851 37621 102280 204521
Highly Underdeveloped 10663 18403 30400 53856 22528
Source: Author’s Calculation
The group of highly developed districts with 21.10 percent share of total cropped area under Cereals contributes 38.46 percent in value of output though the base group of highly underdeveloped districts with more share altogether cropped area under Cereals (23.88) as was with highly developed district contributes just 9.37 percent share in value of output in 2011-14. There is practically fourfold contrast in crop yield of cereal between highly developed and highly under developed districts. One reason could be that highly developed districts have progressively proportionate share of irrigated area under these crops. Highly developed districts have 45.31 percent share in irrigated area under these crops in while the highly underdeveloped districts have just 6.86 percent of total irrigated area under these crops.
The percentage share of cereal in value of output descends for the districts which come in the class of highly underdeveloped districts. For Barmer it descends from 6.53 percent to 1.26 percent in 2011-14 more than 2000-03 correspondingly for Churu likewise this percentage descend from 11.37 percent to 0.25percent over a similar timeframe.
With little changes the percentage share of cereal in value of output, total cropped area and total irrigated area in triennium 2011-14 was practically same as was in triennium 1990-93
for first group of districts. Then again for developed districts the percentage share of Cereals altogether cropped area and value of output expanded however marginally with sharp decrease in irrigated area from 37.49 percent in triennium 1990-93 to 27.06 percent in triennium 2011-14. For third group of underdeveloped districts the percentage share of cereal crops expanded in value of output, total cropped area and irrigated area. Notwithstanding increment in irrigated area under these crops the percentage share of cereal in value of output and total
cropped area declined for highly
underdeveloped districts. Its share in value of output descends from 13.47 to 9.37 percent. In 2011-14, the percentage share of highly underdeveloped districts altogether cropped area boil down to 23.88 percent from 29.52 percent in triennium 1990-93 with 9.37 percent share in value output. Percentage share of irrigated area under cereal for highly underdeveloped districts expanded from 4.81 percent in triennium 1990-93 to 6.86 percent in triennium 2011-14 for underdeveloped district.
percent in triennium 1990-93 to 13.28 percent in triennium 2011-14.whereas for second quartile districts there was an upward pattern for pulses. For underdeveloped districts inspite of fall altogether irrigated area and marginal increment altogether cropped area under pulses the percentage share of this crop in value of output expanded. There was astounding change in percentage share of irrigated area under pulses for highly underdeveloped districts. It expanded from 2.17 percent in triennium 1990-93 to 26.95 percent in 2011-14. The percentage share of total cropped area under pulses expanded from 23.42 percent in 1990-93 to 38.32 percent in 2011-14 and percentage share of pulses in value of output expanded from 11.68 in 1990-93 to 27.72 in 2011-14. The astonishing observation was that the percent share of pulses – Gram, Tur and Moong altogether cropped area of selected crops expanded from 23.42 percent amid 1990-93 to 25.71 percent amid 2000-03 and further to 38.32 percent amid triennium 2011-14 for highly underdeveloped districts, while their share in value of output diminished from 11.68 percent amid 1990-93 to 4.83 percent amid 2000-03 and expanded to 27.72 percent amid 2011-14. Under pulses group of crops the percentage share in value of output expanded mostly because of increment in production of gram for highly underdeveloped districts.
Astounding the percentage share of oilseeds altogether cropped area, value of output and irrigated area fall for highly developed district while it expanded forcefully for developed districts. Total cropped area under oilseeds tumble from 40.65 percent in 1990-93 to 27.53 percent in 2011-14. Their share in value of output tumbles from 49.35 percent in 1990-93 to 29.11 percent in 2011-14 for highly developed districts. Despite what might be expected for developed districts the percent share altogether
cropped area expanded from 14.51 percent in 1990-93 to 40.51 percent and in value of output it expanded from 13.29 percent to 42.63 percent in 2011-14 notwithstanding fall in percentage share in irrigated area for these crops for developed districts. For underdeveloped districts the percentage share of oilseeds has descended altogether cropped area, irrigated area and value of output. For highly underdeveloped districts there was increment in commitment of these crops altogether cropped area and value of output.
The percentage share vegetable, condiment, spice or high value items in value of output and total cropped area expanded for highly developed districts amid 2011-14 more than 2000-03, though it tumble down for highly underdeveloped districts.
If there should be an occurrence of cotton and tobacco the percentage share altogether cropped area, value of output and total irrigated area for highly developed and developed districts descend while it expanded for underdeveloped and highly underdeveloped districts. Primarily
production of tobacco expanded in
underdeveloped and highly underdeveloped districts.
Crop yield (Rs per hectare) for cereals was very nearly multiple times higher for highly developed districts when contrasted with highly under developed districts in 2011-14.
The major commitment in increment in value of output isn't just productivity yet is crop diversification. The highly developed districts moved towards the production of high value items like vegetable, condiment and spices, while developed districts moved towards the
production of oilseeds and highly
This plainly demonstrates highly developed districts have moved towards high value crops and developed districts have appeared in production of oilseeds amid time span under investigation, though if there should an occurrence of highly underdeveloped districts production of oilseeds, Cereals, cotton was practically dormant. Their share in vegetable, spice and condiment has descended. The highly developed districts demonstrated a decrease in the total cropped area under pulses just as its share in value of output in 2011-14, though percentage share of the equivalent for the highly under developed districts expanded.
4. CONCLUSION
In this section analysis of inter district disparities in agricultural productivity levels based on cropping pattern and utilization of agricultural inputs has been contemplated. In this paper examinations changes in cropping pattern over the study time frame the distinction in productivity levels of highly developed and highly underdeveloped districts has been examined. Rajasthan had about 71.51% of its total reporting area as total cropped area in 2011-12. Regardless of such huge farm area under development, Rajasthan's yield is neither urging nor gainful to the cultivators. Notwithstanding yield growth, another source of agricultural output is growth of cropped area. Despite the fact that cropping pattern is intimately related with levels of development, yet some different components appear to be grinding away for rising inter-district disparities in Rajasthan. Small inter crop variations in yield and high intra crop contrasts in yield crosswise over districts appears to propose that factors other than cropping pattern, as agro-climatic constraints, capacity of farmers to misuse crop and other technology might be grinding away
for watched inter district disparities in agricultural development in Rajasthan.
REFERENCES
[1]. Ahmed, N. and N. Hussain (2013). Identification of Micro Regional Disparities in the Level of Development in the Rural Areas: A Case Study of Malda District of West Bengal (India). International Journal of Management
and Social Sciences Research
(IJMSSR). 2(5), 37-45.
[2]. Dutta, R. (2009). State Budgetary
Resources and Agricultural
Development in Rajasthan. Research Study No. 135, 1-64
[3]. Government of India. (2006). Rajasthan
Development Report. Planning
Commission, New Delhi.
[4]. Government of Rajasthan. (2011-12). Agricultural Statistics Rajasthan, 2011-12, Directorate of Economics and Statistics, Department of Planning, Rajasthan, YojanaBhawan, Jaipur. [5]. Government of Rajasthan. (2014-15).
Agricultural Statistics Rajasthan, 2014-15, Directorate of Economics and Statistics, Department of Planning, Rajasthan, Jaipur.
[6]. Narayanamoorthy, A. , P. Alli and R. Suresh (2014). How Profitable is Cultivation of Rainfed Crops? Some Insights from Cost of Cultivation
Studies. Agricultural Economics
Research Review, 27 (2), 233-241. doi: 10.5958/0974-0279.2014.00027.5 [7]. Norwood,B.,P. Oltenacu, C. Michelles
[8]. Patil, B. (2013). Regional Disparities in Levels of Agricultural Development in Dhule and Nandurbar Districts, India. Research Journal of Agriculture and Forestry Sciences, 1(5), 9-18.
[9]. Raghuvanshi, K., S. Gupta (2015). Regional Variation of Food grains
Productivity in Rajasthan. EPRA
International Journal of Economic and Business Review, 3(3), 133-137.