International Journal of Innovative Computing 6(2) 19-24
International Journal
of
Innovative Computing
Journal Homepage: http://se.fsksm.utm.my/ijic/index.php/ijic
19
Big data Analysis on Multiple Social Network
George W. Kibirige,
Department of Computer Science,
National Chengchi University
Taipei, Taiwan
[email protected]
Abstract —This work analyzed the big data from four social network platforms with the aimed of discovering multiple view of users in social networks. The datasets were collected from Facebook, Twitter, Instagram, and Foursquare. Facebook was primarily used as ground truth. The dataset involved users from London and Singapore region only. Different human pattern behavior was observed and compared based on their gender and age groups. Learning human mobility and creating profile base on their visited locations was another contribution. The user mobility profile created was based on location preferences. The analysis results showed that females and males were leading in check-ins at Malls in Singapore compare to London region.
Keywords — Social Networks, User behavior, User mobility
profile, user check-ins.
I. INTRODUCTION
The statistics shows a lot of people are continuing joining social networks with Facebook leading by having more than 160 million users [6]. Through these social networks it is possible to define human being in different perspectives. For example, Tweeter can be used to show the textual view of the person base on his/her tweets and geographical view can be seen in Fourthsquare. Farseev, Nie, Akbari and Chua [1] defined user profile consist of two things, mobility profile and demographic profile. The mobility profile involved user movement which can be created base on location preference or movement patterns. This study focused on mobility profile
.
The dataset involved users who are living in London region and Singapore. Farseev et al [1] did similar research but his works covered only Singapore region. Qu and Zhang [10] also worked on user location profile based user pattern
to create user mobility profile. User mobility profiles can be used to know what kind of places users like to visit. It can also be applied in identification of business places and urban planning. The combination of user checking with their gender and age can help people to identify popular venues base on gender and age. Through this study, government can decide to build more kindergarten in popular places with young families and build more eating courts around people’s working places.
Also, this study analyzed human behavior in Twitter, Facebook, and Fourthsquare and compared the results between two regions, Singapore and London. The usage of multiple source of information helped in understanding human being properly. [11][12]. The comparison of the analysis between two regions was the main differences with Farseev et al work.
Top 21 popular venue categories were identified and analyzed based on user check-in. The analysis was based on user gender and age. This help to show a clear observation which venues are frequently visited by male compared to female. Also, showed which venues are popular based on the age groups.
The work is organized as follows: The second part covered the related work in this area from different researches; third part covered the data analysis, this part involved all analysis and the visualization; the fourth part covered User mobility profiling and fifth part covered the conclusion and future works.
II. RELATED WORK
Kibirige W.G/ IJIC Vol. 6:2 (2016) 19-24
20
influenced a lot of researchers to collect data from those social network platforms for data exploration, analysis, studies human behavior and learning user mobility pattern
The work [5] studied human behavior in Facebook focused on the multimedia content that shared in Facebook. The researchers grouped users in five clusters base on the common behavior, study them and discovered several patterns of human behavior. Qu and Zhang [10] used user generated information from Fourthsquare for trade analysis. The aim was to identify the activity center for mobile user and profiling user based on their visited place. The check-in analysis was done in four business venues only because of their business objectives. They had a limitation on their dataset which could lead to some bias [10]. Jin, Chen, Wang, Hui, and Vasilakos [6] did a study on user behavior in Online social networks. They explored the connection and interactions of users in social networks platform, identified malicious behavior and mobile social behavior [6]. Farseev et al [1] work is similar to this, focused on Singapore Region only. Aral and Walker [8] developed a tool which can be used to identify the most influential users in social networks.
III. DATA ANALYSIS
The dataset in this study obtained from NUS-MULTI-SOURCE DATASET (NUSMSS). The dataset crawled from 10 July 2014 to 11 December 2015. Farseev et al [1] did similar study focus on Singapore region only. The summary of data is shown in table one.
Figures 1 showed graphs from both London and Singapore skewing on the right side. The analyses showed male are leading on the number of tweets in both London and Singapore users. The analysis also show female check-ins in more venues in Singapore than male while in London male are leading
TABLE 1: Data Summary
City No.User No.Tweets No.Image No.Check-ins
London 5,503 2,973,162 65,088 127,276
Singapore 7,023 11,732,489 366,268 263,530
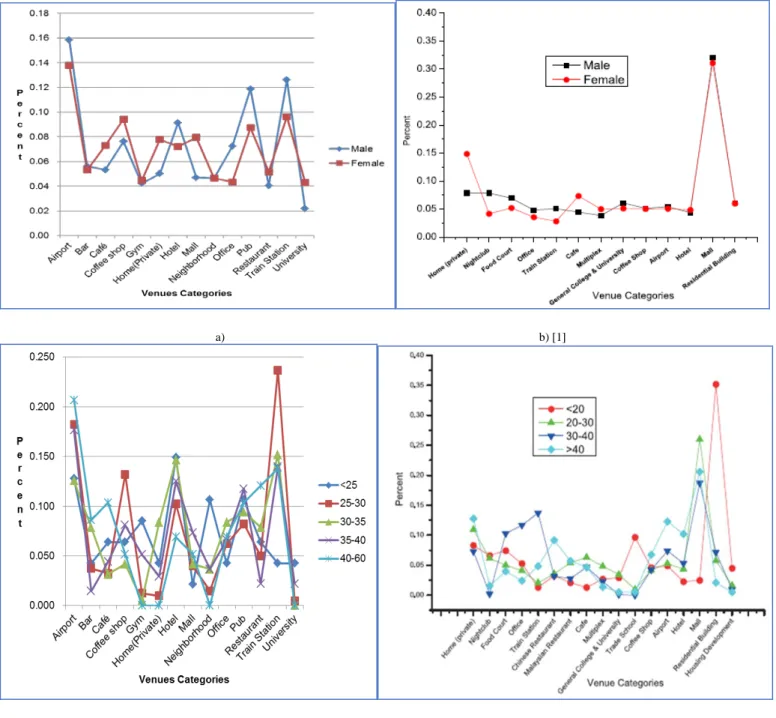
Base on the large number of venues from Fourthsquare, we used the top popular venues to show rate of check-in base on gender and age groups. The age distribution in Facebook for London and Singapore users were different. This made the age group used for analysis to be difference Figure 2 showed female are leading on check-in at home, mall and coffee shop while males are leading in pub, hotel and train stations in London. In Singapore, the females are leading in Mall, and home checkins while male are leading in nightclub and Train station. The difference in number of check-in between Singapore and London depend on the number of users in dataset. Singapore has more users than London dataset, that why they had highest venues check-in. The rate of visit University and Train station was the same
for age group 15-25 but users in age group of 25-30 visited more Train station than University. The people above 40 are leading in visiting home, airport, Chinese and Malaysian restaurant and home. Malaysia restaurant is leading in Singapore because of its closeness with Malaysia country. Furthermore, Singapore has a lot of Singaporean Malay living there. People with the same age in London are leading at restaurant, café and home. Also, highest check-in place in Singapore is Residential Building (age below 20) while London is train station (age between 25-30). This different happened probably of a lot of train station in London compare to Singapore as small country.
IV. USER MOBILITY PROFILE
The data from Fourthsquare used to create user profiling base on the venues that he/she visited. The objective was to create a user profile which can be distinguished with other users’ profile. Normally people count the number of venues a user visited in each category and select categories with highest frequency to represent user mobile profile. The challenge was majority of users visited the same popular places like Mall, Airports and Train stations. This makes difficulty to differentiate those users based on location check-in [10][1]. Other challenges were venues categories from Fourthsquare which more than 500(in London 588) that makes difficulty for visualization of user profile.
Farseev et al [1] used Latent Dirichlet Allocation (LDA) as solution to those challenges and create user mobility profile with six check-in categories [10]. The LDA is the methods which used to model a document. It takes two input variables, document and word and produces few topics which represent a group of words from the document [3]. In this study users are considered as document and venues category act as word. The number topic (k) should be specified at the beginning, in this study we select six as number of topic. The value of k obtained base on six samples from dataset. Normally value of k obtains after testing different values k and picks the one with optimum performance. Sometimes those calculations will not produce the right value of “k”
Figures 1(b), 1(d) and 1(f) refer to the paper published by Farseev et al [1]. 21
(a) (b)[1]
(c) (d)[1]
(e) (f)[1]
Kibirige W.G/ IJIC Vol. 6:2 (2016) 19-24
Figures 2(b) and 2(d) refer to the paper published by Farseev et al [1]. 22
a)
b) [1]
c) d) [1]
Figure 2. Comparison between London and Singapore dataset on distribution of popular venues, (a) and (b) showed the venues distribution with respect to gender from London and Singapore dataset respectively, (c) and (d) show the venues distribution with that corresponding with age groups
Table 2: Show Top Six Venue Categories of each Topics
Topic 1 Topic 2 Topic 3 Topic 4 Topic 5 Topic 6
Airport Pub Home Train Station Mall Cafe
Hotel Gym Neighborhood Office Coffee Shop Movie Theater
Airport Terminal Gym City Metro Station Cafe Restaurant
Airport Lounge Soccer Stadium Plaza Supermarket University Coffee Shop
Co-working Space Nightclub Residential Building
(Apartment / Condo)
Coffee Shop Burger Joint Gym / Fitness Center
Figure 3(b) refer to the paper published by Farseev et al [1]. 23 Figure 3 (a) and (b) showed three users from London and Singapore dataset. User one is considered in the group of Socialites and user 2 and 3 are Teenagers or Youth from London dataset. Figure 3(b) show user one is Teenagers and user 2 and 3 are Professional and Shoppers.
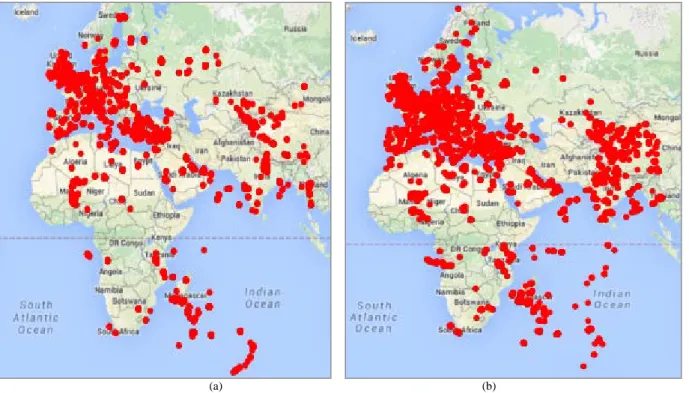
Figure 4(a) and (b) show the terrain visualization of check-in of female and male users from London dataset.
a) b) [1]
Figure 3: The user mobility statistics for London and Singapore dataset: (a) and (b) shows a location-based user mobility profile for three users for both London and Singapore.
(a)
(b)
Kibirige W.G/ IJIC Vol. 6:2 (2016) 19-24
24
V. CONCLUSIONS AND FUTURE WORK
This paper analyzed human behavior by explore the dataset from Twitter, Instagram, Fourthsquare and Facebook dataset. Facebook dataset used as ground truth of user information. In this study, we compared the data analysis result of two regions London and Singapore. The results show the similarities and preference of users of those two regions. The results from two regions both shows male are leading in check-in home and mall. Future works should focus on creating a complete user profile by include demography profile.
ACKNOWLEDGMENTS
This research used the dataset from Multi-Source Social Dataset from National University of Singapore (NUS-MSS) with help from Alex. Farseev
.
REFERENCES
[1] A. Farseev, L. Nie, M. Akbari, and T. S. Chua. "Harvesting multiple sources for user profile learning: a big data study." In Proceedings of the 5th ACM on International Conference on Multimedia Retrieval, pp. 235-242. ACM, 2015.
[2] C. Wilson, B. Boe, A. Sala, K.P. Puttaswamy, and B.Y. Zhao. "User interactions in social networks and their implications." In Proceedings of the 4th ACM European conference on Computer systems, pp. 205-218. Acm, 2009.
[3] D. M. Blei, A. Y. Ng, and M. I. Jordan. Latent dirichlet allocation. “Journal of Machine Learning Research,” 3, 993-1022. 2003.
[4] E. Cho, S. A. Myers, and J. Leskovec. "Friendship and mobility: user movement in location-based social networks." In Proceedings of the 17th ACM SIGKDD international conference on Knowledge discovery and data mining, pp. 1082-1090. ACM, 2011.
[5] F. T. O'Donovan, C. Fournelle, S. Gaffigan, O. Brdiczka, J. Shen, J. Liu, and K. E. Moore. "Characterizing user behavior and information propagation on a social multimedia network." In Multimedia and Expo Workshops (ICMEW), 2013 IEEE International Conference on, pp. 1-6. IEEE, 2013.
[6] L. Jin, Y. Chen, T. Wang, P. Hui, and A. V. Vasilakos. "Understanding user behavior in online social networks: A survey." Communications Magazine, IEEE 51, no. 9: 144-150. 2013
[7] P. Wang, W. He, and J. Zhao. “A tale of three social networks: User activity comparisons among Facebook, twitter, and foursquare”. 2014.
[8] S. Aral, and D. Walker. "Identifying influential and susceptible members of social networks." Science 337, no. 6092: 337-341. 2012
[9] X. Wang, Y.-L. Zhao, L. Nie, Y. Gao, W. Nie, Z.-J. Zha, and T.-S. Chua. “Semantic-based location recommendation with multimodal venue semantics”. IEEE Transactions on Multimedia, 2015.
[10]Y. Qu and J. Zhang. “Trade area analysis using user generated mobile location data”. In Proceedings of the International Conference on World Wide Web, 2013.
[11]P. Wang, W. He, and J. Zhao. A tale of three social networks: User activity comparisons among Facebook, twitter, and foursquare. 2014.
[12]X. Wang, Y.-L. Zhao, L. Nie, Y. Gao, W. Nie, Z.-J. Zha, and T.-S. Chua. Semantic-based location recommendation with multimodal venue semantics. IEEE Transactions on