Sharif University of Technology
Scientia IranicaTransactions A: Civil Engineering www.scientiairanica.com
Static analysis of interaction between twin-tunnels
using Discrete Element Method (DEM)
M. Oliaei
and E. Mana
Department of Civil Engineering, Tarbiat Modares University, Tehran, Iran.
Received 19 February 2013; received in revised form 29 September 2014; accepted 30 May 2015
KEYWORDS Twin-tunnels; DEM; FEM; PFC2D;
PLAXIS2D;
Static analysis.
Abstract.The development of transportation in large cities requires the construction of twin-tunnels or the construction of new tunnels close to the existing ones. Since both the relative position of tunnels and the construction procedure aect the soil movement, this paper presents analysis of this issue with a particular interest for the optimization of both the relative position of the twin-tunnels and the construction procedure. Since the soil is composed of discrete particles with dierent sizes, modeling using nite element methods based on the mechanics of a continuous medium is not completely consistent with reality (especially, modeling of conning eect with depth). Therefore, in this study, discrete element method is used to model the discontinuum nature of soils. For these concerns, using software PFC2Dbased on Discrete Element Method (DEM), the static analysis of circular
twin-tunnels has been performed, and inuence of the two factors on the soil settlement resulting from the tunnel construction has been investigated. Analyses were conducted for three congurations of the twin-tunnels: aligned-horizontally, vertically, and inclined. The results are compared with the FEM results. The comparison shows inuence of modeling the discontinuous nature of coarse-grain alluvial soils with respect to continuous media modeling.
© 2015 Sharif University of Technology. All rights reserved.
1. Introduction
The development of large cities requires utilizing un-derground area for the construction of transportation infrastructures and facilities. In some cities, the underground and geotechnical conditions impose the construction of new tunnels close to existing ones. In other cases, the solution of twin-tunnels presents major advantages, such as the reduction of the both tunnels diameters and the soil movement resulting from the tunnel construction. Both numerical modeling and in-situ observations were used to analyze the interaction between twin-tunnels [1]. Results show *. Corresponding author. Tel.: +98 21 82884395;
Fax: +98 21 82884914
E-mail address: [email protected] (M. Oliaei)
that in some congurations, the interaction could largely aect the soil settlement and the design of twin-tunnels requires numerical analyses associated to monitoring during the tunnel construction [1-16]. This paper presents analysis of the interaction between twin-tunnels with a particular interest for the optimization of both the relative position of the twin-tunnels and the construction procedure using the discrete element code, PFC2D, and the results will be compared with the FEM results of PLAXIS2D. The Discrete Element Method is selected for modeling of discontinuous nature of coarse-grain alluvial soils. Parametric study anal-yses were conducted for three congurations of twin-tunnels: aligned-horizontally, vertically, and inclined, to investigate their inuence on the soil settlement resulting from the tunnel construction.
the Discrete Element Method (DEM) is described. In Section 3, numerical modeling parameters are obtained by the calibration of triaxial tests. Numerical results are presented in Section 4. Conclusions are given in the last section.
2. Discrete element method
The DEM was introduced by Cundall (1971) for the analysis of rock-mechanics problems [17], and then ap-plied to soils by Cundall and Strack (1979) [18]. PFC2D is classied as a discrete element code since it allows nite displacements and rotations of discrete bodies, including complete detachment, and recognizes new contacts automatically as the calculation progresses. The code can be viewed as a simplied implementation of the DEM because of the restriction to rigid circular particles [19].
The calculations performed in the DEM alternate between the application of Newton's second law to the particles and a force-displacement law at the contacts. Newton's second law is used to determine the motion of each particle arising from the contact and body forces acting upon it, while the force-displacement law is used to update the contact forces arising from the relative motion at each contact [18]. The presence of walls in the code requires only that the force-displacement law accounts for ball-wall contacts. Newton's second law is not applied to walls, since the wall motion is specied by the user [19].
When two particles collide, they actually deform. The overlap displacement is assumed as deformation in the DEM as shown in Figure 1(a). Then, the DEM contact is composed of a spring, a dash-pot, and a friction slider as shown in Figure 1(b) [20].
The calculation cycle in the code is an explicit time stepping algorithm that consists of the repeated application of the law of motion to each particle, a force-displacement law to each contact, and a constant updating of wall positions. Contacts, which may exist between two balls or between a ball and a wall, are formed and broken automatically during the course of
Figure 1. Contact force model [20].
Figure 2. Calculation cycle in PFC2D[19].
a simulation. The calculation cycle is illustrated in Figure 2 [19].
3. Numerical modeling
PFC2D is a distinct element computer program de-signed to simulate the mechanical behavior of bonded or unbounded granular materials. The soil material is modeled as a collection of circular particles that can interact through normal and shear springs. Under the applied load, the bonds between particles can break and a small \crack" can form [19].
Although the code can simulate a particulate media, any circular element in this program does not necessarily model a particle in the real material as the two-dimensional nature of the program limits particles to disks or cylinders. Hence, the code can be considered as an attempt to mimic the basic mechanical features of the actual material. Therefore, it is not possible to use the geotechnical parameters directly in PFC2D, and it is necessary to obtain the numerical modeling parameters using calibration of real triaxial tests. Followed in Sections 3.1 through 3.5, the most important specic aspects which have been considered in modeling using the code are given.
3.1. Particle generation
The particle radii were chosen to have a relatively uniform distribution in the sample. Particle in the code does not need to correspond to a real grain in the actual material [21]. In PFC2D, particles are created at their nal radii in sucient numbers to achieve the desired porosity for the production of the real in-situ stresses. In this paper, the minimum radius of the particle assembly is Rmin = 5 cm and Rmax=Rmin = 3 [21]. They are placed at random positions in the given area, which leads to some large overlaps and correspondingly large forces. Then, the resulting large initial velocities may be sucient to allow some particles to escape through the conning walls. To prevent this, the kinetic energy is reduced to zero several times during the rst few cycles; then, convergence to equilibrium proceeds normally [19].
3.2. Boundary and initial conditions (initial stresses)
The soil layer is underlined at the depth of H = 60 m. The lateral extension of the soil mass is equal to 100 m. The extension ensures the absence of boundary eect on the numerical modeling of the tunnel construction. The number of particles in the domain is approximately 70000.
Normally, a particle assembly is created and compacted within a set of conning walls. These walls can continue to act as boundary constraints. The initial conditions in a granular assembly are partly inherited from the generation and compaction phases. The concept of stress in a discontinuous medium is dierent from that in a continuous. There is no meaning to the term \stress at a point", because forces may uctuate wildly from point to point. An estimate of stress is only possible over a nite volume of space. A numerical servo-mechanism is applied iteratively to arrive at the radius expansion necessary to achieve the required mean stress [19]. There are various methods for achieving a desired initial stress state. Parameters such as density, porosity, and stiness coecients aect the initial stress, so if it turns out changes in parameters, it bring about changes in stress [19]. To obtain desired stress, the model is divided into six layers with 10 meters thicknesses (Figure 3), which in each layer, porosity, stiness coecients, and friction coecient are xed, and density and bond coecients are dierent. Each layer is calibrated separately. 3.3. Determination of micro-parameters
(calibration)
The overall constitutive behavior of a material is simulated in PFC2Dby associating a constitutive model with each contact. The constitutive model acting at a particular contact consists of three parts: A stiness model, a slip model, and a bonding model. The stiness model provides an elastic relation between the contact force and relative displacement. The slip model enforces a relation between shear and normal contact forces such that the two contacting balls may slip relative to one another. The bonding model serves to
Figure 3. Conguration of particles for initial conditions (in-situ stresses).
limit the total normal and shear forces that the contact can carry by enforcing bond-strength limits. The two basic bonding models supported in the code are: A contact-bond model and a parallel-bond model. Both bonds can be envisioned as a kind of glue joining the two particles. The contact-bond glue is of a vanishingly small size that acts only at the contact point, while the parallel-bond glue is of a nite size that acts over either a circular or rectangular cross section lying between the particles. The contact-bond can only transmit a force, while the parallel-bond can transmit both a force and a moment. The contact-bond and parallel-bond can be viewed as cohesion for soils and rocks, respectively. Hence, in this research, the contact-bond model is used. Constitutive behavior for contact occurring at a point is shown in Figure 4 regarding contact-bond model [19]. Keeping constant values of stiness and friction coecients, PFC2D's input parameters including bond coecients, vary until the behavior of the numerical sample matches that of the physical sample. In PFC2D, a biaxial test by conning a rectangular sample (comprised of a compacted particle assembly) within four walls is simulated. The top and bottom walls simulate loading platens, and the left and right walls simulate the connement experienced by the sample sides. The sample is loaded in a strain-controlled mode by specifying the velocities of the top and bottom walls. The stresses and strains experienced by the sample are determined in a macro-mode by summing the forces acting upon, and relative distance between the appropriate walls. Material response is evaluated by tracking the various stress and strain quantities. Axial deviatoric stress versus axial strain for biaxial test on bonded granular material was drawn for each layer, and then Mohr's circle was drawn to reach failure envelope of laboratory. Table 1 summarizes the properties of the alluvial soil of Tehran city used in this study [22]. The determined micro-parameters (getting from calibration) are listed in Table 2 based on strength and stiness criteria.
3.4. Verication
In order to validate the accuracy of calibration method for determination of micro-parameters, the verication based on eld case study [23] is presented in the Appendix.
3.5. Tunnel modeling
The soil behavior is described using an elastic perfectly plastic constitutive model based on the non-associated Mohr-Coulomb criterion. The water table is considered
Table 1. Mechanical parameters of Tehran alluvium [22]. unsat
(kN/m3)
sat
(kN/m3)
E (kg/cm2) v
C (kg/cm2)
' (degree)
Figure 4. Constitutive behavior for the contact occurring at a point regarding contact-bond model [19]. Table 2. Determined micro-parameters in PFC2D(getting from calibration).
kn
(N/m) ks
(N/m)
n-bond (N/m)
s-bond
(N/m) Friction Porosity (kg/m3)
Layer 1 2e8 1e8 0.45e6 0.45e6 0.1 0.14 2650
Layer 2 2e8 1e8 0.42e6 0.39e6 0.1 0.14 2500
Layer 3 2e8 1e8 0.28e6 0.27e6 0.1 0.14 2450
Layer 4 2e8 1e8 0.24e6 0.22e6 0.1 0.14 2400
Layer 5 2e8 1e8 0.14e6 0.14e6 0.1 0.15 2400
Layer 6 2e8 1e8 0.04e6 0.04e6 0.1 0.15 2300
in the bottom of the model at depth of 60 m, and the inuence of surface structures in comparison to tunnel overburden is negligible. It is dened a range iden-tifying the space to be excavated for the tunnel, and another identifying the space which will be occupied by the lining. The particles of the domain will be used for modeling of lining by changing particles properties in the lining range. The thickness of the lining is equal to 0.5 m. Figure 5 shows the model used for the analysis of horizontally aligned tunnels with a spacing ratio of
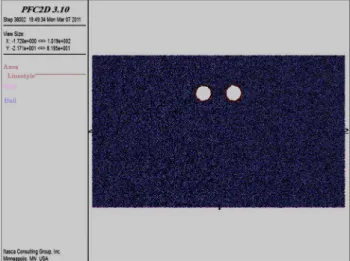
Figure 5. Model used in the analysis of twin-tunnels with horizontal alignment.
dx=D = 2 in PFC2D(D and dx denote the tunnel diam-eter and the distance between tunnel axes, respectively. In this paper, the selected tunnel diameter equals to 6 m.) The determined micro-parameters of lining based on the guidelines are listed in Table 3.
4. Numerical results
Analyses are conducted for three congurations of the twin-tunnels: aligned-horizontally, vertically, and inclined (Figure 6, Table 4). The DEM results will be compared by the FEM results. The DEM and FEM models have the same dimensions. The soil behavior
Table 3. Lining parameters in PFC2D.
kn
(N/m) ks
(N/m)
n-bond (N/m)
s-bond
(N/m) Friction (kg/m3)
2e10 2e10 1e15 1e15 0.1 2400
Table 4. Congurations of interaction analysis between twin-tunnels.
Conguration dx=D dy=D
Horizontal alignment 1.5, 2, 2.5, 3 0
Vertical alignment 0 2
Inclined alignment 2, 2.5 2 D = 6 m
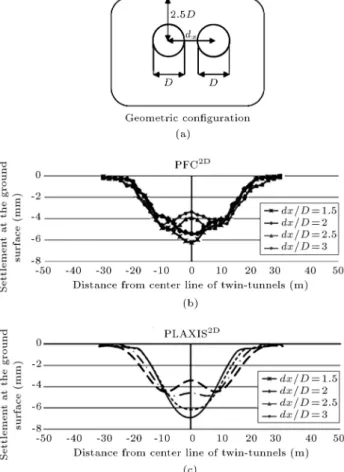
Figure 6. Congurations considered in the analysis of the interaction between twin-tunnels.
Figure 7. Tunnels with horizontal alignment: Surface settlement induced by the construction of the
twin-tunnels.
is described using Mohr-Coulomb criterion and the behavior of lining is considered elastic in FEM. In the FEM model, using an automatic mesh generation, 15-node triangular elements are used.
4.1. Twin-tunnels with horizontal alignment Analyses were conducted for four values of the tunnel spacing ratio dx=D (1.5, 2, 2.5 and 3) as shown in Figure 7(a). Figure 7(b) and (c) show the surface
Figure 8. Variation of surface settlement at the central part of the twin-tunnels (horizontal alignment) with respect to distance between tunnels.
settlement pattern at the end of the construction of the second tunnel obtained from PFC2Dand PLAXIS2D. It shows that both the settlement pattern and amplitude depend on the distance between tunnels. The maxi-mum soil settlement is observed for the conguration of close tunnels (dx=D = 1:5) for both the DEM and FEM, but the results obtained from DEM analysis are lower than FEM analysis (about 10%). The maximum surface settlement for dx=D = 1:5 is induced between the two tunnels.
Increasing the distance between tunnels induces decreasing the settlement in the central part of the twin-tunnels and leads to changing of settlement pat-tern (it happens in dx=D = 2 2:5). Increasing dx causes changing the location of maximum surface settlement from central part of twin-tunnels to the center line of each tunnel. However, the disturbed surface area will be increased.
Figure 8 shows the rate of decreasing the settle-ment at the central part of the twin-tunnels on the ground surface versus increasing the distance between tunnels. It is seen that the rate of variation is approximately linear.
4.2. Twin-tunnels with vertical alignment Figure 9(a) shows the tunnel conguration considered in this section. Two types of analyses were carried out with PFC2D and PLAXIS2D. In the rst one, the upper tunnel is constructed at rst (Case A), while in the second analysis, the lower tunnel is constructed rst (Case B).
Figure 9(b) illustrates the inuence of the con-struction procedure on the soil settlement. It shows that the construction of the upper tunnel at rst leads to higher maximum settlement compared to that obtained by the construction of the lower tunnel at rst (about 10%). However, it is limited to a central area between twin-tunnels, and for other locations it is reversely. It is seen again that results obtained from DEM analysis are lower than FEM analysis (about 20%). Based on the DEM results, in Case A, when the second tunnel is excavated, the maximum surface
Figure 9. Tunnels with vertical alignment: Surface settlement induced by the construction of the twin-tunnels.
settlement is increased 160 percent while in Case B, it is increased 250 percent.
Comparison of surface settlements for tunnels with horizontal and vertical alignment shows the set-tlements for vertical twin-tunnels are higher and they are more critical.
4.3. Twin-tunnels with inclined alignment Two congurations were analyzed (Figure 10(a)). The vertical distance between the tunnel axes is equal to dy=D = 2. In the rst conguration, the horizontal distance between the tunnel axes is equal to dx=D = 2 ( = 45); in the second conguration dx=D = 2:5 ( = 39). Figure 10(b) and (c) show the inuence of both the tunnel conguration and construction procedure on the soil settlement. It can be observed that the construc-tion of the upper tunnel at rst (Case A) leads to higher maximum settlement than that induced when the lower tunnel is rst constructed (Case B). This result is similar to that obtained for vertical aligned tunnels. Generally, the maximum displacement transmitted to the side of the rst tunnel is constructed. Based on the DEM results, when the second tunnel is excavated, the maximum surface settlement is increased 130 percent for Case A when = 45, 110 percent for Case A when = 39, 225 percent for Case B when = 45, and 200 percent for Case B when = 39.
Figure 11 shows maximum settlement at the soil surface with respect to variation of and construction process. It is seen that for > 45, inclined tunnels behave similar to vertical tunnels.
Figure 10. Tunnels with inclined alignment: Surface settlement induced by the construction of the twin-tunnels.
Figure 11. Variation of the maximum surface settlement vs. .
4.4. Restriction
The main concern of DEM modeling is run-times of analyses. For the selected numbers of discs and elements in this paper, the DEM analyses take time approximately 15 times more than FEM analyses (ig-noring the time for calibration in DEM). By increasing the numbers of discs and elements, the dierence of run-times will be increased.
5. Conclusions
This paper included DEM analysis of the construction of twin-tunnels with a particular focus on the inuence of both the construction procedure and geometric conguration on the soil settlement, compared with results of FEM analysis.
Based on the analyses results and ndings, com-plicated DEM shows advantages and disadvantages with respect to conventional FEM:
The main advantages of DEM are modeling the discontiguous nature of soils (more consistent with re-ality), prevention of surface swelling during unloading in shallow tunnels, more accurate modeling of conning eect with depth (overburden or surcharge eect) and capability of modeling weak bond connections of particles (tensile and shear) in shallow layers.
However, the main disadvantages of DEM are higher computational eort and also need for deter-mination of micro-parameters based on calibration.
Both DEM and FEM comparative analysis show that construction procedure aects the soil settlement while results obtained from DEM analysis are lower than FEM. This is due to conning eect. The construction of the upper tunnel at rst leads to higher maximum settlement, compared to that obtained by the construction of the lower tunnel at rst.
The highest surface settlement is obtained for vertical aligned tunnels, while horizontal aligned tun-nels cause the lowest settlement. The maximum displacement for inclined aligned tunnels transmitted to the side of the rst tunnel is constructed. For this type of tunnels, the inclination angle greater than 45 will cause inclined tunnels behave similar to vertical tunnels.
For twtunnels with horizontal alignment, in-creasing the distance between tunnels induces decreas-ing the settlement in the central part of the twin-tunnels and leads to changing of settlement pattern (it happens in dx=D = 2 2:5). Increasing dx causes the location of maximum surface settlement, from central part of twin-tunnels to the center line of each tunnel, to be changed. However, the disturbed surface area will be increased.
Partially nonsymmetrical settlement pattern in DEM analysis compared to FEM is another dierence between two models. The mentioned dierence is due to partially nonequivalent stresses in the dened depth that is more similar to real behavior of soil.
References
1. Hage Chehade, F. and Shahrour, I. \Numerical analy-sis of the interaction between twin-tunnels: Inuence of the relative position and construction procedure", Tunnelling and Underground Space Technology, 23(2), pp. 210-214 (2008).
2. Ghaboussi, J. and Ranken, R.E. \Interaction be-tween two parallel tunnels", International Journal for Numerical and Analytical Methods in Geomechanics, 1(1), pp. 75-103 (1977).
3. Kawata, T. and Ohtsuka, M. \Observational construc-tion of large scaled twin road tunnels with minimum interval", In: Reith, J.L. (Ed.), Infrastructures Souter-raines de Transports., Balkema, Rotterdam (1993). 4. Soliman, E., Duddeck, H. and Ahrens, H. \Two and
three-dimensional analysis of closely spaced double-tube tunnels", Tunnelling Underground Space Technol-ogy, 8(1), pp. 13-18 (1993).
5. Perri, G. \Analysis of the eects of the new twin-tunnels excavation very close to a big diameter tunnel of Caracas Subway", In: Salam, Abdel (Ed.), Tun-nelling and Ground Conditions, Balkema, Rotterdam, pp. 523-530 (1994).
6. Saitoh, A., Gomi, K. and Shiraishi, T. \Inuence forecast and eld measurement of a tunnel excavation crossing right above existing tunnels", In: Salam, Abdel (Ed.), Tunnelling and Ground Conditions, Balkema, Rotterdam, pp. 83-90 (1994).
7. Shahrour, I. and Mroueh, H. \Three-dimensional nonlinear analysis of a closely twin tunnels", In: Sixth International Symposium on Numerical Models in Geomechanics (NUMOG VI), 2, Montreal, Quebec, Canada, pp. 481-487 (1997).
8. Yamaguchi, I., Yamazaki, I. and Kiritani, K. \Study of ground-tunnel interactions of four shield tunnels driven in close proximity, in relation to design and constructions of parallel shield tunnels", Tunnelling Underground Space Technology, 13(3), pp. 289-304 (1998).
9. Addenbrooke, T. and Potts, D. \Twin tunnel interac-tion: Surface and subsurface eects", Int. J. Geomech., 1(2), pp. 249-271 ( 2001).
10. Chapman, D.N., Rogers. C.D.F. and Hunt, D.V.L. \Predicting the settlements above twin tunnels con-structed in soft ground", Tunnelling and Underground Space Technology, 19(4-5), p. 378 (2004).
11. Afpour, M., Sharifzadeh, M., Shahriar, K. and Jamshidi, H. \Interaction of twin tunnels and shallow foundation at Zand underpass, Shiraz metro, Iran", Tunnelling and Underground Space Technology, 26(2), pp. 356-363 (2011).
12. Chakeri, H., Hasanpour, R., Mehmet, A.H. and Bahti-yar, U. \Analysis of interaction between tunnels in soft ground by 3D numerical modeling", Bulletin of Engineering Geology and the Environment, 70(3), pp. 439-448 (2011).
13. Chakeri, H., Hasanpour, R., Mehmet, A.H. and Bahti-yar, U. \Stability of long unsupported twin circular tunnels in soils", Tunnelling and Underground Space Technology, 26, pp. 326-335 (2013).
14. Mirhabibi, A. and Soroush, A. \Eects of building three-dimensional modeling type on twin
tunneling-induced ground settlement", Tunnelling and Under-ground Space Technology, 38, pp. 224-234 (2013). 15. Talebnejad, A., Chakeri, H., Moosavi, M., Ozcelik,
Y., Bahtiyar, U. and Mehmet, A.H. \Investigation of surface and subsurface displacements due to multiple tunnels excavation in urban area", Arabian Journal of Geosciences, 7(9), pp. 3913-3923 (Sept. 2014). 16. Zhang, Z. and Huang, M. \Geotechnical inuence on
existing subway tunnels induced by multiline tunneling in Shanghai soft soil", Computers and Geotechnics, 56, pp. 121-132 (2014).
17. Cundall, P.A. \A computer model for simulating progressive large scale movements in blocky rock sys-tems", Proceedings of the Symposium of the Interna-tional Society of Rock Mechanics, Nancy, France, 1, Paper No. II-8 (1971).
18. Cundall, P.A. and Strack, O.D.L. \A discrete nu-merical model for granular assembles", Geotechnique, 29(1), pp. 47-65 (1979).
19. Itasca Consulting Group, Inc. PFC2D (Particle Flow
Code in 2 dimensions), Version 3.
20. Kanou, S., Amano, M., Terasaka, Y., Matsumoto, N. and Wada, T., Terra-Mechanical Simulation Us-ing Distinct Element Method, KOMAT'SO technical report, pp. 13-14 (2003).
21. Fakhimi, A., Carvalho, T. and Labuz, J.F. \Simulation of failure around a circular opening in rock", Interna-tional Journal of Rock Mechanics & Mining Sciences, 39, pp. 507-515 (2002).
22. Geological and Geotechnical Report of Sadr-Nyayesh Tunnel, Pazhouhesh Omran Rahvar Consultant Engi-neers (2010).
23. Guglielmetti, V., Grasso, P., Mahtab, A. and Xu, S., Mechanized Tunnelling in Urban Areas: De-sign Methodology and Construction Control, Geodata S.P.A., Turin, Italy, pp. 312-322 (2007).
Appendix
In order to validate the DEM results, a comparison between the numerical results (obtained in this study)
Figure A.1. The comparison of ground surface settlement proles obtained from numerical, analytical and eld meth-ods.
and analytical and eld monitoring [22] is presented in Figure A.1. The eld case study has been selected for single tunnel of Porto subway in Portugal to validate the accuracy of calibration method.
The maximum surface settlement obtained from numerical analysis is 1.02 cm and 1.09 for eld moni-toring. There is a very good agreement between DEM and eld results.
Biographies
Mohammad Oliaei is Assistant Professor of Civil Engineering. He joined the Geotechnical Group at the Department of Civil Engineering, Tarbiat Modares University, since 2008. He received his PhD degree from Sharif University of Technology (2007) as rst rank student. In 2005, he was awarded a scholarship from British Council to continue his PhD study at Cambridge University. He specializes in the area of Geotechnical Engineering and Numerical Modelling (especially Meshless and DEM, the objective of this manuscript). He is the reviewer of several ISI papers in Scientic & Technical Journals.
Ehsan Mana received his MSc degree in Geotech-nical Engineering at the Department of Civil Engi-neering, from Tarbiat Modares University (2012). He specializes in the area of Numerical Modelling by Discrete Element Method.
![Figure 1. Contact force model [20].](https://thumb-us.123doks.com/thumbv2/123dok_us/8384335.2227678/2.892.490.808.153.336/figure-contact-force-model.webp)