PAH IN THE AHES ASSAY: IDENTIFICATION OF METABOLITES OF BENZCJ3ACEANTHRYLEHE AND CYCLOPENTAFUSED BENZOCelPYRENE
by
Karyn O. Newcomb
(Under the direction of Dr. L. H. Ball)
ABSTRACT
To determine the contribution of the dlol-epoxlde to the genotoxlclty of benzCjlaceanthrylene (BJAA), the mutagenic activity of BjAA and Its bay-region metabolites were evaluated In the Ames assay. BjAA, the 9,10-oxlde, and the 9,lO-dlhydrodlol are Indirect acting mutagens with specific activities of 12.9 rev/nmole, 5.6 rev/nmol, and 9.4 rev/nmole, respectively. The 9,10-dlhydrodlol-7,8-oxlde was direct acting having the same activity as the parent
compound, BjAA.
Metabolism studies using Aroclor 1254 Induced rat liver
S9 were conducted on the BjAA-9,10-dlhydrodiol metabolite.
Four metabolites were Isolated. Three metabolites were
Identified as
1,2,9,10-tetrahydro-l,2,9,10-tetrahydroxy-BjAA, 7, 8, 9,10-tetrahydro-7,8,9,10-tetrahydroxy-BJAA and the 9,10-dlhydroxy-BjAA. The fourth metabolite was tentatively
Identified as BJAA-9,10-dlhydrodlol-2-one.
Similarly, the metabolism of cyclopentafused benzoCelpyrene (cpBeP) was also Investigated to determine whether the previously observed mutagenic activity of this
compound was due to metabolism at the bay-region or the
3,4-dlhydrodlol cpBeP. Additional minor metabolites vere Isolated, but not enough material was available to Identify
them.
Oxidation occurs at the cyclopentafused ring for both
BjAA and cpBeP when Incubated with rat liver 59. This structure Is of Importance when considering mutagenic activation of a compound, and Is an exception to the
I. INTRODUCTION... 1
II. BACKGROUND... 6
A. Environmental Sources... 6
B. Carcinogenicity... 7
C. Structure-Activity Relationships... 9
C. 1 K-Region Theory... 9
C. 2 Bay-Region Theory... 10
C. 3 Di-Region Theory... 14
D. Cytochrome P-450... 15
E. PAH Metabolism... 20
E. 1 Benz C a ] pyrene... 24
E. 2 Benzo[elpyrene... 27
E. 3 CyclopentaCc, d3 pyrene... 30
E. 4 Benz E a ]anthracene... 31
E.5 Methylcholanthrene and Methylcholanthrylene 33 F. Analytical... 35
F. 1 Ames Mutagenicity Assay... 35
F.2 High Pressure Liquid Chromatography... 40
F. 3 Mass Spectrometry... 41
F.4 Nuclear Magnetic Resonance Spectrometry... 43
III. EXPERIMENTAL... 46
A. Materials... 46
B. Methods... 48
B. 1 Ames Mutagenicity Assay Procedure... 48
B. 2 Metabolite Generation Procedure... 50
B.3 High Pressure Liquid Chromatography... 52
B. 4 Mass Spectrometry... 53
B.5 Nuclear Magnetic Resonance Spectrometry... 55
IV. RESULTS... 56
A. Mutagenicity of Benztjlaceanthrylene Metabolites... 56
B. Metabolism of BenztJlaceanthrylene-9,10-dihydrodiol... 59
V. DISCUSSION... 94 A. Mutagenicity of BenzCjlaceanthrylene
Metabolites... 95
B. Metabolism of
BenzEjlaceanthrylene-9, 10-dihydrodiol... 97
C. Mutagenicity of Cyclopentafused BenzoCe1pyrene 99 D. Metabolism of Cyclopentafused BenzoCelpyrene.. 102
E. Recommendations... 104
E.1 BenzC3 3aceanthrylene-9,10-dihydrodiol... . 104 E. 2 Cyclopentafused BenzoEelpyrene... 104
1. Structures of veil known PAHs... 2
2. Compounds under study, benzCjlaceanthrylene and cyclopentafused benzoCelpyrene... 4
3. Important regions in structure-activity relationships 11 4. Regions considered in the Di-region theory... 16
5. Cytochrome P-450 reactions... 18
6. Possible metabolic pathways of arene oxides... 22
7. Benzo[a]pyrene metabolism... 25
8. Benzo[e3pyrene metabolism... 28
9. 3-Hethylcholanthrylene metabolism... 36
10. Dose-response curve of benz[Jlaceanthrylene and metabolites without S9 in the Ames assay... 57
11. Dose-response curve of benzCjlaceanthrylene and metabolites with S9 in the Ames assay... 58
12. HPLC profile of control incubation for benzC J ]aceanthrylene-9, 10-dihydrodiol... 63
13. HPLC profile for benztj3aceanthrylene-9, 10-dihydrodiol incubation... 64
14. UV spectra of benzCJ3aceanthrylene-9,10-dihydrodiol metabolites... 65
15. Mass spectrum of benzCjlaceanthrylene-9, 10-dihydrodiol... 66
16. Mass spectrum of 1, 2,9,10-tetrahydro-l,2,9,10-tetrahydroxy-benztj]aceanthrylene (peak 3B)... 69
17. HMR spectrum of 1,2,9,10-tetrahydro-l,2,9,10-tetrahydroxy-benz[jlaceanthrylene <peak 3B)... 70
18. Mass spectrum of 7, 8,9, 10-tetrahydro-7,8,3,10-tetrahydroxy-benztJlaceanthrylene (peak 4A)... 72
ͣ
'T9?».«8Si8S!r>Pnrr"--.i>.!«. •"ͣ
20. Mass spectrum of
benztj]aceanthrylene-9,10-dlhydrodiol-2-one (peak S)... 74 21. NMR spectrum of
benzCj]aceanthrylene-9,10-dihydrodiol-2-one (peak 5)... 75 22. Mass spectrum of benzCj]aceanthrylene-9,10-dlol
( peak 7 )... 77
23. HMR spectrum of benzCj]aceanthrylene-9, 10-diol
( peak 7 )... 79
24. HPLC profile of benzCJ]aceanthrylene-9, 10-dihydrodiol
incubation optimized for dihydrodiol dehydrogenase
activity... 82
25. UV spectra of metabolites from incubation optimized for dihydrodiol dehydrogenase activity... 83 26. HPLC profile of control incubation for cyclopentafused
benzo [el pyrene... 86 27. HPLC profile for cyclopentafused benzoCe3pyrene
metabolites... 87
28. UV spectra of cyclopentafused benzo[elpyrene and its
major metabolites... 88
29. Hass spectrum of cyclopentafused benzoCe]pyrene... 89
30. Hass spectrum of cyclopentafused
benzoCelpyrene-3,4-dihydrodiol (peak A)... 91 31. NMR spectrum of cyclopentafused
benzotelpyrene-3,4-dihydrodiol (peak A)... 92
32. Pathway for detoxification of a trans-dihydrodiol by
1. Mutagenicity of benzCjlaceanthrylene and Its
bay-region metabolites In the absence and
presence of S9 (0.8 ng/plate)... 60
2. Mutagenicity of benzCjlaceanthrylene and Its
bay-region metabolites at varying S9 concentrations 61 3. NMR data for benzCjlaceanthrylene-S,le-dlhydrodiol
and metabolites... 67
4. NMR data for benzCjlaceanthrylene-9,10-qulnone... 80
5. NMR data for naphthalene-1,2-dlol and
1, 2-naphthoqulnone... 84 6. NMR data for cyclopentafused benzo[e]pyrene and Its
3, 4-dlhydrodlol... 93
7. Comparison of mutagenicity and flE., /6 for
benzCa 1 anthracene and benzC j laceanthrylene... 96
8. Comparison of mutagenicity and AE^^^q^/B for
benzoCelpyrene, cyclopentaCc,dlpyrene and
ACKHQWLEDGEHENTS
I vould like express appreciation to my
readers. Dr. Louise Ball, Dr. Avram Gold and Dr. Lori Todd, for their time and effort in this project. I vould especially like to thank Dr. Ball for her excellent guidance
and patience in my graduate school experience.
The technical support of Guy Lambert of
Environmental Health, Research and Testing, Dean Harbury of
UHC School of Public Health, and Dr. Dave Harris of UNC
Chemistry Department for LC/HS, HS and NHR analyses is greatly appreciated. Special thanks to Dr. Sangaiah for synthesizing several of the compounds in this study, and supplying information on UV and NHR spectra from his previous studies.
I vould also like to thank my family and
friends for their concerns and encouragement, especially ray
husband, Douglas, for his love and support, and the
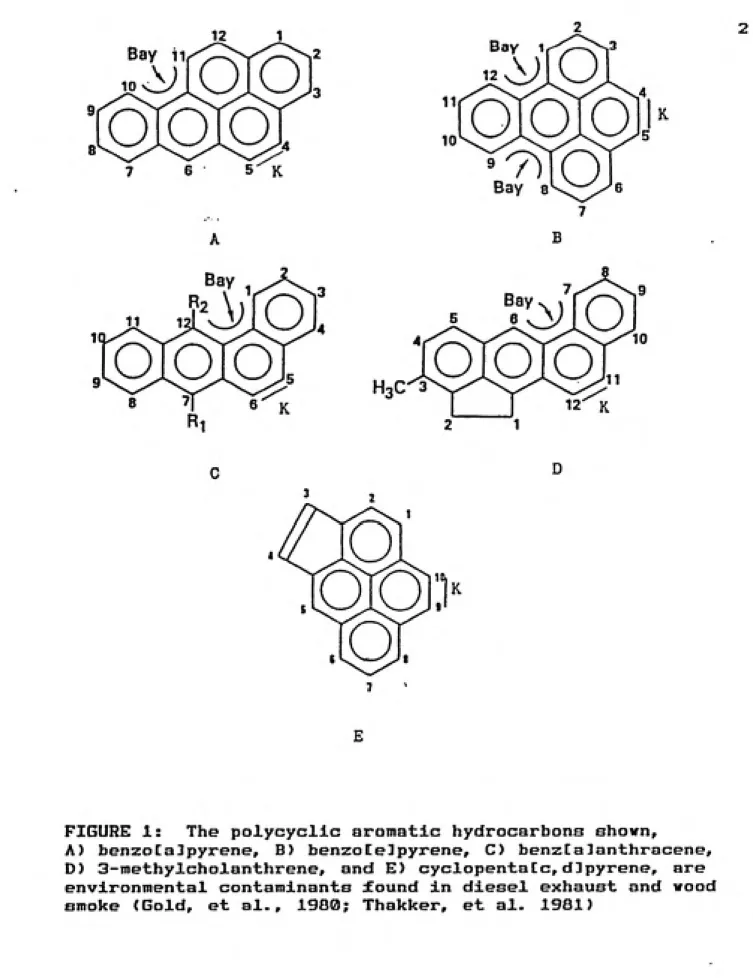
Polycyclic aromatic hydrocarbons (PAHs) are
environmental pollutants generated in combustion processes (Kamensr et al., 1987; Lo, et al., 1978). Several examples are shovn in figure 1. Whether these compounds are potential public health hazards, causing cancer, depends on the chemical dose received, and its distribution within the body (Boulos, et al., 1986; Jeffrey, 1985). The distribution is influenced by the compound's metabolism, and the stability and reactivity of the metabolites produced.
Cytochrome P-450, an enzyme predominantly found in the liver, is knovn to be involved in xenobiotic metabolism.
Studies have indicated that this enzyme oxidizes PAHs
forming electrophilic species. These metabolites may then interact vith cellular macromolecules, such as protein or
DNA. If the damage is not repaired these interactions can
ultimately result in tumor formation.
The prediction of biologically active metabolites is
directed towards the structural features of PAHs. The
relationship between metabolism at the K- and bay-regions,
shown in figure 1, and biological activity is known for
several compounds, including benzCa3anthracene (BaA) and
benzoCelpyrene (BeP). The mutagenic activity, determined by
the Ames assay, indicates that the bay-region metabolites
•>
Bay 11o
o
o
o
o
7 6 5 K
o
o
o
Bay 8
B
^
o
o
H^C
O
12' K
FIGURE 1: The polycycllc aromatic hydrocarbons shown,
A) benzoCalpyrene, B) benzoCelpyrene, C) benzCalanthracene,
D) 3-methylcholanthrene, and E) cyclopentatc,dlpyrene, are
carcinogenic metabolites (Jerlna, et al., 1978).
Derivatives of BaA and BeP, benzCJlaceanthrylene (BJAA)
and cyclopentafused benzoCelpyrene (cpBeP), respectively,
are shown In figure 2. BjAA and cpBeP are the focus of this study. BJAA Is unique In that It has three structural
features, the K-reglon, bay-region and a peripheral etheno bridge. CpBeP has two regions of potential activity, the bay-region and a peripheral etheno bridge. The peripheral etheno bridge or cyclopentafused ring may be subject to electrophlllc attack and undergo oxidation, ultimately
forming a mutagenic metabolite. The resulting active
electrophlle could then Interact with DHA (Harvey, et al.,
1988a). Gold and colleagues (1988) postulated that a reactive intermediate of this ring most likely forms the major metabolic pathway of cyclopentafused compounds.
Studies performed by Nesnow and colleagues (1984) showed that BjAA Incubated with Aroclor 1254 Induced S9 rat
liver microsomes generated several metabolites. The
trans-If 2-dlhydrodiol was the major metabolite comprising
60% of the total metabolites formed (Nesnow, et al., 1988).The tEana-9,10- and 11,12-dlhydrodlol were formed
contributing to approximately GX and 3% of the total,
respectively. The 10-hydroxy-BjAA was also observed
o
o o
o
o
o
o
o
8 BayB
FIGURE 2: BenzCJlaceanthrylene, (A), and cyclopentafueed
benzoCelpyrene (B).
BjAA metabolism has also been studied In mouse embryo fibroblasts, C3H10T)&CL8 cells where this compound had been
found to Initiate morphological transformation. The major
metabolite formed, the BjAA-9,10-dlhydrodlol, comprises 55X
of the total. The BjAA-l,2-dlhydrodlol vas only a minor
metabolite consisting of 14% of the total metabolites (Hohapatra, et al., 1987). Since the BjAA-9,10-dlhydrodlol
vas so promlnant and could be a precursor to the bay-region dlol-epoxlde, ve Initiated mutagenicity studies on the bay-region metabolites to determine If this vas a possible route
of metabolic activation for BjAA.
This study Involves mutagenicity testing of BJAA and Its bay-region metabolites by the Ames assay to determine If the morphological transformation observed In the C3HieTKCL8 cells could be explained by oxidation of the BjAA
bay-region. Metabolism studies vlth rat liver S9 will be conducted on the BjAA-9,10-dlhydrodlol to determine vhat metabolites may be formed by Aroclor Induced rat liver
Isozymes.
Previous studies by Ball and colleagues (1991) have
Indicated that cpBeP shovs significantly greater mutagenic
activity In the Ames assay than BeP. Metabolites of cpBeP
generated by rat liver S9 vlll be Identified In this study
to determine hov the addition of the cyclopentafused ring
affects the metabolite profile, vhlch may explain the
II. BACKGROUND
II.A. ENVIRONMENTAL SOURCES
PAHs have been found in the environment due to natural
occurrences such as forest fires. As a result of these
fires, PAHs are deposited on the soil, and may contaminate
nearby river and marine sediments from vater runoff (Lo, et al., 1978). However the major source of PAH contamination occurs through activities of man. Fossil fuels are used for 90% of the nation's energy. Combustion is usually the last process in converting fossil fuels to energy. An inefficient combustion process is a major source of PAH.
BenzoCa]pyrene (BaP), a well studied PAH, is often used
as a measure of PAH contamination. Over 1300 tons of this
compound were released into the environment per annum in the
United States (Levin et al., 1978). The processes that
release this particular PAH, in addition to other PAHs are
refuse burning, 600 tons BaP, heat and power generation,
500 tons BaP, coke production, 200 tons BaP, and
gasoline-powered motor vehicles 22 tons BaP (Boulos, et al., 1986;
Lo, et al., 1978).
PAHs are also released in wood smoke and cigarette
smoke (Lo, et al., 1978). These compounds are sorbed onto
Inhaled by humans. This is one route of human exposure. Another route of human exposure is ingestion. Potable water supplies have been contaminated with PAH present in tar used to coat water pipes. Also, PAHs present in air may
deposit onto food stuff, and into soil where plant roots may absorb these compounds. Hany foods such as fresh vegetables (2.8-24.5 ppb BaP), coffee (3.9 ppb BaP), and even vegetable
oils (0.4-1.3 ppb BaP), contain low concentrations of PAH.
PAHs are also generated in cooking, especially in flame and charcoal broiled meats, trace-50.4 ppb BaP (Boulos, et al.,
1986; Lo, et al., 1978). Once PAHs are absorbed into the
body, they may interact with cellular components after
metabolic transformation and are thus said to be biological
agents.
An association between cancer and PAHs generated from fossil fuel sources is well documented in epidemiological studies involving coke oven workers, gas works operators and
coal liquefaction workers. An increase in cancer incidence
has also been documented in urban and industrialized areaswith higher energy emissions compared to rural areas
(Guerin, et al., 1978).
II.B. CARCIHOGEHICITY
Chemical carcinogenicity is a multistep process
involving three stages: initiation, promotion and
chemical is an electrophlle damaging DHA by causing base
substitution, deletions and chromosome translocations, amplifications and transpositions. Although mutations occur
at high frequency, they are usually repaired. Unrepaired or misrepaired mutations vill result in irreversible damage.
Protooncogenes, tumor suppressor genes and transcriptional
regulatory genes are involved in controlling normal cell growth and differentiation. These genes are often the
genetic targets of the initiation phase (Weinstein, 1988).
Promoters are compounds that act at stages subsequent to Initiation. These compounds are generally not electrophilic, and do not interact with DMA. However
post-initiation treatment with low concentrations of promoter can
induce carcinogenesis at much lower doses of initiator than
in the absence of promoter (Levl, 1987). Studies with
phorbol esters, a class of compounds that are highly effective as promoters, show that these molecules do not
bind to DHA, but bind to membrane-associated receptors
producing effects at the epigenetic level (Weinstein, 1988).
The effects of promoter binding is reversible at an early
stage. Continuous low level exposure is needed, suggesting
that there is a threshold level that must be reached in order for the promoter to have an effect.The effectiveness of a chemical in causing
carcinogenesis depends on several factors: the rate of
rate of Interaction between the chemical and competing cellular nucleophlles, such as RNA or proteins; whether detoxification of the chemical occurs, and to what extent; and the stability of the active intermediate during
transport across the membrane and the probability of it
reaching a genetic target (Weisburger, 1980).
Brookes and Lawley (Conney, 1982; DePierre, et al.,
1978) using several PAHs, including BaP, observed a positive correlation between carcinogenic activity of the compound
and the degree to which it bound to DMA. This observation was also confirmed by Buty and colleagues (1976). However no correlation was observed between carcinogenicity and the chemical binding to protein. It is thought that arene
oxides of PAHs bind to DMA and transform normal cells into
cancer cells (DePierre, et al., 1978).
II.C. STRUCTURE-ACTIVITY RELATIOHSHIPS
Understanding the relationship between molecular
structure and biological activity would be very helpful in
predicting the mutagenic/carcinogenlc activity of new
compounds. Several theories, the most Important being the
bay-region theory, were developed to attain this goal.
II.C.1 K-Reglon Theory
Pullman and Pullman suggested that the reactivity of
the molecule was the key in relating chemical structure and
10
colleagues (Pullman, et al., 1955) demonstrated that
metabolic transformation took place at carbons adjacent to the most reactive regions of the molecule. The K-reglon
reacting with a cellular macromolecule caused
perhydroxylatlon of the M-reglon, figure 3, resulting In
dlhydrodlols as Intermediates In metabolism.
Pullman and Pullman (1955) compared theoretical
calculations of bond energies vlth biological activity of several compounds. For a compound to have carcinogenic
activity It needed an active K-reglon, however this was not
sufficient. If the compound also contained a L-reglon, this
region would need to be less reactive or Inactive to Increase the carcinogenic activity of the compound.
Attempts to show If the K-reglon arene oxides were proximate carcinogens or ultimate carcinogens, were unsuccessful In the early 1970's (Bresnlck, 1976). However, Jerlna and colleagues (1978) observed that molecules
containing bay-regions usually had a K-reglon as well, which
might explain the correlation between the K-reglon and
biological activity seen by the Pullmans.
II.C.2 Bay-Region Theory
Previous studies have shown that arene oxides,
dlhydrodlol precursors, were the primary oxidative
metabolites of PAHs (Lehr, 1982). Metabolism studies
Indicated that the BaP-7,S-dihydrodiol is further
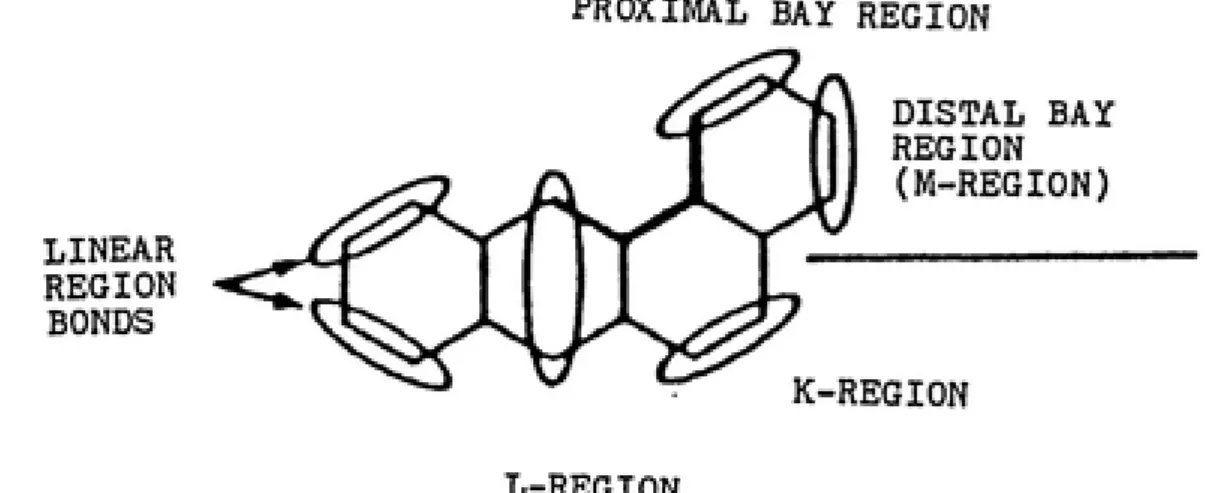
PROXIMAL BAY REGION
LINEAR
REGION BONDS
DISTAL BAY
REGION
(M-REGION)
K-REGION
L-REGION
FIGURE 3: The K-, L-, and bay-regions are important
in determining structure activity relationships of
12 reactive metabolite that binds to DHA (Lehr, 1982; Jerlna,
et al., 1978; Wood, et al., 1976). The dlol-epoxldes vere
highly reactive, and compounds forming this structure
display substantial biological activity. Also a unique structural feature was observed for the BaP-7,8-dlhydrodlol-9,10-oxlde. The epoxide was located on a saturated, angular benzo-rlng which formed part of the bay-region of the molecule (Jerlna, et al., 1978).
The bay-region became the critical structural feature
accounting for the mutagenlc/carclnogenlc activity of some PAHs (Jerlna, et al., 1978; Tsang and Griffin, 1979).
Jerlna and colleagues (Conney, 1982) who developed the theory were able to predict the proximate and ultimate carcinogenic metabolites of PAH. Examples conforming to
this theory are BaA, 3-methylcholanthrene (3-MC), chrysene
and dlbenzoCa, Upyrene. However as Tsang and Griffin (1979) observed, the presence of a bay-region oxide may be necessary, but this structural feature Is not sufficient for
carcinogenic activity as seen from the example,
phenanthrene, which contains a bay-region, but Is not
carcinogenic. Tsang and Griffin C1979) also Indicated that
cyclopentatc,dlpyrene (CPP) was shown to be highly
mutagenic, but did not contain a bay region.In the bay-region theory, the resonance stabilization
energy for the carbonlum Ion formed on oxide ring opening,
usually the benzylic atom on the saturated, terminal ring forming part of the bay region. The larger the value of
AEjjgjgj,/fl, the more readily the epoxide precursor forms the
carbonium ion (Jerina, et al., 1978). The ion appears to be more readily formed for bay-region diol-epoxides, than for non-bay-region epoxides and diol-epoxides. The stability of
the carbonium ion formed from the epoxide in the bay-region vs. the non-bay-region may in part account for the biological and chemical activity seen with compounds containing bay-regions. Compounds containing substitutuents
and methylene bridges adjacent to the bay-region may
increase the stability of the carbonium ion, thereby increasing the activity of the compound (Rice, et al.,
1988). The ease of carbonium ion formation as reflected in
AEj.i../fi values may be used in a qualitative ranking of PAHs
for carcinogenicity (Jerina, et al., 1978).
Hany compounds appear to follow the bay-region theory. However, Jerina and colleagues (1978) suggest caution in
applying this theory, since several elements were not
considered in the quantum mechanical calculations. Factors
not included were the influence of the detoxification of a
compound by enzyme systems, and the delivery to and reaction
with the critical target or receptor (Jerina, et al., 1978).
Tsang and Griffin (1979) also mention that the calculations
do not take into account substituents on the saturated or
14 substxtuents on the angular benzo-rxng tend to decrease the activity o± the molecule as a result of Inhibiting epoxide formation. Methyl groups in the bay-region on the same angular ring will lover tumorigenic activity (Rice, et al.,
1988). However, substituents on other carbons on the
molecule may block these sites from metabolism, thereby
increasing metabolism at the benzo-ring of the compound
(Tsang & Griffin, 1979; Jerina, et al., 1978). Methyl groups at sites other than the angular ring protruding into
the bay-region may promote association of the metabolite
with DMA or effect the metabolism of the PAH (Harvey, et al., 1988a; Hoffman, et al., 1981; Sraithgall, et al., 1988). II.C.3 Di-Region Theory
Discrepancies in the bay-region theory have been seen concerning the correlation between biological activity and
carbonium ion delocallzation energies (Lehr, 1982). BenzoCalnaphthacene and dibenzoCa,Jlnaphthacene are two compounds that are not biologically active, but the calculated delocallzation energies are greater than the
delocallzation energies calculated for BaP. Other
exceptions are benzoCclchrysene and dibenz[a,j3anthracene
which exhibit biological activity, but have smaller
delocallzation energies than compounds that are marginally
In lieu o£ these short comings of the bay-region
theory, Qlanhuan (1985) has suggested a theory vhlch takes
several regions of the molecule (Including the bay- and
K-regions) Into consideration. The dl-region theory
suggests that two active centers need to be present in the PAH molecule In order to have complete carcinogenic
activity. Figure 4 shows the regions of the molecule
considered in this theory. Experimental evidence indicates that the sites of lowest to highest delocalization energies
are L, K, E' followed by E.
In addition, Qlanhuan (1985) suggested that the optimum
distance between the active centers in the molecule should
be 2.80-3.00 A , the distance between two negative centers in the DMA double helix. Experimental evidence has shown that carcinogenic molecules interact with DMA via
electrophilic intermediates that have resulted from metabolism of the parent compound. Qlanhuan concluded that mutagens such as DHBA (dlmethylbenzanthracene) induced cross linking of complementary bases of different DHA strands.
II.D. CYTOCHROME P-450
Cytochrome P-450 is involved in the metabolism of
drugs, steroids, pesticides and PAHs (Estabrook, et al.,
1978). This enzyme converts hydrophobic compounds to
hydrophilic compounds through a variety of reactions such as
16
E CARBON
s>
E' CASBOa
fv
HESO
M CASBQI
M' CARBOH
L*
PCPERl
FIGURE 4» The regions ahovn above are important
in the dl-region theory. This theory suggests that two active centers need to be present in the molecule in order to have complete carcinogenic activity
oxidation, nitrogen, sulfur and oxygen dealkylations, oxidative deamination and nitrogen reduction to name a fev
(Yang, et al., 1987; Hodgson, 1987).
Cytochrome P-450 monooxygenase system (HO), or mixed function oxidases (HFOs), consists of two enzymes, NADPH cytochrome P-450 reductase and cytochrome P-450, the latter enzyme contains a heme group (DePierre, et al., 1978). The HFOs are found predominantly in the endoplasmic reticulum of the liver, but are also present in lower concentrations in
the kidney, brain, and cells near portals of entry in the lung, intestine and skin (Hodgson, 1987). The name P-450 was derived from the reduced form of the carbon monoxide
derivative which has an absorption maximum at 450 nm. Separation and purification of many isozymes of cytochrome P-450 has been accomplished. The absorbance maximas of the CO bound reduced form have ranged from 447-452 nm. These
isozymes differ in structure and show independent and overlapping specificities for various substrates (DePierre,
et al., 1978).
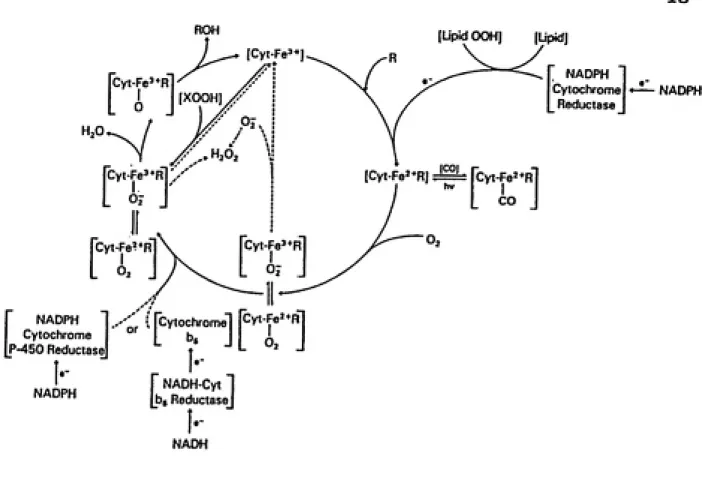
A well known scheme of cytochrome P-450 catalyzed
reactions is shown in figure 5, although the intermediates
in some of the steps have not been completely elucidated
(Estabrook, et al., 1978). The oxidized form of cytochrome
P-450 (Felll) interacts with the substrate to form an18
ROH
NADPH 1 .-••'' ( fCytochrome] rCytFe^^RJ
Cytochrome °^ [ b, J '
M50 Reductase] t -' L '^J J
I-NADPHI-r NADH-Cyt "]
[bg ReductaseJ
I-NADH(Lipid OOH] [Lipid]
[Cyt-Fe^+I
Cyt-Fe^*R
[XOOH]
[Cyt-Fe^*R) -^
Cyt-Fe^+R Cyt-Fe=*R
CO
NADPH
Cytochrome
Reductase
NADPH
FIGURE 5: The schematic indicates the events that occur for
cytochrome P-450 monooxygenations. This enzyme is involved in
the oxidation of PAHs, and the formation of the ultimate
loosely at the heme moiety. A series of oxidation-reduction reactions then occur. First, one electron is transferred from HADPH cytochrome P-450 reductase to the enzyme-substrate complex. Molecular oxygen combines vith the reduced enzyme-substrate complex. Transfer of a second
electron from HADPH or HADH cytochrome b- reductase results
in reductive cleavage of the oxygen-oxygen bond, yielding
H^O and an oxygen atom which is transferred from the iron
center to the substrate. The enzyme and oxidized substrate then dissociate, restoring the enzyme to the ferric form
(Hodgson, 1987).
Experiments performed by Conney and colleagues (1982) Involved the treatment of rats with benzopyrene prior to
exposure to several other organic compounds. They showed that the liver microsomal enzymes responsible for hydroxylation of benzopyrene, hydroxylated some of the organic compounds tested, but not all of them. Additional
studies (Conney, 1982) showed that purified hepatic cytochrome P-450 of control rats and rats treated with methylcholanthrene and phenobarbitol, in the presence of excess HADPH cytochrome P-450 reductase exhibit different
substrate specificities. These results suggest that
Isozymlc monooxygenases are present in the liver.
In fact, we now know that many isozymes of
cytochrome P-450 exist, and they have overlapping substrate
20
studies above, are Inducible. Whitlock and colleagues (1973) have shovn that PAHs stimulate synthesis of the
enzyme at the level of transcription and that protein synthesis is also controlled by a regulatory protein. Buty and colleagues (1976) demonstrated with several PAHs, Including BaA, BaP and 3-MC, that induction of the MFD
system, and tumor initiating capability of a compound were unrelated. As a result, the generation of PAH Induced cytochrome P-450 has become a very useful tool in the study of carcinogenesis.
II.E. PAH METABOLISM
Epoxide formation occurs by the addition of an oxygen
atom catalyzed by cytochrome P-450, to an arene bond. In1950 Boyland and colleagues (Grover, 1986) proposed that dihydrodiols, phenols and mercapturic acids were formed from epoxide precursors. Jerina and colleagues showed that napthalene oxide was the necessary intermediate in the metabolism of napthalene to napthol, dlol and the
glutathione conjugate (DePierre, et al., 1978). Other
studies with phenanthrene, BaA and BaP also support these
results (Grover, 1986).
Arene oxides may occur in the bay-region. Results from
molecular orbital studies indicate that the distal region
carbon-carbon bond has greater electron density than the
oxide formation. Depending on the stability and reactivity
of the metabolite and its affinity to the enzyme, the substrate may undergo a variety of reactions as shown in figure 6. The epoxide may undergo hydrolysis via epoxide
hydrolase to form a trans-dihydrodiol (Path A); conjugation
with glutathione (Path B) and be detoxified; or
rearrangement to a phenol (Path C) and be detoxified by subsequent conjugation with glutathione (Chu, 1980; Kadlubar
and Hammons, 1987). It has also been demonstrated that
arene oxides of BaP, BaA and 3-MC may be reduced back to the parent hydrocarbon when incubated with rat liver microsomes. This process is NADPH dependent and inhibited by oxygen
(DePierre, et al., 1978).
The trans-dihydrodiol is the key product in the metabolic pathway. This molecule may be detoxified by conjugation with glucuronic acid (Path A2), or be reduced to a catechol and subsequently oxidized to a quinone (Path A3). The trans-dihydrodiol may also form the ultimate carcinogen,
the diol-epoxide (Path Al), as a result of further oxidation by cytochrome P-450. This metabolite may still be detoxified via glutathione conjugation. However
diol-epoxides are of concern, since an increase in stability of
1;|l« carbocation enhances the carcinogenicity of the
molecule, and its liklihood of binding to DMA (Chu, 1980;
Kadlubar and Hammons, 1987) and microsomal and nuclear
Oxidation ^^.'-''^v^H
-^XS-^J Reduction y^^<^
Hydrolysis
A
Oxidation
HO H
A2
Conjugation
0— (Glucuronides,
Sulfates)
HO H
HO H
^j 1^0—(Glucuronides J\_ A Sulfates)
H
Reduction Conjugation
Oxidation
HO H
HO H HO H
HO H H H GS H
Additional studies by Grover and Sims, and independently by Heidelberger (1975), demonstrated that epoxides bind more readily to cellular macromolecules than the corresponding parent hydrocarbon or dihydrodiol metabolite. Grover and Sims (Heidelberger, 1975) from earlier studies shoved that K-region epoxides of DHBA and phenanthrene reacted covalently vith DNA and histones. Grover and colleagues (DePierre, et al., 1978) also showed that K-region epoxides vere formed after incubation vith lung microsomes from 3-HC treated animals. These epoxides reacted vith glutathione (Grover, 198&). Dihydrodiol and phenol metabolites have also been observed (DePierre, et al., 1978). Other studies have shovn epoxides to be electrophilic, cytotoxic, mutagenic and capable of inducing cell transformation. Hovever the potency of these epoxides is still less than their parent compounds (Kadlubar and
Hammons, 1987).
Mechanisms proposed for phenol formation are
isomerization of epoxides, dehydration of dlhydrodiols, breakdovn products of dihydrodiol conjugates, and reactions
betveen vater and radical cations. Although fev examples
vere cited for these proposals, the most popular mechanism
vas the spontaneous isomerization of epoxides to phenols
(Grover, 1986). The high electron density of the L-region,
24
probability of quinones occurring in this region, and
thereby detoxifying the compound (Miller, et al., 1974).
lI.E.1. BenzoCalpyrene
Benzo[a]pyrene was extensively studied to determine its
metabolites, and their mutagenicity and carcinogenicity, figure 7 (Conney, 1982). In the presence of purified
hepatic cytochrome P-450, BaP metabolites that were
generated consisted of phenols and quinones. Upon the addition of epoxide hydrolase, three jjcanei-dihydrodiols, 4,5-, 7,8-, and 9,10- appeared, decreasing the concentration
of phenolic metabolites. The BaP-4,5-oxide metabolite was present in the initial incubation, appearing on the chromatogram. After epoxide hydrolase was added, BaP-4,5-oxide was no longer observed. Conney and colleagues (1982) reported that the metabolite was a potent mutagen, producing a low incidence of tumors when applied to mouse skin and did not exhibit a dose-response relationship (Wood, et al.,
1976). This metabolite was demonstrated to be a weak tumor
initiator as well. Although BaP-4,5-oxide is a potent
mutagen, in the presence of epoxide hydrolase and glutathione-s-transferases, deactivation of the metabolite
probably occurs at a rate which limits the interaction
between the compound and the genetic material of the skin
(Wood, et al. , 1976).
Further work varying the ratio of cytochrome P-450 and
Glucu'0"'des
DNA
Binding
I O G UDfGA T
3 O G 3 OH
70H
90 G 6 O G
6 OH 7 8 Dtol
9.10 Diol
o o 4.5 Diol
o o o SuKales
9.10 S EpoKidcs Oh>Is 12,301 M.50I 17.801 I9.10OI l-U-4,5 Wr 7.8
H(9.10 ^
MrO - Mined Tunclion Oxidases EH - F.r>o»idr Hvdialase
GSH-T - GK/lalfiionr S ErKJwicJf! Tranitlerasc UOTGAT • vnP GUicufonlc Acid Tunstciase
ST • 5t»l(o(i,ns'efas«
NE - Non-En/ymalic SS - Strrrosf>f»ci^ic
/ - Trans
Teirol 1 17.10/8.9)
Tflrol 217/8.9.101
Diol Epoxidr I
Triol
/GSHT
(f-7.r8 diol (9.10 OKv \
Diol Epoxide II
ONA
RNA
r-7.( 8 diol c 9.10 oxy GSH Conjugates 4.5-SG 7.8 SG 9.10 SG NAOPH NADH
Teirol 1 (7,9.10/81 Teltol2(7.9/8.10)
Ttlol 17.9/81
26 oxides and dihydrodiols (Conney, 1982). In the presence of epoxide hydrolase, the epoxide gave rise to dihydrodiols,
while phenols were formed in the absence of epoxide hydrolase. In addition, this evidence indicates that epoxide hydrolase is involved in the detoxification pathway as well as in the formation of ultimate carcinogens.
Weak mutagenic activity was seen for the 7,8- and
9,le-oxides. However the 7,8-dihydrodiol-9,10-epoxide
exhibited the highest mutagenic activity of all the
metabolites of BaP in S. typhimurium TA98 and TAie0 and
mammalian cell assays. In the bacterial strains, the
7, a-dihydrodiol-9,10-epoxide-BaP 2 (syn isomer) was a more potent mutagen than the 7,8-dihydrodiol-9,10-epoxide-BaP 1 (anti isomer). The opposite result was observed in mammalian cell assays (Conney, 1982; Wood, et al., 1976).
Unlike the 4,5-dihydrodiol, the 7,S-dihydrodiol was shown to be a potent tumor initiator in mouse skin. The strong carcinogenic activity of the 7,a-oxide and 7,S-dihydrodiol
is a result of the conversion to the highly reactive 7,a-dihydrodiol-9, 10-oxide (Conney, 1982).
Epoxides of BaP are the key metabolites involved in DMA
binding (Singer, et al., 1983). The first evidence of
metabolic activation of PAH was reported by E. C. Miller in
the early 1950's (Conney, 1982). Application of BaP to
mouse skin resulted in covalent binding of BaP metabolites
human liver microsomes can oxidize the 7,8-dihydrodiol to
metabolites that bind to DMA. Weinsteln's group (Conney,
1982) demonstrated that the BaP-7,8-dihydrodiol-9,10-oxide
isomer 2 vas shown to bind to DMA in cultured cells. This result vas also demonstrated by Sims and colleagues (Conney, 1982). In addition Weinstein's group reported that the
BaP-7,a-dihydrodiol-9,le-oxide isomer 1 bound to a greater extent than isomer 2; and that the major adduct formed vas a covalent bond betveen isomer 1 and the H2 position of guanine (Conney, 1982; Singer, et al., 1983). Minor DNA adduct products have been detected as veil. BaP metabolites vere observed to bind at the N7-guanine, 06-guanine, N6-adenine and the N4-cytosine positions vithin the DNA
(Osborne, 1985).
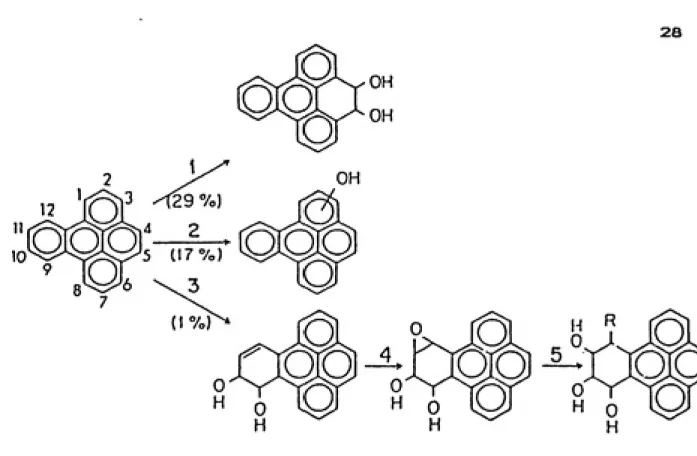
II.E.2. BenzoCelpyrene
Benzo[e1pyrene is a symmetrical hydrocarbon vith a
K-region and tvo identical bay-regions. Little to no tumorigenic activity vas seen in mice or rats for this compound (Conney, 1982; Jacob, et al., 1985). The main
metabolite formed is the trans-4f5-dihydrodiol in rat liver
homogenates, figure 8, and embryonic cells of mice and
hamsters. This compound is also the predominant metabolite
formed in untreated rat liver microsomes. The
3-hydroxy-and 4-hydroxy-BeP have been identified as veil. The putative proximate carcinogen, the trans-g.i0-dihydrodiol,
28
3 ^29 7o)
5 (17 7c,)
FIGURE 8: BenzoCelpyrene predominantly forms the K-region dihydrodiol when incubated with methlycholanthrene induced hepatic microsomes; only a small amount, IX, of the
and rat liver microsomes (Jacob, et al., 1985). This metabolite was usually further metabolized to the 4,5,9,10-tetrahydro-4,5,9,10-tetrahydroxy-BeP, and not the ultimate carcinogen, the 9,10-dihydrodiol-ll,12-oxide. Incubation of BeP with uninduced rat and human liver microsomes, resulted
in IX and 12% yields of the 9,10-dihydrodiol, respectively (Jacob, et al., 1985).
The 9,10-dihydrodiol-ll,12-oxide was made
synthetically, and its mutagenic activity was tested. The actual mutagenic activity of this compound was lower than
expected from the quantum mechanical calculations (MacLeod, et al., 1980). This weakly active ultimate carcinogen can increase the number of pulmonary tumors in mice and the number of hepatic tumors occurring in male mice (Conney, 1982).
Many investigators have attempted to determine why BeP
has low mutagenic activity compared to BaP. MacLeod and
colleagues (1980) answered this question by comparing the
metabolism rate of the two compounds. When both compounds were incubated with purified or reconstituted mixed function
oxidase systems, they had comparable metabolism rates.
These results indicated that BeP could be used by the mixed
function oxidase system as a substrate. MacLeod and colleagues concluded that the initial site of oxidation was
30 whereas BeP oxidation resulted in formation of dihydrodiols
in the K-region (4,5 position). PAH induced cytochrome
P-450 incubated with BeP resulted in a slightly greater
yield of the BeP-9,10-dihydrodiol. The low yield of this
bay-region metabolite precursor may explain the low mutagenic and carcinogenic activity of this compound (Jacob, et al., 1985).
II.E.3 CyclopentaCc, dlpyrene
The bay-region theory does not account for the
biological activity of this compound, since it does not possess a bay-region. The five-membered ring is highly
susceptible to epoxidation due to the olefinic nature of the
double bond, and AEjjgjjjj,/B of the C3 carbonium ion resulting
from epoxide ring opening is identical to that from BaP
diol-epoxide (Eisenstadt, et al., 1976).
CPP was tested over the standard spectrum of
S. typhimurium strains used in the Ames assay. The specific
activity was 174 rev/nmole in TA1537, and the amount of S9 needed to produce an effect in this assay was approximately
one-tenth of the amount needed for BaP (Eisenstadt, et al.,
1978). However, unlike the ultimate carcinogen of BaP, a dramatic decrease was observed in the mutagenicity of CPP upon addition of epoxide hydrolase (Wood, et al., 1980).
The predicted ultimate carcinogen of CPP is the
3,4-oxide. This metabolite is direct acting and highly
TAIQQ, the specific activity of this metabolite was
calculated to be 1440 rev/nmole (Gold, et al., 198Qa).
The CPP-3,4-oxide transforms C3H10TKCL8 cells, but with less activity than BaP. This assay is a morphological
transformation assay which has been documented to respond to chemical carcinogens, including PAHs (Gold, et al., 1980b).
The 3,4-oxide is a weak tumor initiator, similar in activity to BaA (Wood, et al., 1980), but only one-twentieth as
active as BaP (Raveh, et al., 1982).
Since the activity of CPP cannot be explained by the formation of a bay-region diol epoxide, Eisenstadt and
Gold (1978) suggested the activity may be governed by the
formation of a stable benzylic carbonium ion. The resulting electrophile would interact with cellular macromolecules yielding biological activity (Eisenstadt, et al., 1978;
Gold, et al., 1980a).
II.E.4. BenzCa]anthracene
Based on the bay-region theory, Jerina and colleagues predicted the proximate and ultimate carcinogenic
metabolites of BaA to be the 3,4-dihydrodiol and the
1,2-32 and 11,12-dihydrodiols have been observed (Singer, et al.,
1983). The 3,4-dihydrodiol was at least 10 times more
mutagenic than BaA and the other trans-dihydrodiol
metabolites in S. typhimurium strain TA100 with S9
activation (Conney, 1982).
BaA is a weak skin tumor initiator, and noncarcinogenic
in many in vitro cell transformation systems and in vivo
animal tumorigenesis assays (Slaga, et al., 1978). When
tested as a tumor initiator in mouse skin, the
3,4-dihydrodiol was shown to be 5-10 times more active than
BaA and the tEaaa-l,2-, 5,6-, 8,9- and 10,11-dihydrodiols of BaA (Conney, 1982; Slaga, et al., 1978). Since the 3,4-dihydrodiol is distal to the bay-region the high level of activity of this metabolite can be explained by secondary metabolism to the bay-region diol-epoxide (Wood, et al., 1976).
The 8,9-dihydrodiol-10,11-oxide 2 (anti isomer) and the
3,4-dihydrodiol-l,2-oxide 2 (anti isomer) were shown to bind covalently to DNA when BaA was applied to mouse skin. Both
dihydrodiols react with the 2-amino group of guanine (Singer, et al., 1983). The 8,9-dihydrodiol-10,11-oxide also reacted with deoxyadenosine (Heraminiki, 1980). The 3,4-dihydrodiol-l,2-oxide isomer 2 has greater mutagenic and
carcinogenic activity of the two metabolites, and appears to
be a tumor initiator, more tumorigenic than BaA, initiating
However both metabolites are probably responsible for the
biological activity of BaA (Hemminiki, 1980). Singer and Grunberger (1983) state the significance of the mutagenic
activity of the 8,9-dihydrodiol-10,11-oxide is not clear;
and that its activity is a failure of the bay-region theory
to predict all the metabolites that may bind to DNA.
II.E.5. 3-Hethlycholanthrene and 3-Methylcholanthrylene
3-Hethylcholanthrene is similar to BaA with the
exceptions of a methyl group at the 3 position, and a
saturated 5-membered ring fused between positions 7 and 8 of
BaA. When this compound was incubated with cytochrome P-450
and epoxide hydrolase, the two major metabolites formed were
the 1-hydroxy- and the 2-hydroxy-3-MC. Only a small amount
of the proximate carcinogen, the 9,10-dihydrodiol, was
formed (Conney, 1982; Singer, et al., 1983; Jacobs, et al.,
1983). In contrast, Li and colleagues (1983) have claimed that the 9,10-dihydrodiol is one of the major metabolites.
When the 1-hydroxy-, 2-hydroxy- (Conney, 1982) and the
2-OXO-3-MC (Shou, et al., 1990) were incubated with cytochrome P-450 and epoxide hydrolase, a larger amount of
the corresponding 9,10-dihydrodiol was formed. Additional
metabolites formed included the 4,5-, 7,8-, and the 11,
12-trans-dihydrodiols and 1,2-diol (Singer, et al., 1983).
In S. typhiraurium strain TA98 with S9, the
1-hydroxy-was 10 times more mutagenic than 3-MC, the 3-MC-2-one showed
34 activity as 3-MC. The 11,12-dihydrodiol was inactive (Wood, et al., 1978). The 9,10-dihydrodiol was the most mutagenic
of the 3-lfC metabolites in both bacterial and mammalian
systems. This metabolite vas a more active tumor initiator
than the 4,5-, 7,8-, and 11,12-dihydrodiols (Conney, 1982),
and had similar activity to 3-HC (Shou, et al., 1990).
The 9,10-dihydrodiol-7, S-oxide was the ultimate carcinogen formed from 3-MC (Conney, 1982; Jacobs, 1983; Li,
et al., 1983). Eight major DHA adducts and one minor adduct
were isolated by HPLC from mouse skin incubated with
"^H-3-methylcholanthrene. The large number of adducts are most likely due to the 9,10-dihydrodiol-7,8-oxide and the hydroxylated derivatives that were isolated in the metabolism studies (Singer, et al., 1983). DNA adducts covalently bound at either the 7, 8, 9 or 10 positions of
the hydrocarbon, similar to BaP, were observed in cultured
mouse embryo cells and mouse skin (Osborne, 1985).
Qsborne (198G) identified two of the DNA adducts from the
incubation of hamster DHA with the
9,10-dihydrodiol-7,8-oxide. The metabolite binding at the N2 position of guanine was the major adduct. The second adduct, a minor product, resulted from the diol-epoxide binding at the 7 position of
guanine. Incubation of the ultimate carcinogen with RNA
isolated from E. coli resulted in both guanosine and
3-Hethylcholanthrylene contains a double bond at the 1 and 2 positions. This compound is a minor metabolite of 3-HC, and a potent mutagen in the Ames assay in both
S. typhimurium TA98 and TA100. 3-Methylcholanthrylene may
be further metabolized into 3-methylcholanthrene~2-one, a known carcinogen, figure 9 (Yang, et al., 1990). Yang and colleagues (1990) also predict that the potential ultimate carcinogenic metabolite of 3-MC and 3-methylcholanthrylene is the 3-methylcholanthrene-l,2-oxide, having greater
carcinogenic activity than BaP or BaA.
II.F. ANALYTICAL
II.F.1. Ames Mutagenicity Assay
In an attempt to correlate mutagenesis with
carcinogenesis, specifically cancer as a result of somatic
mutations. Dr. Bruce Ames developed an assay with a
genetically altered bacterial strain of S.__typhimurium (Ames, et al., 1975). Originally three strains of
S. typhimurium TA1535, TA1537 and TA1538, all histldine auxotrophs, vere employed in standard screening assays to
detect base pair substitution and frameshift mutations.
TA1535, predecessor to TA100, contains a mutation in the
hisG gene for the first enzyme of histldine biosynthesis.
DMA sequence analysis performed by Barnes and colleagues
36
Similar products as shown for 3MCE
I _
7f
P-4507 I P-450
OHHOH,C
3-OHMCE
P-450 EH •nd/or NE
P-450 10 P-4S0
HjC'3
3MCE
NE '-<5^^-3WCE and 10-OH-3MCE
P-450
^OH^°
,OH
OH
FIGURE 9: A proposed pathway by Yang and colleagues (1990) for the metabolism of 3-methylcholanthrene by rat liver
strains detect compounds causing base pair mutations mostly at G-C pairs. In strain TA1S38, predecessor to TA98, the hlsD3(d52 mutation Is a -1 deletion, near a sequence of eight repetitive GC residues. The correction in the misreading of the nucleotide sequence Is termed frameshlft and results In hlstldlne synthesis. Strain TA1537 also detects frameshlft
mutations.
Strains TA100 and TABS differ from their respective
parent strains by the addition of an R factor plasnld, pkml01. The plasmid Increases the sensitivity of the bacteria to mutagens by enhancing an error prone DNA repair system. A gene coding for amplclllln resistance is also present on the plasmid, and Is used In determining the
presence of the plasmid (Claxton, et al, 1982).
The culture grovn for the assay is made from a single colony picked from a master plate made from frozen stock cultures. The S. typhlmurium contain two additional mutations, uvrB and rfa, whose presence Is also verified before use. An Increase in sensitivity of the bacterial strain results from a deletion In the gene coding for DNA
excision repair, uvrB, which prevents mutations from being
repaired. The deletion extends through the blotln gene, therefore blotln Is also needed for growth. The absence of growth after exposure to ultraviolet light (UV) is
38
The permeability of the cell membrane to larger
molecules results from the rfa mutation, a partial loss In
the llpopolysaccarlde layer In the cell membrane. The
presence of a zone of Inhibition around a crystal violet
soaked filter paper added to freshly plated cells, suggests
the crystal violet Is entering the cells and killing them;
thereby Indicating the presence of the rfa mutation
(Claxton, et al., 1982; Haron, et al., 1983).
Whether the test compound Is a direct acting mutagen.
Interacting vlth cellular components, or an Indirect acting
mutagen, requiring metabolic activation prior to Interacting
vlth cellular components, can be determined In the Ames
assay. The S9 (90e0g supernatent) liver homogenate,
containing cytochrome P-45e mixed function oxidases and
cytosollc enzymes may also be added to the top agar vlth the
test compound. The liver is Induced vlth a compound similar
to those tested to increase the specific cytochrome P-450
isozymes that are responsible for the compounds metabolism.
Aroclor 1254, a polychlorinated biphenyl mixture, is quite
commonly used In the Induction of cytochrome P-450 mixed
function oxidases, since it induces a broad-range of P-450
Isozymes. This PAH has been shovn to increase the hepatic
cytochrome P-450 concentration 45-60 fold (Conney, 1982).
Hamster hepatic S9 preparations appear to be the most
efficient systems for activation of aromatic amines,
The procedure for the Ames assay Is very
straightforward. The test compound, culture, S9 and other
agents to be tested are added to melted top agar pre-cooled
at 45° C. The mixture Is quickly poured Into a petrl dish
containing solidified minimal agar. The test compound Is
added to the top agar, since It will not readily diffuse
through solid agar. The agar contains only a trace amount
of hlstldlne to Initiate cell growth. A faint background
lawn appears on the plate, and observation of this lawn is
one method of monitoring bacterial integrity in the assay.
A mutation needs to occur in the hlstldlne gene, resulting
in hlstldlne prototrophy, in order for colonies to form on
the plate. Plates in the assay are done in duplicate and
incubated at 37° C for 48 hours. Standards used in the assay
with TA9a are 2-anthramlne, as a positive control with S9
for indirect activity, and 2-nltrofluorene as the positive
control for direct acting activity (Claxton, et al., 1982).
Correlation of mutagenicity with carcinogenicity has
often been attempted on the basis of the Ames assay.
Positive mutagenic results imply that the test compounds are
possible animal or human mutagens/carclnogens. When Ames
first developed the test in the 1970's, 85-90% of the
carcinogenic compounds tested were mutagenic (Ames, et al.,
1975). In 1983 further testing by the Ames group indicated
that 83% of the carcinogenic compounds tested were
40
attempted to determine vhlch short term tests singly or In
combination would yield results most similar to large scale
animal assays. Hone of the four short term tests: Ames
assay, sister chromatid exchanges, mouse lymphoma cell
mutagenesis or chromosome aberration proved to be superior.
The Ames assay Is often chosen not only because It Is
inexpensive, widely available or technically easy, but also
for the sizable literature available. The Ames assay results indicated that 62% of the known carcinogeniccompounds tested (by rodent assays) were mutagenic.
Unfortunately, of the other three tests, none was found to
be complementary to the Ames assay. The Ames assay was the
least sensitive of the four tests. The inclusion of allfour assays in a battery of tests would only increase the
correlation of mutagenicity to carcinogenicity to 67%. Although a short term assay with the above advantages would be helpful in replacing the high cost, labor intensive
animal studies, a single short term assay cannot adequately
test the many mechanisms Involved in carcinogenesis. A
battery of short term assays may be inadequate in testing
these mechanisms as well (Tennant, et al., 1987).II.F.2. High Pressure Liquid Chromatography
High pressure liquid chromatography (HPLC) is used to
separate mixtures of less volatile compounds between two
phases, the stationary phase and the mobile phase. The
Is retained until a suitable mobile phase or solvent Is run through the column. Several types of chromatography exist
for HPLC, reverse or normal phase are the most common.
Reverse phase consists of a nonpolar material for the
stationary phase and a polar mobile phase, normal phase
chromatography Is the opposite of reverse phase. In
separating PAH mixtures reverse phase chromatography Is used
and the more polar PAHs are eluted first from the column.Column packing material for reverse phase columns often
consist of octadecylsllane, also known as ODS or C18, an alkane vlth 18 carbons. However columns containing eight carbons or shorter alkyl chains may also be used. The
stationary phase Is chemically bonded to silica as a
support.
HPLC can give both qualitative and quantitative
Information. The retention time comparison between a
standard and unknown, or co-elutlon of a standard with an
unknown may be helpful In determining structures of unknown compounds. Calibration curves of detector response made with standards of known concentrations may also be used to determine the concentration of the unknown, since peak area
is proportional to the amount of sample Injected (Meyer, et
al., 1988).
II.F.3. Mass Spectrometry
Mass spectrometry (MS) Is used to determine the
43
mass spectrometer. Nonvolatile molecules are often retained
in the mist. The mist droplets need to have an initialcharge vhich effects the ionization of the compound during
rapid vaporization. With thermospray injection, ionization
occurs during the volatilization of the solvent and the
sample.
When the vaporized sample enters the mass spec, it is bombarded by an electron beam. Energy from the electrons is
transferred to the sample. Generally, the sample has enough
energy to eject an electron, resulting in a residual
positive charge. This species is termed the molecular ion
and denoted as H^ or H' (Watson, 1985).
II.F.4. Nuclear Magnetic Resonance Spectrometry
Nuclear magnetic resonance is useful in determining the structure of an unknovn compound, for instance in metabolism
studies, vhere oxidation may have occurred on the molecule. An ideal sample should contain at least a 3 mH concentration
(Bovey, et al., 1988). However for samples that are of very low concentrations, multiple scans are accumulated, stored
in the computer and compiled to obtain the final spectrum
(Harris, 1986).
structural information from the fragmentation pattern. This
technique requires only nanomoles of sample. Ionization, 70
eV, by electron impact is one of the important techniques
applied in MS analysis (Watson, 1985).
Sample injection into the mass spectrometer may be
achieved by a variety of methods. A direct probe, where the
sample is placed in a glass ampule mounted on the end of a
probe is one method. The probe is then placed against the
ionization chamber wall, when heated, sample vapors travel a
short distance to the ionization chamber. The short
distance between the probe and ionization chamber is the primary advantage of the direct probe sample inject. However it is important that the sample be relatively free
of contaminants to obtain a clean spectrum (Watson, 1985). Instruments designed to clean up samples have been interfaced with mass spectrometers, the most common
technique is gas chromatography, GC/HS. Recently liquid chromatography (LC) has been used for obtaining mass spectra of more polar compounds not amenable to separation by gas chromatography. A thermospray technique of sample injection
has solved two major problems of LC/HS, the reduced pressure
in the mass spec due to the vaporized LC solvent; and the
generation of nonvolatile compound ions (Watson, 1985).
44
sample Is dissolved In, the sample concentration and temperature (Rahman, 1986). A sample often has nuclei In
several different chemical environments. Different chemical
environments result In different frequencies of absorption
of Isotopes In solution. These differences in resonances
are referred to as chemical shifts. Chemical shifts are
expressed in ppm or delta with reference to a standard.
Nuclei may be shielded from the external magnetic field due to nearby electrons (Harris, 1986). For example, a sample
containing hydroxy groups vlll shield a nearby proton from
the magnetic field resulting in the shifting of the signal upfield to lover ppm values (Jackman, et al., 1969).
The positions of the signals may be dependent on the
spectrometer operating frequencies and therefore should not be used when comparing spectra. Also these positions vary with the solvent used. However, coupling constants,
denoted as J and measured in Herz, reflect the splitting between adjacent protons into doublet and triplet signals,
etc. They depend on the chemical environment the nucleus is
in, and are not affected by the variation in spectrometer operating frequency (Harris, 1986). As a result coupling
constants are characteristic of structural features and
useful in the structure determination of the sample; they
may be used when comparing spectra.
the difference of absorption between the peak of Interest
and the THS standard (Bovey, et al., 1988). Also the
chemical shifts of a variety of solvents used In the NHR are
knovn, and may also be used as an Internal reference for the
III. EXPERIMENTAL
III.A. MATERIALS
The test compounds, benzCj3aceanthrylene (BjAA),
9,10-oxide, BJAA-7,8-oxlde-9,10-dlhydrodlol and BjAA-9,10-dlhydrodlol (BjAA-9,10-dhd) used In the Ames mutagenicity assay, and the BjAA-9,10-dlhydrodlol and cyclopentafused benzoCelpyrene (cpBeP), used In the
metabolite generation procedure were synthesized by Dr. Ramlah Sangalah at the University of North Carolina.
The S. typhlmurlum strain TA9a used In the Ames mutagenicity assay was acquired from Dr. Bruce Ames, University of California at Berkeley. The reagents needed in preparing the minimal and top agar were agaz—agar, gum from U.S Biochemical Corp. (Cleveland, OH), dextrose from E. M. Science (Cherry Hill, NJ) and hlstldlne and blotln from Fisher Scientific (Fair Lavn, NJ). The Vogel-Bonner
medium E (50X) Included in the agar preparation consisted of
i^agnesium sulfate, citric acid, potassium phosphate,
monobasic, and ammonium phosphate all purchased from Fisher Scientific. The overnight cultures were grown in Oxoid Nutrient Broth #2 from Oxoid Ltd. (Basingstoke, Hants,
England). The S9 mix consisted of Aroclor 1254 induced rat
concentration 38.7 rag/ml» and HADP* and
fl-D-glucose-6-phosphate from Boehrlnger-Hannhelm (West Germany), magnesium
chloride from J.T. Baker Chemical (Philllpsburg, NJ),
potassium chloride from Fisher Scientific, and IX phosphate buffered saline, pH 7.5 from the tissue culture facility at the Lineberger Cancer Research Center at the University of
North Carolina.
Controls used in the Ames assay were 2-anthramlne from Sigma Chemical Co. (St. Louis, MO) and 2-nltrofluorene from Aldrich Chemical Co. (Milwaukee, WI). The controls and test
compounds were dissolved in dimethyl sulfoxide (DHSO)
purchased from Fisher Scientific.
The Aroclor induced rat liver S9 used to generate metabolites from the BjAA-9,iO-dihydrodiol and cpBeP was
obtained from Hoi Tox, lot# 258, 264 and 312 with the
following protein concentrations 38.7 mg/ml, 39.8 mg/ml and 43.7 mg/ml, respectively. The potassium phosphate buffer, pH 7.5 was made from potassium phosphate, dibasic, from Hallinckrodt (Paris, KY) and potassium phosphate, monobasic, from Fisher Scientific. The pH of the buffer was measured with an American pH I meter from American Scientific
Products (McGaw Park, XL). After the incubation, samples were extracted with HPLC grade ethyl acetate purchased from Baxter Health Care Corp. (Huskegon, HI) and HPLC grade
48 Solvents used In high pressure liquid chromatography (HPLC) were HPLC grade methanol purchased from Baxter Healthcare Corporation, and dlstllled/delonized water courtesy of Dr. Hark Sobsey at the University of North Carolina. The dlstllled/delonized water was generated from a Dacor water system (Durham, NO consisting of 1 pm mllllpore prefliter, a carbon resin, two delonlzlng resins,
a macro reticular column to remove residual Cl~ and
particulates and a 2 pm mllllpore postfliter.
The naphthalene-1,2-dlol and the 1,2-naphthoqulnone used for NHR analysis were purchased from Aldrlch Chemical
Company, Inc. (Milwaukee, WI).
III.B. METHODS
III.B.1. Ames Mutagenicity Assay Procedure
BjAA and several other metabolites thought to be responsible for Its mutagenicity were tested In the Ames assay. The assay procedure Is a modification of the EPA HERL Report (Claxton, et al., 1982) and Is described
briefly. The master plates were prepared from frozen stock
cultures that were stored at -80°C. The S. tYphimurium
strain TABS stock was removed from the freezer, quickly
thawed, and used to Inoculate nutrient broth and Incubated
amplcxllln resistance (presence of the R factor plasmxd),
uvrB and rfa mutations, and hlstldlne and blotln auxotrophy
according to the EPA HERL Report (Claxton, et al., 1982). Acceptable master plates vere securely wrapped In foil and
in plastic, and stored at 4°C. Hew master plates were
prepared every 4-6 weeks.S9 concentrations of 774 pg/ml (50%), 1548 pg/ml (100%), 2322 pg/ml (150X) and 3096 pg/ml (200X) were used in the experiments based on preliminary experiments performed by Ravinder Singh in Or. Ball's lab. The S9 was prepared
with 92.4 mg of NADP^ and 42.4 mg of glucose-6-phosphate
dissolved in 10 ml of sterile IX phosphate buffered saline (PBS). This solution was sterilized by passage through a 0.22 p filter into a sterile flask on ice. To the sterile solution, 600 pi of salt solution, 1.65H KCl-»-0.4H HgClo, was
added followed by the appropriate S9 concentration C600 pi
(50X), 1.2 ml (100%), 1.8 ml (150X) and 2.4 ml (200%)]. Sterile IX PBS was added to yield a final volume of 30 ml.
Five concentrations of PAH, 0.5 pg, 1.0 pg, S. 0 pg, 10.0 pg and 20.0 pg, dissolved in sterile DHSO were tested.
The nutrient broth was inoculated with strain TA98
S. typhimurium from a master plate, and allowed to grow
14-16 hours at 37°C. The culture was then placed on ice
prior to and during the assay. Helted top agar containing 100 pi of culture, 100 pi of test compound and 0.5 ml of S9,
50
plate. After the top agar had solidified, plates were
inverted and incubated at 37^ C. After 48 hours the plates
iwere counted or refrigerated and counted at a later time. Assays for each compound were done in duplicate or
triplicate on at least two separate days.
Control plates for spontaneous background counts
contained 100 pi DHSO in lieu of the test compound in the presence of 50% and 100% S9, and in the absence of S9.
Plate counts ranged from 20-50 colonies/plate. 2-Anthramine in sterile DHSO, 0.5 pg/plate vith 0.5 ml 100% S9, and
2-nitrofluorene in sterile DHSO, 3 pg/plate, without S9
served as the positive controls.
The number of colonies were averaged and standard
deviations were calculated for each dose. Dose-response curves were generated for each compound. From the slope of
the linear portion of the dose-response curve, the specific
activity of the compound was calculated and recorded in
revertants/nmole.
III.B.2. Hetabolite Generation Procedure
To determine the oxidative metabolites formed in BjAA-9,10-dihydrodiol and cpBeP by cytochrome P-450 a modified procedure of Nesnow and colleagues (Nesnow, et al., 1984)
was utilized. The incubation mixture contained
5 pmole NADP* , 22.5 pmole B-D-glucose-6-phosphate, 15 pmole
(PAH) dissolved in 100-200 pi of acetone in a 5.0 ml volume.
Aroclor 1254 induced rat liver S9 was added in a
concentration of 1.0 mg/ml (approximately 26 pi) for BjAA-9,10-dihydrodiol and 4.0 mg/ml (approximately 104 pi) for
cpBep. Five milliliters of incubation mixture was aliquoted into a 25 ml Erlenmeyer flask and incubated in a Techne SB16 Shaking water bath at 37°C for 15 minutes. For the
BJAA-9,10-dihydrodiol large scale incubations,
3.0-3.5 mg/incubation of compound was used. The small incubations consisted of 0.5-1.0 mg/incubation. Two incubations of approximately 3.6 mg/incubation were done for
cpBeP.
The incubation mixtures in the 25 ml Erlenmeyer flasks were pooled for each compound and extracted 1:1 with ethyl acetate:acetone (2:1), three separate times. The organic fraction was concentrated by rotary evaporation (Buchi Rotavapor, Flawil, Switzerland) to a 1-5 ml volume. The sample was then transferred to a scintillation vial. The round bottom flask was rinsed with either methanol, acetone or ethyl acetate and the rinse was added to the scintillation vial. The sample was evaporated to dryness
under nitrogen.
52 The above incubation procedure vas modified for optimal
dihydrodiol dehydrogenase activity to obtain a high yield of the BjAA-9,10-dihydrodiol peak 7 for identification purposes
(Vogel, et al., 1980). This second incubation mixture
consisted of 5 pmole NADP^ , Aroclor 1254 induced rat liver
S9, 5.0 mg/ml (approximately 130 pi), 100 mM glycine buffer, pH 9.0, and 300 nmoles of PAH (dissolved in 50 pi acetone)
in a 1.0 ml volume. The tubes vere placed in a shaking
water bath for 15 minutes at 37°C. The pH vas checked
before and after shaking, and ranged from 8.4-8.6. The
amount of compound incubated at one time ranged from
0.5-1.5 mg. The control incubation consisted of one tube of
the same components with the exception of the rat liver S9.
The tubes vere pooled and extracted 1:1 vith ethyl acetate:acetone (2:1), three separate times. The organic
fraction vas concentrated under nitrogen, and separated by HPLC.
III.B.3. High Pressure Liquid Chromatography
The HPLC system consisted of an Isco Model 2300 HPLC
pump vith a Model 2360 gradient programmer (Lincoln, HE) and a six valve Rheodyne injector (Cotati, CA) vith 20 pi, 100 pi and 500 pi injection loops. HPLC profiles vere recorded on a Spectra Physics SP4270 integrator (San Jose, CA), 0-1 V


![TABLE 1: Mutagenicity of benzCj]aceanthrylene metabolites in S. typhiwuriua strain TA98 in the presence of S9, 0](https://thumb-us.123doks.com/thumbv2/123dok_us/8336444.2213005/68.1182.116.1095.70.706/table-mutagenicity-benzcj-aceanthrylene-metabolites-typhiwuriua-strain-presence.webp)
