Combined Spatial Analysis of Climate Change and Ethnic Conflict in Africa
By Paul Irby
A Thesis submitted to the faculty of the University of North Carolina in partial fulfillment of the require- ments of a degree with Honors in
Political Science.
2017
Approved by
_________________________________ Adviser
_________________________________
1
Abstract
Climate change is anticipated by many to impact nearly every aspect of society in some way in the coming century. A potential to jeopardize security, especially in underdeveloped countries, is a claim commonly accepted by intelligence and security organizations but hotly debated in a growing body of scholarly literature. This study builds upon spatial methodology used in previous studies, and attempts to bridge outcomes to environmental and social context in a sample of 10 countries across Sub-Saharan Africa. The relationship between temperature change, precipitation variation from normal, ethnopolitical marginalization, and the existence of conflict was analyzed using disaggregated spatial and statistical methods, under the hypothesis that climate variation will correlate positively with conflict especially when it occurs in areas with marginalized people. The study finds some support for this hypothesis, indicating positive relationships with varying predictive strength among temperature and marginalization, but statistically insignificant results for precipitation. Logistic regression gave coefficients of 0.11 for temperature change (°C), and 0.31 for marginalization when conducted on the entire sample. The study finds that the impact of all independent variables varies dramatically based on
2
Introduction
In the coming century, anthropogenic climate change will have far reaching impacts on global environmental systems and the quality of life for hundreds of millions of people. A preponderance of empirical evidence indicates that human activity since the industrial revolution has accelerated warming of the atmosphere. Estimates for the magnitude of global average warming range from 1℃ to 4+℃ depending on the rate and effectiveness of efforts to curb emissions (IPCC 2013). Such temperature change is predicted to invoke secondary impacts on hydrologic and ecologic systems. These impacts include an expansion of arid lands, higher frequency of intense weather patterns such as storms and droughts, shifting of the geographic ranges of certain ecosystems, altered precipitation patterns and freshwater availability among a myriad of others (Watson et al., 1998). Such large-scale shifts in the natural environment will invariably influence human ecosystem dynamics as well. Habitability of certain areas threatened by high temperatures and/or limited water availability, agricultural yields diminished by droughts and precipitation variability, coastal populations threatened by rising sea-levels, damage to infrastructure, spread of vector-borne diseases, and mass migration are all potential outcomes. When humans are subjected to these outcomes, many claim that climate change has an additional tertiary impact: inducing armed conflict.
3
security implications of climate change stem from prominent cases of conflict which can be tied to instability in the physical environment. Many scholars connect the 2011 Syrian uprising and resultant migrant crisis to a drought that occurred in the 5 years prior. This drought exposed decades of land and water resource mismanagement and caused rapid urban migration, which when combined with a repressive dictatorship and a blossoming extremist movement led to unrest (De Chatel, 2014). Similar environmental conflict narratives exist for cases across Sub-Saharan Africa such as the Darfur conflict in 2003 (Mazo 2010), tensions between the Guji and Burji peoples in southern Ethiopia (Debelo 2012), Fulani herdsmen encroachment in Nigeria (Odoh and Chigozi, 2012), and potentially even the Rwandan genocide (Percival and Homer-Dixon, 1996). This circumstantial evidence requires proper scientific support, however, in order to accurately claim that such conflict scenarios will worsen due to climate change. A significant but incomplete body of empirical research measuring the existence of a climate-conflict
relationship has varying and inconclusive results, demonstrating the difficulty of quantifying the complex nexus of elements that contribute to conflicts in general. In context, climatic factors are mostly described as only having an “aggravating” effect on existing conflict triggers.
This study builds from the (in)conclusions and methods of past studies, contributing to the relatively sparse amount of evidence derived from one specific methodology: spatial
4
variables, ethnopolitical marginalization is proposed to have an amplifying effect on the relationship. The second hypothesis is that the combination of climate anomalies and
marginalization are more spatially correlated with conflicts than either variable alone. Spatial and multivariate logistic regression analysis was conducted on social conflict events, climate data, and the distribution of marginalized groups from 1997-2013 in a sample extent that includes 10 Sahel and Central African countries.
The study finds a positive relationship between conflict and temperature, and an
5
Literature Review
The connection between climate change and propagation of armed conflict in developing regions such as Sub-Saharan Africa continues to be a young and constantly growing field of research. The widespread publication and distribution of climate change research itself began only a few decades ago with the first International Panel on Climate Change report in 1990. These works, published periodically leading up to the most recent 5th edition, represent the
exhaustive conglomeration of current climate change research from the top atmospheric scientists. Past reports focused primarily on the scientific basis for climate change, modeling trends and providing evidence for the concept itself. To give some perspective on the recency of research focusing on causal links between climate change and security, a section detailing security concerns related to climate change only first appeared in the most recent IPCC report published in 2014. The report concluded that human security will be threatened by climate change as it intensifies, but the relationship between armed conflict and climate change requires further research to determine a causal theory (Adger et al. 2014). It specifically mentions Africa as a heavily studied region in the research. The Sub-Saharan region is highly indicative of climate change sensitive drivers of conflict, and also displays a relationship between areas with institutions that possess an ability to mitigate climate change effects and volume of violent conflict.
Despite being a fairly new theory in relation to climate change specifically, the prevailing themes of this question have been present in social sciences for some time. The concept of “environmental conflict” stems from a scarcity model first introduced by the influential scholar Thomas Malthus in the early 19th century. Although his focus was specifically on population
6
primary causal explanation for correlations between climate change-affected regions and higher levels of conflict. A simple neo-Malthusian model would explain that climate change puts pressure on certain vital resources, limiting their supply, which leads to increased competition for those resources locally, or conflict elsewhere as people move in search of that resource. This model is especially applicable to Sub-Saharan Africa due to the high level of importance placed on the physical environment by many of its inhabitants through subsistence farming, and a high potential for institutional deficit in providing resources when scarcity arises. For many Sub-Saharan Africans, subsistence farming is the only means of obtaining adequate nourishment (Hansen 2008). Homer-Dixon identifies four “social effects” of environmental change that can drive conflict, those being decreased agricultural production, economic decline, population displacement, and disruption of authoritative and legitimized institutions [Year].
7
although possessing a substantial effect, is outweighed by other covariates. This informs the role of climate as a catalyst for conflict, rather than a cause.
Public and academic attention to this issue initially ramped up in 2009 with the study by Burke et al. brazenly titled “Warming Increases the Risk of Civil War in Africa”. This represents the first comprehensive study of an African climate-conflict relationship, the results of which are applied as a predictor for future conflicts based on climate projections. The study found that a 1° increase in temperature resulted in a 4.5% greater likelihood for civil conflict in all countries, and an 11% increase in countries that historically experience conflicts, using this information to predict a 54% increase in conflicts by 2030 due to climate change (Burke et al., 2009). Other studies find similar evidence, but varying in extent of the effect, supporting the assertion that climate anomalies correlate with higher numbers of conflict (Hendrix and Salehyan, 2012; O’Loughlin et al, 2012; Raleigh and Kniveton, 2012). Many studies find no relationship or inconclusive evidence for a relationship, however (Thiesen, Gleditsch, and Buhaug 2013). The Burke study is unique because it is largely forward-thinking, focusing less on causal explanations for the relationship, but rather applying a correlation to future climate change predictions in order to quantify the potential increase in conflict to be expected. Studies such as this one
represent a recurring “deterministic” theme in the literature that garners some criticism (Salehyan 2007). Salehyan warns against simplifying the relationship and disregarding the role of political institutions in adapting to and mitigating environmental conflict, emphasizing that the majority of resource scarcity and mass migration scenarios have not result in violent conflict, even in underdeveloped countries.
8
of conflict in the region are much more complex than the simple neo-Malthusian causal chain. Raleigh and Kniveton (2012) explore such a “zero sum” explanation where groups compete for diminishing resources, but also present evidence for “abundance” scenarios where rent-seeking occurs during times of prosperity. Their analysis, and much of recent climate conflict research, is centered on variability rather than pure scarcity. Inspecting variability in rainfall patterns, an increasing trend likely due to climate change, they found evidence for heightened conflict during both drier and wetter periods. My research will use this dual-sided perspective on the issue, using temperature and rainfall anomalies as two of the independent variables.
O’loughlin et al. (2012) also uses small scale variability weighed against an aggregate conflict database. They pursue a geographic approach to conflict and climate in East Africa, conducting spatial analysis on both temperature and rainfall variations from the mean pitted against the location and number of conflicts. The study focuses on location specific events by controlling for political and geographic boundaries in a 1° square grid rather than country-year analysis. Their findings are somewhat in contention with Raleigh and Kniveton, finding only that wetter periods correlate with a decreased risk of violence and that warmer temperatures
correspond to increased risk of violence. They found no effect of cooler or drier periods on conflict. This methodology provides the groundwork for the design of my study, however it falls short due to the omission of key social factors. Fjelde and von Uexkull conducted a more
comprehensive study in 2012, which includes the socio-political factors linking environmental stress to conflict. Their study not only suggests a positive relationship between rainfall anomalies and communal conflict but takes it a step further to explain that areas of high political
9
conflict. Such a comprehensive study gives more insight to the complex drivers of conflict in the region, and is regarded as a better statistical model, but utilizes no spatial component.
My research intends to utilize geographic data through spatial analysis, a method also used by Ide et al (2014) in their attempt to create a conflict risk model for Kenya and Uganda that incorporates presumed climate changes. Their conflict risk index (CRI) model uses a comprehensive set of variables including physical exposure to climate change, societal factors influencing the vulnerability to climate change, as well as other non-climate factors that drive conflict such as population and presence of democracy. Using this information, they constructed maps indicating which regions are prone to climate conflict. Ide et al.’s model is both complex in the number of variables utilized, but relies on many assumptions regarding the specific effect of each variable on conflict. The use of spatial analysis to model conflict prone regions is
compelling and is intended for future use on a larger sample size, however again the causal relationships between climate variability and conflict remain a contentious avenue of research.
10
with resources distributed through patron-client networks. This system, by design, favors the tribal or ethnic group at the center, and marginalizes those groups at the outer reaches of the patron-client networks. Groups marginalized to the greatest extent tend to be smaller local ethnic groups, nomadic or pastoral peoples, but the system disadvantages the ability for minority groups to obtain resources at the same level as the ruling group. The marginalization of certain
ethnopolitical groups by system design sets the context for tensions against a government unable to provide adequate resources under scarcity scenarios.
In attempting to disentangle the causal chain of climate change and conflict, many scholars have begun to look to political marginalization as the connecting factor. Although some studies have refuted the claim that civil war occurrence is greater in ethnically diverse countries or those ruled by an ethnic minority (Fearon and Laitin, 2003; Fearon et al, 2007), these studies have a more global focus. Considering the neopatrimonial and postcolonial context of African states, the contention that conflict can be triggered by ethnic diversity and marginalization remains worthy of study in the climate context. Clionadh Raleigh inspects the causal
mechanisms connecting ethnopolitical marginalization and conflict, the conclusions from which will lay the foundation of the variables to be used for my analysis. That study is qualitative in nature, but describes the extent of political economic exclusion of certain ethnic groups, and how this increases vulnerability and inability to handle environmental shocks for marginalized
groups. It calls for further empirical research on this relationship, with emphasis on spatial distribution as the most effective method to analyze the ethnopolitical topography (Raleigh 2010).
11
conflict events, drought, and ethnic distribution in 0.5° gridded cells under the hypotheses that drought increases the local risk of civil war and that these effects are larger in politically
marginalized areas. They found little evidence to indicate a connection between drought and civil war, but strong evidence showing conflict events occurring in areas of high political
marginalization and other factors. They conclude that although no clear relationship was discovered between drought and conflict, that it plays some role and requires further research. I utilize much the methodology used in the Thiessen et al. study, but widen the scope of analysis to focus on social conflict using the ACLED database and include an independent variable for temperature, while limiting the geographical sample of states to 10 located within vulnerable Sahel, Central, and East African regions.
12
across a selected region at a standard resolution. This aids in contributing to the meager and largely inconclusive body of spatial evidence for the climate-conflict claim, while analyzing this claim against a specific explanatory factor.
Theory
My theory of climate change induced conflict, in line with much of existing conflict theory in Africa, hinges on the influence of instability and marginalization. Climate change is predicted to bring higher average temperatures and varying dramatic shifts in rainfall patterns to much of the African continent. Hydrologic systems that incorporate both atmospheric
13
most African subsistence farmers or pastoralists do not have the wealth to insulate against periods of low production, and a more general difficulty to acquire resources when localized supplies are threatened due to inequity in resource-distribution infrastructures. The nexus of these factors demonstrate the significance of human-environment relationships in this region and how it contributes to a system of political ecology.
Other elements beyond direct dependence on agriculture can connect environmental change to violence. The effects of sustained shocks like multi-year droughts can be felt throughout the economy of an agricultural state, and availability of vital resources may be threatened even for groups not directly tied to the land. The degradation of a common resource such as a shared freshwater source, can provoke conflict between groups who were peaceful when the resource was plentiful. Conflict may arise due to the movement of populations as well. Degradation of a resource in one place may force the people of that area to move elsewhere in order to sustain their livelihood. Common examples of this are nomadic pastoralists in search of water and grazing land for their livestock, or destitute farmers relocating to urban centers in search of employment. Displaced populations sometimes experience aggression when they impede on territory or threaten the resource share of the destination population. Additionally, a glut of unemployed and desperate young men in urban centers can be easily swayed by militant and extremist groups who offer food and shelter in exchange for military service. Large
populations of economically stressed individuals with common strife and without peaceful institutional means to express their distress, can turn to rioting or small-scale violence as protest or a way to improve their situation, especially when hot weather induces irritability. The
14
determining drivers of conflicts in general. While the theory does not claim that climatic shifts invariably lead to more conflicts, it does identify the importance those shifts can have in certain contexts, and the ability to increase the likelihood of conflict over a status-quo scenario. The first argument is that when economic or resource stability is threatened by changes in climate, people have a greater tendency to resort to violent measures to meet their needs.
H1: Temperature and precipitation anomalies are positively correlated with probability of
conflict.
15
obtain resources from the central authority through peaceful means under scarcity scenarios, and I also argue that a history of inaccessibility to national wealth for ethnically marginalized groups makes them less insulated to income shocks and can brew dissatisfaction attributed to ethnic identity.
Violence in this scenario can be explained as a means for “have-nots” to compete with the “haves” under exogenous pressures, but also as a catalyst for existing ethno-cultural tensions to boil over into conflict. Scarcity scenarios can highlight ethnic differences between groups competing for a common resource. On a small scale this can manifest as two ethnically distinct groups that employ identity-based tactics to fight for control over a shared environmental
resource such as a water body, as evidenced by the Guji-Burji conflict in Ethiopia. On a national scale, the common resource could be interpreted as share of national wealth or political
influence, the importance of which is heightened when environmental shocks or changes threaten the livelihoods of certain regions. Neo-patrimonial hierarchies of ethnicity further balkanize ethnic groups, leading to dissatisfaction with the political or economic regime for groups with sub-optimal shares of national resources, and greater potential for civil and social unrest. Scarcity, or surplus, of environmental resources can also benefit existing militant groups with extraneous political or religious aims. Control of a vital scarce resource such as a body of freshwater or agricultural fields exerts an immense level of control over the surrounding
16
groups can be a source of income during times of economic stress, leading to higher conscription rates in rebel armies.
H2: The relationship between climate variability and conflict is stronger where the primary
ethnic group is marginalized.
The complexity of possibilities for climate-related conflict scenarios highlights the need for contextualized analysis of this phenomenon. This can be achieved through the qualitative spatial analysis that identifies certain areas that display any especially strong or interesting relationships, and uses case studies of that specific occurrence to understand how the climate-conflict link varies in different geographic or political contexts. It is unlikely that the same correlation exists across all contexts of the sample area, but rather this research aims to understand the spatial environments that may or may not be at risk for future climate-related conflicts. In addition to analyzing the effect of the physical environment on human behavior, the sociological environments of ethnopolitical hierarchy are necessary to inspect as well. The combination of these factors, environmental and human, with their highly nuanced and
interconnected systems constitutes one piece of the complex fabric of contemporary conflict in Sub-Saharan Africa.
Methods
17
relationship between the variables. Many more recent studies utilize spatial methodology that allows researchers to shift the scale of analysis in order to focus on sub-state actors and localized climate factors. Following this trend, this study utilizes a disaggregated spatial approach that enables a higher level of detail and uniformity in the analysis. Because both the impacts of predicted climate change and the propensity for conflict depend on localized geographic and politico-economic factors, the emphasis of analysis is placed on the spatial distribution of the selected variables. Climate change and conflict are each inherently spatial phenomena, and are examined as such.
The independent variables of the study are temperature change, precipitation variation, and the extent of ethnopolitical marginalization. These variables were processed into individual and mosaic raster map layers, and then analyzed against the distribution of the dependent
variable: the density of conflict events. The sample of raster cells lie in a horizontal band near the equator from Western Eastern Africa, encompassing 10 countries and 4,565 individual cells. Nigeria, Cameroon, Central African Republic, Democratic Republic of Congo, Chad, Sudan, South Sudan, Uganda, Kenya, and Ethiopia are included in the study. These states were selected in order to improve the future application of the study, due to greater susceptibility in this region to the effects of climate change, and a prevalence of ethnically motivated conflicts in the past. The sample was also selected to include a broad spectrum of climate conditions, from the lower bounds of the semi-arid Sahel region in Sudan and Chad, to the dry savannahs and highlands of Kenya and Ethiopia, and further south into the equatorial rainforests of the DRC and Uganda. This geographic area was divided into uniform square gridded cells of 0.5 degrees
18
independent variables in the area they encompass. This gives separate layer packages for each year within the temporal scale of 1997-2013.
In order to properly build from the research design constructed by Theisen et al., similar data sources were used when available. As with the Theisen study, data measuring
marginalization was generated from the Ethnic Power Relations (EPR) dataset. This spatial dataset contains polygons displaying the settlement area for major ethnic groups, and codes these groups based on their level of political inclusion within the government of their country. This coding also follows changes in political inclusion over time, so separate spatial representations were generated for each year in the timeframe. The EPR polygons were then converted to a gridded raster layer to facilitate combination with the climate variables, and coded “1” for marginalized ethnic groups (MEG) or “0” for groups with all or some share of power. MEG are those whose power status is classified as Regional Autonomy, Irrelevant, Discriminated, or Powerless by the EPR dataset, indicating that political leaders of that group are excluded in some way from participation in the central government of the country (Wimmer et al., 2009). The EPR dataset ends in 2010, so 2010 EPR values were extrapolated to the remaining years in the study.
19
included in the Theisen study, was retrieved from the Global Historical Climatology Network Climate Anomaly Monitoring System (GHCN CAMS) monthly land surface temperature
analysis. It gives individual monthly mean temperatures from 1948 to the present, along with the long-term monthly mean calculated from 1980-2010 (Fan and Dool, 2007). To calculate the yearly change, the individual month values were averaged to give a yearly average temperature, which was then subtracted from the average of the previous year. This methodology potentially limits the ability to analyze the aggravating effect of the extreme short-term temperature
variations which could be lost when averaging, however broader temperature trends were preserved. The data selected for these climate factors serve as a moderate predictor of drought conditions, and allow for more specialized analysis of climate impacts than use of a drought index. Under climate change scenarios, some regions in the area of study will receive
significantly more rainfall rather than less, and may only witness negligible temperature change. Understanding the climate-conflict relationship beyond the simple expectation of drought is fundamental to the goals of this study.
Data for conflict events was retrieved from the Armed Conflict Location and Event Database project (ACLED), which includes all violent events in the period 1997-2015. This source places greater emphasis on small-scale social conflict than the UCDP, containing 36,656 events that range from riots to civil war conflict events. The “protest” and “strategic
20
compiled and organized annually, spatial statistical analysis was performed to delineate any geographical relationships between the variables. Many regression models were applied to the data, but the Generalized Linear Model was found to be the most accurate and intuitive model, as it also accounts for any potential random effects in the results. Three versions of this model were run. Model 1 with just the EPR data and controls, Model 2 with only climate variables and controls, and Model 3 with all three independent variables. Changes in the coefficients and odds ratio for each variable were tracked to determine their relative strength in each model. In addition to the quantitative multivariate analysis, qualitative visual analysis was performed to describe relationships, or lack thereof, that may have been missed through statistical analysis and to place statistical findings in their proper context.
In order to account for exogenous factors, a few control measures were utilized by including some other variables in the regression. The natural log of total population for each cell was included, the data acquired from Gridded Population of the World v.3. Codings for the relative level of democracy was also joined to the dataset at the country level, and included as input in the regression. Controls not included from the Theisen methodology are the dummy variable for capital cities because of the broadening of scope to include social conflict; the buffer for state borders because their importance may be insignificant for marginalized groups living on the fringe of their countries; and the conflict history decay function, because of the potential for climatic factors to exacerbate existing conflicts.
Results
21
cumulative relationship between the variables. The qualitative trend assessment represents the initial findings of this study, and is meant to provide supporting details for the story of conflict in this region. The actual propagation of conflict events, as opposed to non-violent disagreement between groups, is very much a result of a multitude of developments that comprise what will be referred to here as the contextual conflict narrative. The goal of the qualitative assessment is to tell this narrative to the best of my abilities, using environmental and ethnic marginalization factors as explanatory tools. The first section of results will progress from 1997 through the end of the time series in 2013, discussing the trends displayed in the spatial data frame. The strength of qualitative assessment is in explaining the trends and triggers behind past events, but
unfortunately it is not that good for providing empirical evidence for relationships that can be applied to future conditions. Such empirical evidence is established in the quantitative statistical analysis conducted and described in the second part of this section. There, multivariate
regression analysis is performed using all variables over the entire time-series in order to delineate macro trends in the data, and to inform a potential comparative risk model for future events.
Spatial Trends
22
relationships with conflict depending on latitude and the physical environment of the event. In the terminally dry Sahel and lower Sahara region to the north of the study area, years with less precipitation often saw more conflict, whereas in the wetter tropical areas like the eastern DRC and Uganda conflict was apparently often associated with more rainfall. This fundamental difference demonstrates the complexity, and often dichotomy, of the climate-conflict
relationship, and reinforces the need for localized analysis that considers the environment as a unique and important factor in conflict risk. Assessment of spatial trends in these layers also gives valuable insight and visual representation of the environmental conditions of the prominent conflict events that occurred during the time-series, and whether climate may have played as much or as little a role as is suggested by the relevant literature and media. These illustrations include the pivotal drought and abundance conditions leading up to and accelerating the Sudan and Darfur crisis, the persistent dry conditions contributing to the devastating 2002 famine in Ethiopia and the Boko Haram uprising in Nigeria, as well as a trend of violence occurring in abundant rainfall years that follow an extended dry period.
23
unrest across Nigeria, and the genesis of the Darfur genocide. The EPR map shows some association with marginalized groups, especially in Sudan, Ethiopia and Uganda. From these maps, a reader can see that many conflict areas received greater than normal precipitation and had hotter temperatures, indicating a potential abundance scenario. As the discussion advances through the time-series, the maps located in the appendix of other years will provide valuable visual evidence of spatial trends to the reader, and convey any relationships that may not be explicitly discussed here.
24
region will further be referred to as the Great Lakes region. This period of low rainfall was roughly accompanied by the distribution of conflict events, primarily between the Ugandan government and various rebels groups such as the Lord’s Resistance Army (LRA) in northern Uganda, and those representing the First and Second Congo Wars. The time-series of this studies begins in Medias res a year after both of these conflicts began in 1996, so the causative
relationship is difficult to determine. 1998 and 1999 brought considerably warmer temperatures and extremely dry weather to much of the Congo, coinciding with the rejuvenation of tensions and the beginning of the Second Congo war in August 1998. Fighting spread across the country in 1999, following the dry areas each year before settling into the front along the Uganda-Burundi-Rwanda border where fighting would continue throughout the remainder of the time-series. Negative rainfall variation across Kenya in 1999 and 2000 also lead to an increase of unrest across the country, mostly expressed in the form of pastoral raiding (Kratli and Swift, 1999). This style of conflict also occurred along the Congo-Uganda border with the Ituri Conflict waged from 1999-2003. 2001 brought higher than normal rainfall and cooler temperatures to the Great Lakes region, coinciding with the concentration of the Ituri Conflict, providing an initial glimpse at the potential for abundance scenario conflict.
25
experienced negative rainfall years, which came to a head in 2002 with the especially dry and hot weather that incited widespread famine, and accompanied revamped fighting with ethnic rebel groups like the marginalized Oromo and Ogaden peoples in the west and east respectively (Brown 2008) (Notholt 2008).
Fighting in Ethiopia and eastern Sudan would calm somewhat in 2003, but would shift to the western province of Darfur in conjunction with rising temperatures and a prolonged period of less than normal rainfall. Interestingly, 2003 was a year in which the Darfur region actually received rainfall above the long term mean, potentially supporting an abundance scenario theory. Some reject the notion that the Darfur Genocide was influenced by negative changes in rainfall (Kevane 2008), but an abundance scenario claim has not been thoroughly investigated.
26
“don’t invade Russia in the winter” might need updating to “don’t invade a Saharan country when Earth is warming”.
Conflict in the Central African Republic presents possibly the most compelling
qualitative evidence for a correlation with precipitation. Various conflict events in the country from 2000-2005 coincide closely with changing negative precipitation patterns in the western part of the country leading up to the outbreak of the Central African Bush War in 2004. This conflict would persistent intermittently until the outbreak of the 2013 Coup detat, largely irrespective to precipitation patterns.
Back in the Great Lakes Region, the pattern of conflict remains fairly stable from 2002-2007, roughly resembling an upside-down horseshoe around Lake Victoria from eastern Congo through northern Uganda and into western Kenya. 2003 marked a pivotal moment in the
Congolese imbroglio with the onset of the ethnically driven Kivu Conflict, which would entrench DRC forces in this area along the Rwandan border through the end of the time-series in 2013. The area was generally drier than normal in 2002 and 2003, with an influx of precipitation in 2004 which accompanied the Bukavu Offensive and the first clash in the area. Again, the
abundance scenario pattern might have contributed to the origination of this conflict. In this case, the EPR dataset is perhaps the greatest indicator of conflict, as the area was a pocket of
“marginalized” people until 2004 when control of the area was gained by the dominant group. While the Kivu Conflict was nearing its apex in 2007, Kenya was experiencing its own crisis. An ethnic divide between supporters of the two presidential candidates boiled over when it was alleged that the winner of the election had done so illegitimately, leading to violence that
27
or temperature variation affected violence in the way predicted. Kenya experienced extremely dry and warm conditions in 2005, followed by a very wet year in 2006, normal weather in 2007, and dry conditions once again in 2008. The marginalization of the Luo and other non-Kikuyu peoples, and subsequent powershift following the conflict, is demonstrated by the EPR data, but the unrest does not appear to have been influenced by climate.
28
variation. It is important to note that the steady increase in conflict events over the course of the time series does not necessarily indicate greater violence, but rather could simply reflect
improved data collection and reporting on these events.
Mention of Nigeria and Cameroon has been absent from the discussion so far, and with good reason. Due to air and weather circulation patterns, the climate trends in Nigeria tended to work inversely to those occurring in the central and eastern regions of the sample area. Nigeria and Cameroon often experienced times of cooling when the rest of the sample was warming, and the same goes for precipitation. In this way, much like the tropical climate of E Congo, Nigeria contributes a unique perspective to the diverse array of environments present in the sample. This diversity exists even within the country, with dramatically different environments present in the wet coastal south and dry Sahel north. Additionally, the specific strength of ethnic factors present in Nigerian politics and dichotomy in conflict type by region make cause it to possess additional unique social factors as a part of its narrative. Cameroon is similar in geography, albeit with less Sahel area, but differs greatly in its propensity for conflict. Throughout the time-series it
experienced only a few conflict events. The narrative for the climate-conflict relationship and the absence of conflict in Cameroon will be discussed further below.
29
southern region, due in parts to a dense population, political unrest at the capital, and the ongoing animosity and conflict against the oil industry. Northern Nigeria transitions from a temperate climate into a semi-arid Sahel environment in its northernmost extent. This part of the state is inhabited by the Hausa and Fulani peoples, who are primarily Muslim. It is more sparsely populated, besides the Kano region, and agriculture is its primary industry and way of life. Tensions between the Muslim north and Christian South have long been an instigator of conflict, and a cause for political anxiety from both groups. This social environment is primed for climate instability to act as a catalyst for existing ethnic tensions. Such conflict would be expected to occur near the general line of ethnic divide across the middle of the country where ethnically and religiously diverse populations live in close proximity, and throughout the northern region where most depend on subsistence agriculture and where desertification is beginning to take root. It is important to distinguish these conflicts from the seemingly constant and independent presence of unrest along the coast.
30
2002 accompanied by further ethnic rioting, before cooling somewhat in 2003. Reduced
precipitation and warmer temperatures coincided with more ethnic violence in the central plateau region in 2004. From 2004-2008 a large amount of violence occurred near oil refineries in the southern Niger Delta, but these conflicts were largely unrelated to climate changes. Leading up to the outbreak of Boko Haram, Nigeria experienced a steady trend of warming every year and mostly less than normal precipitation. In 2009, temperatures skyrocketed in northern Nigeria at the same time that Boko Haram began its first campaign of violence in an effort to impose Sharia law on the entire country. This violence continued in the warmer and wetter year of 2010,
exacerbated by the unexpected death of the sitting president and political transition. From 2011 through 2013 violence incited by Boko Haram continued to ramp up especially in the northern region. This period was actually cooler than years before, but 2011 and 2013 presented
extremely dry conditions in central Nigeria. These results suggest conflict onset is correlated positively with temperature, especially coinciding with rioting in 2001 and the rise of Boko Haram in 2009, and correlated slightly negatively with precipitation.
Cameroon experienced the least number of conflicts of any country in the sample, most of which were results of interstate dynamics with neighboring Nigeria and Chad. Throughout the time-series Cameroon possessed no ethnic areas that were coded as being marginalized,
indicating a lack of conflict potential due to this variable. Any unrest that did occur was
31
crisis fleeing from the 2005 Chadian Civil War, and some spillover of violence perpetrated by Boko Haram from 2009-2013. Similar trends existed in eastern Cameroon where conflict spillover occurred due to civil wars in Central African Republic in 2007 and 2013. The peaceful nature of the Cameroonian state might be explained by the lack of a clearly marginalized group despite over 350 different ethnic groups, although it is not immune to the spread of Islam and the potential for ensuing violence from the north.
Statistical Analysis
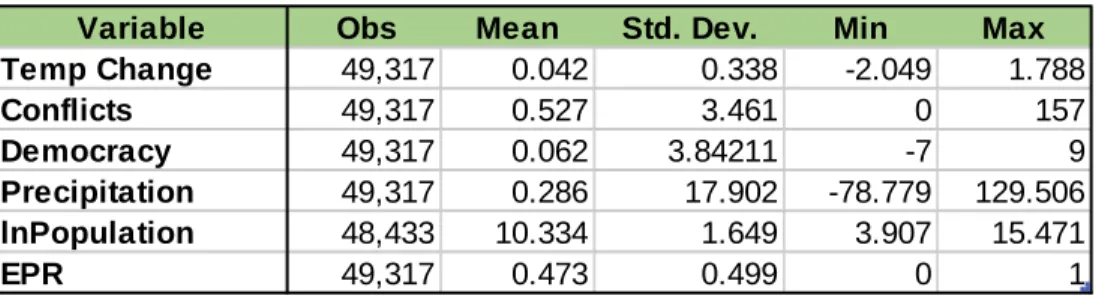
Summary statistics were calculated for each variable, and are displayed in Table 1 below. The average temperature change for any given cell was 0.04 °C, implying a relative equilibrium between positive and negative temperature change but with a slight upwards trend over the 16 year period. The most dramatic negative temperature shock was -2.04 °C in Sudan in 2011, and hottest change was an increase of 1.78 °C in South Sudan in 2000. Precipitation variation had an average value of 0.28 cm which means the long term mean was an adequate predictor of the normal value. The driest cell in the sample was in the DRC in 1998 and had a precipitation variation of -78 cm. The wettest was in Sudan in 2000 with an anomaly of 129 cm above average. EPR had an average right around 0.5 which indicates a near even spread of marginalized and dominant territory.
Table 1 Summary statistics for independent and dependent variables
Variable Obs Mean Std. Dev. Min Max
Temp Change 49,317 0.042 0.338 -2.049 1.788
Conflicts 49,317 0.527 3.461 0 157
Democracy 49,317 0.062 3.84211 -7 9
Precipitation 49,317 0.286 17.902 -78.779 129.506
lnPopulation 48,433 10.334 1.649 3.907 15.471
32
33
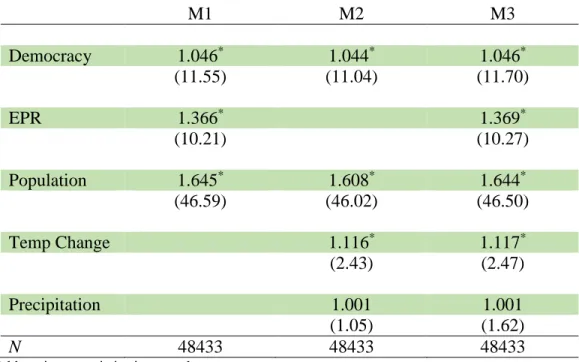
Table 2. GLM regression outputs using three statistical models
M1 M2 M3
Democracy 1.046* 1.044* 1.046*
(11.55) (11.04) (11.70)
EPR 1.366* 1.369*
(10.21) (10.27)
Population 1.645* 1.608* 1.644*
(46.59) (46.02) (46.50)
Temp Change 1.116* 1.117*
(2.43) (2.47)
Precipitation 1.001 1.001
(1.05) (1.62)
N 48433 48433 48433
Odds ratios; z statistics in parentheses
*p < 0.05
34
Model 2 in Table 2 tests climate variables as inputs for analysis, and shows a positive relationship for both inter-annual temperature change and precipitation variation, but with differing statistical significance. The findings for temperature change were the most significant of the study. According to the model used, every 1℃ increase in temperature from the preceding year is associated with an 11.6% increase in conflict probability. Although most cells rarely experienced temperature fluctuations greater than 1 degree within the time-series, fluctuations as high as 1.8 ℃ and as low as -2℃ were observed. The odds ratio for precipitation variation initially appears to be small, but further interpretation of these findings provides more applicable results. With a p-value of 0.1, the sample-wide results for precipitation variation were
indistinguishable from random and not statistically significant. Disregarding significance,
35
Both the climate and marginalization variables were included in Model 3, in order to test the second hypothesis that these individual relationships would be strengthened when combined. The results provide some support for this claim, as the odds ratio for all three independent
variables demonstrated marginal increases. The predictive power of marginalization increased by 0.3%, temperature change by 0.1%, precipitation variation by 0.05%. Although these are
certainly miniscule differences in the total risk percentage for conflict, the aggregate risk
increase for each variable is important to inspect as well. For the precipitation variation variable, for example, the relative impact on conflict probability increased by approximately 50% when marginalization was considered as a covariate. The interaction between these sets of variables may have not been as strong as predicted, but it is clear that there exists some amplifying relationship, and at minimum the inclusion of ethnopolitical marginalization allows for greater precision in the comprehensive model. When Poisson GLM regression was performed that measure the effect on the count of conflicts rather than a binary coding (Table 2 in appendix), the predictive power of the climate variables increased by over 100%. This indicates that climate has a greater impact on the severity of conflict, rather than a simple determinant of where any
conflict will occur.
36
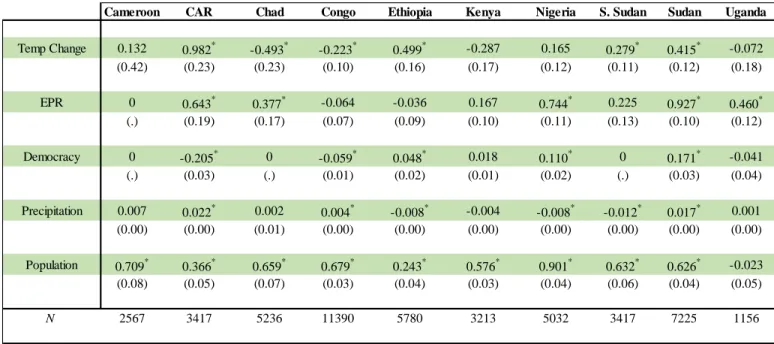
independent variables. Temperature change was shown to have a significantly stronger positive effect on conflict probability in Central African Republic, Ethiopia, South Sudan, and Sudan. These countries form a band across the northern portion of the extent, and could be classified as the Sahel States within the study (excluding Chad). A significant negative temperature
interaction was observed in the Great Lakes countries of Congo and Kenya, and in Chad. The groupings of these country-level results indicate a relationship influenced heavily by geography.
Table 3. GLM country level regression using M3
Geographic differences were also observed in the country-level results for precipitation, although not following the exact binary grouping as temperature. Ethiopia, Nigeria, and South Sudan showed a negative impact on conflict probability, a departure from the positive
relationship found across the entire sample extent, and implying that years with more
precipitation reduce the likelihood of conflict there. Other countries demonstrated insignificant deviations from the sample coefficient, except for Central African Republic and Sudan where the
Cameroon CAR Chad Congo Ethiopia Kenya Nigeria S. Sudan Sudan Uganda
Temp Change 0.132 0.982* -0.493* -0.223* 0.499* -0.287 0.165 0.279* 0.415* -0.072
(0.42) (0.23) (0.23) (0.10) (0.16) (0.17) (0.12) (0.11) (0.12) (0.18)
EPR 0 0.643* 0.377* -0.064 -0.036 0.167 0.744* 0.225 0.927* 0.460*
(.) (0.19) (0.17) (0.07) (0.09) (0.10) (0.11) (0.13) (0.10) (0.12)
Democracy 0 -0.205* 0 -0.059* 0.048* 0.018 0.110* 0 0.171* -0.041
(.) (0.03) (.) (0.01) (0.02) (0.01) (0.02) (.) (0.03) (0.04)
Precipitation 0.007 0.022* 0.002 0.004* -0.008* -0.004 -0.008* -0.012* 0.017* 0.001
(0.00) (0.00) (0.01) (0.00) (0.00) (0.00) (0.00) (0.00) (0.00) (0.00)
Population 0.709* 0.366* 0.659* 0.679* 0.243* 0.576* 0.901* 0.632* 0.626* -0.023
(0.08) (0.05) (0.07) (0.03) (0.04) (0.03) (0.04) (0.06) (0.04) (0.05)
N 2567 3417 5236 11390 5780 3213 5032 3417 7225 1156
BLM regression coefficients, standard errors given in parentheses *
37
probability impact was increased by 2% and 1% respectively. Interpreted in the context of a 50 cm increase in precipitation from normal, locations would be 100% more likely in CAR and 50% more likely in Sudan to experience a conflict in that year. When a 1 year lag was applied to these country-level results, the probability impact of positive precipitation variation increased
significantly in Cameroon, CAR, Chad, and Sudan, and became more negative in Nigeria and the Congo DRC. These findings indicate that increased precipitation in the Sahel/Saharan states of Sudan, Chad and CAR is likely to produce more conflict in the same and next years, whereas it is likely to reduce the probability of conflict in states such as Nigeria, South Sudan and Ethiopia. A consistent pattern was discovered in the Great Lakes countries between their current year and lag year results that supports findings from qualitative analysis. In Kenya, Congo, and Uganda, the impact on conflict probability became more negative when the lag was applied. Again
geographic patterns become clear in the country level results for precipitation, implying distinct groupings of results in Central Sahel, Great Lakes, and Periphery (Ethiopia and Nigeria) regions.
Country-level results for social indicators demonstrated differences as well.
38
Discussion
The results of this study, both spatial and statistical, furcate from the general pessimistic tone in the academic literature on the existence of climate-induced conflict. Since the idea was first proposed in the late 1990’s and accepted as public knowledge in the late 2000’s, continued research with more sophisticated methodology has resulted in growing skepticism among the field’s top scholars. The inability of many studies, including the Theisen et al study that inspired this thesis, to identify a correlation between these variables using a range of variable
operationalization and modeling methods has created doubt about the validity of this purported truism. In contrast to the growing lack of empirical support for this assertion, foreign policy and security authorities such as the US Department of Defense and the UN Security Council are incorporating instability due to climate change into their considerations for future conflicts. This inclusion is largely justified by qualitative case-study research on “climate wars” that are often compelling in their explanation of the localized phenomenon, but their existence has been shown to be difficult to replicate or model in large-n quantitative studies. Even in the results of this study, which has been limited to a subset of countries within a geographic area generally
regarded to be prone to this interaction, it is quite evident that the impact of each variable varies widely depending on an immeasurable number of contextual factors. The methodology of the study, by combining the use of qualitative and quantitative spatial methods, attempts to bridge the gap between the apparent trends identified in case studies and the inconclusive results of more impersonal statistical models.
39
generalized spatial relationships between variables, and created a valuable tool for analyzing climate-conflict interactions for specific cases and environments. Because the large-n statistical analysis was probably more useful in determining general trends, the facilitation of this localized analysis provided perhaps the greatest utility in the study. The primary finding of this
assessment, and an indicator of its usefulness, was that it became clear that changes in climate impact conflict likelihood differently across space. The ability to view changes in each variable over time illuminated distinct relationships that were geographically clustered and potentially based on differences in environmental characteristics. Interaction groups where phenomenon occurred similarly were roughly the Central Sahel, Great Lakes, and Periphery countries bordering a coast. The significance of the distinct trends identified in each region were then tested in the regression analysis, both across the entire sample extent and within each country. The combination of these two techniques provided a more comprehensive approach to study of a climate-conflict relationship, by bridging the gap between comparative case study analysis and disaggregated statistical regression. The specific findings of the study, and its limitations, are discussed further below.
In the semi-arid Central Sahel countries such as South Sudan, Sudan, Central African Republic and Chad (in some cases), there appeared to be a positive relationship between precipitation increase and conflict onset, especially when a 1 year lag was applied to conflict. This interpretation would support the proposed abundance scenario theory where a surplus of a resource, in this case water, facilitates conflict. In already dry environments, short term
40
variable operationalization used. Especially for civil war onset that involves organized combatant groups, an abundance of water would ease logistical challenges such as providing food and water for troops, and would generally provide better fighting conditions in these dry climates. This progression was evident with the Darfur conflict, where conflict materialized in a rainfall abundant year following a half decade of rainfall deficiency. The positive coefficients returned from country-level regression for the region largely supports this claim, with some minor inconsistencies. A common temperature correlation was also shared by these Central Sahel countries showing more conflict onset in years with warmer temperatures than the last. All of these countries, except for Chad, demonstrated significant positive coefficients that were mostly above the sample value. A spike in temperature in these already hot climates appears to be a stronger indicator for determining short-term conflict likelihood. These results make sense intuitively when hotter temperatures are viewed as an aggravating force on individuals. Additionally, areas inhabited by politically marginalized ethnic groups were very strongly correlated with conflict probability in these countries, similar to trends in the Periphery countries but contrary to trends in Great Lakes countries. The interaction of these factors in Central Sahel countries could be distilled by saying that years with hotter temperatures and above average precipitation are more likely to experience conflict, especially in areas inhabited by a marginalized group.
41
questionable in Nigeria and Cameroon. There were distinct cases of temperature spikes
accompanying conflict outbreak in Ethiopia and Nigeria. Considerably warmer temperatures in 2002 brought widespread unrest due to famine in Ethiopia, and heat across the entire sample extent in 2009 could have contributed to the rise of Boko Haram in Nigeria and fighting with the Ogaden Liberation Front in Ethiopia. Most notably, these countries displayed a negative
coefficient, or odds ratio less than 1, for precipitation variation. This indicates that in these environments more precipitation decreases, rather than increases, the likelihood of conflict. It can be inferred that negative precipitation variation contributes to conflict in these areas, which is supported by the literature on drought and pastoral conflict in Ethiopia and Nigeria.
42
interactions in these countries therefore might suggest that a significant relationship between climate change and conflict does not exist, or is too complex to quantify so simply, in this equatorial region.
The findings presented above and previously in the results section did possess their fair share of inconsistencies and shortcomings, however. It may seem that the discussion so far on a potential relationship is founded in an assumption that the relationship does exist, and/or
exaggerating the causative strength of the climate variables. This tone is not intended to cloud the results of the study, but is rather a reflection of the quasi-qualitative nature of the study that attempts to show what the relationship can be in certain predictable scenarios. Clearly the relationships discovered in the regression analysis were not consistent across the entire sample, and were even inconsistent within the geographically clustered interaction groups and within countries themselves. Results from Chad, for example, demonstrated that temperature increases reduced the likelihood of conflict which differed from trends present in all of its neighboring countries. Many of these inconsistencies likely diluted the strength of correlation for climate variables, but this in itself is an important takeaway of the study. Because climate almost always plays only a minor role or no role at all in conflict propagation, there will be countless
observations that do not support the hypotheses of this study. This has been identified as a limitation for almost all large-N studies on the topic, and it was a goal of this study to
supplement findings from such methods with a visual narrative that conveys the situations where climate may or may not have influenced the situation. Discussion on the many examples of climate shifts that did not lead to conflict was largely omitted for this reason.
43
availability and utilization of data for most of the variables. The methods of this study attempt to properly represent the real factors that influence conflict in this region in the most accurate way possible, but the ability to quantify and measure these factors is undeniably limited. Beyond the inherent complexity of factors contributing to conflict, the study was limited by the availability and accuracy of data. Since data could not be collected directly on the variables, the study relied on data that was already publicly available and was influenced by each source’s individual methods of collection. The ACLED dataset, for example, grew in the number of conflict events occurring every year not necessarily because there was more conflict occurring in the region, but likely due to improvements in event reporting and recording. Processing of climate data was also met with challenges since these datasets were only available with monthly totals/averages. Aggregating these values into yearly values may have diluted temperature extremes, or
inaccurately represented seasonal precipitation deviations and inter-annual trends. The data had other temporal limitations as well. The beginning and end of the time series were determined solely by the beginning of the ACLED dataset in 1997, and the end of the climate datasets in 2013. If more historical social conflict data and up to date temperature records were available, the study would have likely extended over a longer time-series and would have been better suited to model long-term changes.
44
of GDP, and the presence and quality of infrastructure, among others. A regretful omission was a coding that would indicate whether a conflict was new or a continuation of a conflict from the previous year. This would allow for greater delineation of how climate influences conflict onset, continuation, and/or resolution. Accumulation of a more comprehensive dataset that includes a myriad of social, political, and environmental variables will be vital to improving the predictive power of any statistical model applied, but could also open the door to highly sophisticated analysis utilizing the emerging modeling power of Artificial Intelligence and Machine Learning. Platforms such as Google’s TensorFlow have shown promise in modeling outcomes based on interactions of input variables in a variety of academic research and business applications, but as of yet have not been applied to climate-conflict research. Once the composition of variables that impact conflict in some way become more clear, all of these data points can be used to construct highly accurate and flexible models that can pinpoint an at-risk area weeks, months, or
potentially years in advance. This could significantly improve the ability of governments and organizations to allocate resources to prevent and resolve conflict as this trend continues to worsen due to climate change. Although the methods of this study pale in comparison of sophistication, its attempt to improve the resolution of data and understand the more complex factors behind a spatial relationship between climate change and social conflict are vital steps on the path to more accurate models.
Conclusion
45
year. Precipitation variation was shown to have an insignificant positive impact across the entire sample area, but provided significant results for many countries when analysis was grouped by country. Marginalization was shown to have the greatest effect on conflict probability, increasing it by 37% across the entire sample and with much higher probability in certain countries. The strength of the relationship for temperature and marginalization increased when all three variables were modeled together, but not precipitation. These trends differed dramatically from country to country, however, and subsample trend groupings became clear when analysis was conducted at different scales. Conflicts in Sahel, Great Lakes, and Coastal/Periphery countries all interacted differently with the variables. Such impersonal regression analysis tells only half the story, however, and the data map layers were assessed visually over time to better understand the trends that manifested. From this, key circumstantial findings included precipitation abundance and temperature spikes in the outbreak years of both the Darfur conflict and Boko Haram uprising, and predictable high temperature– low precipitation conditions in especially violent years in Ethiopia. These two methods bolstered each other, the spatial analysis providing visualization and easier interpretation of statistical findings, and the regression analysis testing the validity of trends identified in the maps. Using this combo methodology was extremely useful, especially for researchers geographically or culturally removed from the intricacies present in Sub-Saharan Africa.
46
than in the Rift Valley, which differs from the relationship present in the African Great Lakes and Congo Basin and etc. The answer to this question will almost always be a definitive “it depends”. Regardless of these differences, when disaggregated and analyzed the raster cells did demonstrate a significant relationship for both temperature and marginalization. These findings are applicable beyond the study and could have grave consequences under predicted climate change scenarios. Since the sample extent lies roughly on the equator, temperature is expected to increase by only 1.5° - 4° C by 2100 (Serdeczny et al 2015). It is difficult to extrapolate the impact of long-term increases from the methodology of the study, however one could infer that there will likely be more extreme temperature spikes in the future than were present in the time-series. This could translate to a significant increase in conflicts over time, especially when a positive feedback loop with precipitation is considered. Although precipitation did not show significant results for the entire sample area, there were important interactions discovered for the countries bordering the Sahara desert. As desertification is predicted to accelerate due to climate change, this relationship could strengthen and pose serious threat to populations living there. Threatened living conditions and resultant conflicts are likely to induce migration as well, which this study has shown to also be accompanied by unrest.
It is clear that further and more detailed study is required in this topic that better understands complex interplay between conflict risk factors. The spatial methods used in this study should be expanded, incorporating more country level variables and including more geographically organized data for each cell. Additionally, a more dynamic approach to analysis that can decipher results beyond yearly constraints, viewing monthly, daily, or decadal
relationships would expand the potential for analysis. Those modifications, and the ones
47
48
Works Cited
Raleigh, C. (2010), Political Marginalization, Climate Change, and Conflict in African Sahel States. International Studies Review, 12: 69–86.
BENJAMINSEN, T. A. and BA, B. (2009), Farmer–herder conflicts, pastoral marginalisation and corruption: a case study from the inland Niger delta of Mali. Geographical Journal, 175: 71–81.
Andreas Wimmer, Lars-Erik Cederman and Brian Min. "Ethnic politics and armed conflict. A configurational analysis of a new global dataset", in American Sociological Review 74(2):316-337, 2009.
Schneider, Udo; Becker, Andreas; Finger, Peter; Meyer-Christoffer, Anja; Rudolf, Bruno; Ziese, Markus (2011): GPCC Full Data Reanalysis Version 6.0 at 0.5°: Monthly Land-Surface Precipitation from Rain-Gauges built on GTS-based and Historic Data. DOI:
10.5676/DWD_GPCC/FD_M_V7_050
Fan, Y., and H. van den Dool (2008), A global monthly land surface air temperature analysis for 1948-present, J. Geophys. Res., 113, D01103, doi:10.1029/2007JD008470. Odoh, S. I., P., & Chigozie, C. F. (2012). CLIMATE CHANGE AND CONFLICT IN
NIGERIA: A THEORETICAL AND EMPIRICAL EXAMINATION OF THE WORSENING INCIDENCE OF CONFLICT BETWEEN FULANI HERDSMEN AND FARMERS IN NORTHERN NIGERIA. Arabian Journal of Business and Management Review (Oman Chapter), 2(1), 110-124.
Domke, Michael. (1997). Civil War in the Sudan: Resources or Religion?. Ice Case Studies Alao, A. (2007). Natural resources and conflict in Africa: the tragedy of endowment.
Rochester, NY, USA: University of Rochester Press.
Brown, M. E. (n.d.). Case Study: Ethiopia and the 2002–2003 Food Security Crisis. Famine Early Warning Systems and Remote Sensing Data, 239-256. doi:10.1007/978-3-540-75369-8_14
Buhaug, H., Cederman, L., & Rød, J. K. (2008). Disaggregating Ethno-Nationalist Civil Wars: A Dyadic Test of Exclusion Theory. International Organization,62(03).
doi:10.1017/s0020818308080181
Châtel, F. D. (2014). The Role of Drought and Climate Change in the Syrian Uprising: Untangling the Triggers of the Revolution. Middle Eastern Studies,50(4), 521-535. doi:10.1080/00263206.2013.850076
De Waal, A. (2008). Chad: Civil war, power struggle and imperialist interference. Green Left Weekly.
49
Fearon, J. D., Kasara, K., & Laitin, D. D. (2007). Ethnic Minority Rule and Civil War Onset. American Political Science Review,101(01), 187-193.
doi:10.1017/s0003055407070219
Field, S. (1992). The Effect Of Temperature On Crime. The British Journal of Criminology,32(3), 340-351. doi:10.1093/oxfordjournals.bjc.a048222
Gray, L., & Kevane, M. (n.d.). Darfur: Rainfall and Conflict. SSRN Electronic Journal. doi:10.2139/ssrn.1147303
Hansen, S. (2008, May 28). Backgrounder: African Agriculture. Retrieved March 27, 2017, from http://www.nytimes.com
Hendrix, C. S., & Salehyan, I. (2012). Climate change, rainfall, and social conflict in Africa. Journal of Peace Research,49(1), 35-50. doi:10.1177/0022343311426165 Jambor, A., & Babu, S. (2016). Policy Lessons for Attaining Food Security Through Increased
Competitiveness in Agriculture. Competitiveness of Global Agriculture, 173-189. doi:10.1007/978-3-319-44876-3_9
Landis, S. T. (2014). Temperature seasonality and violent conflict. Journal of Peace Research,51(5), 603-618. doi:10.1177/0022343314538275
Madu, I. (2012). Spatial Vulnerability of Rural Nigeria to Climate Change. The International Journal of Climate Change: Impacts and Responses,3(4), 79-98. doi:10.18848/1835-7156/cgp/v03i04/37134
Mazo, J. (2009). Chapter Three: Darfur: The First Modern Climate-Change Conflict. The Adelphi Papers,49(409), 73-86. doi:10.1080/19445571003755538
Naude, W. (2010). Forced Migration from Sub-Saharan Africa: The Conflict–Environment Link. Environment, Forced Migration and Social Vulnerability, 43-55. doi:10.1007/978-3-642-12416-7_4
Njiru, B. N. (2012). Climate Change, Resource Competition, and Conflict amongst Pastoral Communities in Kenya. Hexagon Series on Human and Environmental Security and Peace Climate Change, Human Security and Violent Conflict, 513-527. doi:10.1007/978-3-642-28626-1_24
Nordås, R., & Gleditsch, N. P. (2007). Climate change and conflict. Political Geography,26(6), 627-638. doi:10.1016/j.polgeo.2007.06.003
Notholt, S. (2010). Fields of fire: an atlas of ethnic conflict. London: S. Notholt. Nyakairu, F. (2009). East Africa drought leaves millions hungry. Reuters.
50
Raleigh, C., & Urdal, H. (2007). Climate change, environmental degradation and armed conflict. Political Geography,26(6), 674-694. doi:10.1016/j.polgeo.2007.06.005 Revkin, A. (2017). Trump’s defense chief cites climate change as national security
challenge. Science. doi:10.1126/science.aal0911
Salehyan, I. (2008). From Climate Change to Conflict? No Consensus Yet. Journal of Peace Research,45(3), 315-326. doi:10.1177/0022343308088812
Theisen, O. M., Holtermann, H., & Buhaug, H. (2012). Climate Wars? Assessing the Claim That Drought Breeds Conflict. International Security,36(3), 79-106.
doi:10.1162/isec_a_00065
51
Appendix
Precipitation Variation and Conflict 1998-2013
54 Temperature Change and Conflict 1998-2013
57 Political Marginalization and Conflict
Selected years where there were changes in the territory of marginalized groups in shown along with conflict distribution. “Marginalized” is defined as areas inhabited by ethnic groups
58 Poisson GLM Regression for Conflict Counts
Coef.
Std.
Err. z P>z
[95%
Conf. Interval]
Temp Change 0.177 0.019 9.120 0.000 0.139 0.215
Precipitation 0.005 0.000 13.440 0.000 0.004 0.005
EPR 0.739 0.013 56.300 0.000 0.714 0.765
Democracy 0.027 0.002 16.090 0.000 0.023 0.030
Population 0.623 0.004 141.690 0.000 0.614 0.632
_cons -7.959 0.054 -147.750 0.000 -8.065 -7.854
GLM Logistic Regression with 1 year lag
GLM Random Effects Logistic Regression
Coef. Std. Err. z P>z [95% Conf.Interval]
Temp Change -0.054 0.045 -1.200 0.231 -0.143 0.034 EPR 0.307 0.031 9.810 0.000 0.246 0.368 Democracy 0.046 0.004 11.470 0.000 0.038 0.054 Precipitation 0.003 0.001 3.830 0.000 0.002 0.005 lnPopulation 0.493 0.011 45.160 0.000 0.471 0.514
Coef. Std. Err. z P>z [95% Conf. Interval]
Temp Change 0.1822 0.0192 9.48 0 0.145 0.220 EPR 0.0250 0.0275 0.91 0.363 -0.029 0.079 Democracy 0.0226 0.0028 7.96 0 0.017 0.028 lnPopulation 0.4414 0.0194 22.76 0 0.403 0.479 Precipitation 0.0042 0.0004 11.04 0 0.003 0.005
/lnalpha 1.6219 0.0324 1.558 1.685