Sreenivasula R Gajjala. Longitudinal Analysis of Readmission Risk Using Machine Learning. A Master’s Project for the M.S. in I.S. degree. November, 2015. 30 pages. Advisor: David Gotz
Unnecessary hospital readmissions are a major problem impacting millions of patients and costing billions of dollars per year. Unfortunately, accurate assessment of
readmission risk remains an open problem. In this study, several methods and tools for readmission prediction were developed using UNC hospital data available from April 1, 2014 to November 1, 2014. This study investigated the change in readmission risk for patients over time to explore at which times high-‐risk patients can be most effectively identified. Toward this goal, multiple Machine Learning models of hospital readmission using patient history prior to admission and comparing them with baseline model which uses data during hospitalization were developed. The results of this study find that patients history did not produce better predictive performance than the baseline model that considered just hospitalization data. However, the dataset considered is small and results may not generalize to large data sets over longer period of time.
Headings:
Electronic Health Records
Patient Readmission
Machine Learning
LONGITUDINAL ANALYSIS OF READMISSION RISK USING MACHINE LEARNING
by
Sreenivasula R Gajjala
A Master’s paper submitted to the faculty of the School of Information and Library Science of the University of North Carolina at Chapel Hill
in partial fulfillment of the requirements for the degree of Master of Science in
Information Science.
Chapel Hill, North Carolina November 2015
Approved by
Table of Contents
Table of Contents ... 1
1. Introduction ... 2
2. Research Questions: ... 3
3. Literature Review ... 4
3.1 Feature Selection and Feature Elimination ... 5
3.2 Risk Models ... 7
3.3 Evaluation ... 9
4. Methods ... 12
4.1 Data Collection ... 12
4.2 Feature Description ... 16
4.3 Models ... 17
4.4 Algorithms ... 18
5. Results ... 19
6. Discussion and Conclusion ... 24
Bibliography ... 26
1.
Introduction
Nationwide, 30-‐day hospital readmission rates approach 20% and unplanned
rehospitalizations are estimated to cost Medicare $17.4 billion annually (Jencks et al.,
2009). Moreover, these costs are expected to increase as the population ages. Because
of the skyrocketing costs of hospital readmissions, in October 2012 the Centers for
Medicare and Medicaid Services (CMS) started assessing financial penalties to hospitals
with high readmission rates. More than 2,200 hospitals faced some level of penalty in
the first year, with penalties amounting to approximately $125,000 per hospital on
average and $280 million total (CMS 2012). Preventable readmissions are a top priority
for many hospitals in the United States. By addressing the critical “voltage drop” in care
that occurs when patients transition from hospital to home, hospital transition
programs (HTPs) have been shown to reduce preventable hospital readmissions
(Balaban et al., 2008). HTPs commonly include bundles of interventions such as
medication reconciliation by pharmacists, post-‐discharge phone calls, nurse home visits,
and home telemonitoring for patients. However, enrolling every hospitalized patient
into a one-‐size fits all HTP, independent of readmission risk, may not be a sustainable
and cost-‐effective solution for reducing readmissions. For example, among hospitals
which developed successful HTPs in the context of research studies, 11 of 13 (85%) were
subsequently discontinued due to financial constraints (Seow et al., 2006). Efficiently
to be a long-‐term solution (Arbaje et al., 2008). Therefore, it is critical to develop
tools that accurately identify which hospitalized patients are at highest risk for
readmission and why—so that HTP interventions can be tailored for each unique
patient’s needs and individual risk factors.
2.
Research Questions:
While most efforts at readmission risk analysis focus on assessing risk at the time of
discharge, this study tests the hypothesis that the large volume of patient medical data
known about a patient earlier in her/his medical history can be highly informative to
support earlier assessments. This can help understanding risk evolves over time for
specific patient subgroups can help support the design of more effective risk reduction
programs.
Specific Aim #1: Patient cohort identification, characterization, and outcome modeling
For this study, data from from CDW-‐H managed by NC TraCS for three specific
conditions that result in large numbers of hospitalizations: Chronic Obstructive
Pulmonary Disease, Heart failure and Diabetes is used. For each condition, data of
patients that have medical histories, both outpatient and inpatient, within CDW-‐H was
acquired. Procedures, diagnoses, medications, labs, and demographics for the patients
that meet inclusion criteria were considered. For those cohorts, study develops
comprehensive descriptive statistics and define a small set of condition-‐specific,
quantifiable outcome measures.
Specific Aim #2: Modeling, analysis, and evaluation
For each condition (COPD, HF, DIAB), models were generated by using patient
data from four time intervals namely 15 days, 30 days, 45 days and 60 days prior to
hospital admission. These models were compared to the baseline model generated from
data during hospitalization.
3.
Literature Review
The primary objective of this review is to explore and summarize readmission risk
prediction models, data extraction and feature selection, and performance and
evaluation of these models in existing literature. In most of them, readmission meant
the patients getting admitted again within 30 days of their initial discharge. Most
patients, when they are discharged from the hospital, assume they won’t be
readmitted. Unfortunately, that is not the case, especially with specific populations such
as geriatric patients with CHF and COPD. The highest hospital readmission rates have
been observed in patients with these conditions (Arian Hosseinzadeh, Masoumeh Izadi,
Aman Verma, Doina Precup, and David Buckeridge 2013). Readmissions is a growing,
urgent challenge with most hospitals attempting to address this problem on a priority
basis. Preliminary findings suggest reducing readmission risks reduce medical costs and
improve health outcomes. Based on 2005 data of Medicare beneficiaries, it has been
estimated that 12.5% of Medicare admissions due to CHF were followed by readmission
within 15 days, accounting for expenses of approximately $590 million (Kiyana Zolfaghar
et al., 2013). A study conducted by the Medicare Payment Advisory Committee
of those as potentially unavoidable (Futoma, J., Morris, J., and Lucas, J. 2015). The
Patient Protection and Affordable Care Act (PPACA) penalizes hospitals with high
readmission rate through a program called the Hospital Readmission Reduction Program
(Futoma, J., Morris, J., and Lucas, J. 2015). In turn, this is ushering in new business
models in health care. Financial implications of accurately predicting hospital
readmission rates are huge. However, developing such predictive models is a
challenging process.
3.1
Feature Selection and Feature Elimination
Methods to predict hospital readmission risk are in great demand among
healthcare organizations. A lot of research is being conducted to explore a plethora of
statistical techniques and machine learning models for risk prediction. A wide variety of
data sources are being used for these models including patient demographics, social
characteristics, medications, procedures, diagnostic-‐related groups, laboratory tests,
claims data and billing codes. Some researches explicitly use administrative data (He, D.,
Mathews, S. C., Kalloo, A. N., & Hutfless, S. 2014) and ICD-‐10 data (Futoma, J., Morris, J.,
and Lucas, J. 2015). The information is sourced and extracted from electronic health
records and socio economic data available at National Inpatient Sample (NIS). Number
of features selected in the models ranged from 20 (Arian Hosseinzadeh et al., 2013) to
several thousands, with the number of patients whose data was analyzed ranging from
thousands to millions (Kiyana Zolfaghar et al.,2013). Their data was sourced from United
States, New Zealand (Futoma, J., Morris, J., and Lucas, J. 2015) and Australia (Tran, T.,
included sociodemographic factors, health conditions, disease parameters, hospital care
quality parameters, and a diverse set of health care providers-‐specific variables. In most
cases, features were grouped into categories such as sociodemographic, vital signs,
laboratory tests, discharge codes, medical comorbidity and length of stay. Some models
analyzed features at different times of hospital stay, like pre-‐admission, post-‐admission,
pre-‐discharge and post-‐discharge and used different features for their models (Vivek R
Rao, Kiyana Zolfaghar, David K. Hazel,Vani Mandava,Senjuti Basu Roy and Ankur
Teredesai 2014). For instance, at the time of admission the typically available
information is patient history data and current vital signs. Over time, more data like
laboratory test results, diagnosis codes are available which impact model accuracy.
Collating and aggregating the data proves to be a challenge, as does framing the
problem as a classical machine learning problem because of heterogeneity and
complexity in the data. In most approaches, each visit was considered an instance and
most informative aspects for prediction are ICD 9/10 codes (Futoma et al., 2015) and
demographic features. Some models filtered out data about the patient’s death, and
some treated unplanned admissions separately from planned readmissions.
Different types of feature reduction methods were employed across literature.
However, they can be broadly categorized into two main approaches: information based
reduction and dimension reduction. For example, one model used the LACE technique
for feature selection which is information based (Arian Hosseinzadeh et al.,2013). LACE
comorbidity of the patient (C) (measured with the Charlson comorbidity index score);
and emergency department use (E) (measured as the number of visits in the six months
before admission). Gini indexing is a type of information based feature reduction
technique which is a standard measure of statistical dispersion with the value between
zero and one. Gini index is commonly used in the field of Economics as a measure of
inequality of income (Arian Hosseinzadeh et al.,2013). Some models employed the
automatic feature reduction methods available with some standard machine learning
algorithms. Most of them have an algorithm-‐specific feature reduction ability. These
algorithms automatically generate features with greatest predictive ability to the
outcome label and eliminate those features that are noisy and non predictive of the
outcome class. To reduce dimensionality, some models used PCA analysis whereas some
others used frequency-‐based feature selection techniques i.e. selecting the features
that are most common and correlated, and eliminating them (Arian Hosseinzadeh et al.,
2013). A few models used the technique of oversampling method. This method seeks to
change the distribution of training data in a way that both outcome classes are well
represented. It resamples the rare class records so that the resulting training set has an
equal number of records for each (Vivek R Rao et al., 2014). This approach had a positive
effect on the accuracy of models.
3.2
Risk Models
Risk models mentioned in the literature were varied. A detailed review of the
models is available in (Kansagara, D., Englander, H., Salanitro, A., Kagen, D., Theobald,
in the literature has been logistic regression and its several variants, such as Penalized
Logistic regression with L1 and L2 based regularization. Random Forests, Support Vector
Machine and most recently Deep Learning techniques (Futoma et al., 2015). Logistic
Regression (LR) is an optimization problem that involves the identification of vector
coefficients based on input vectors and outcome class. Penalized LR involves adding a
regularization parameter to the loss function. Ridge regression and Lasso Regression are
used widely. Some of them tried to generalize models to global from local cohorts. The
best choice of model depends on the study and most of them selected a model that
works for their requirements which makes it difficult to compare among the models.
Generalizability of these models is very challenging because of the diverse set of
complex factors involved and accuracy is poor in general. Some of the models in this
literature review were targeted to calculate the readmission risk scores of patients,
some were targeted to find patients who are at high risk so that appropriate care can be
taken for those patients and almost all of the models have an overall poor predictive
scores and accuracy can be improved considerably (Kansagara D, Englander H, Salanitro
A, et al. 2011). All the models examined were based on supervised learning classification
algorithms. Starting from simple logistic regression to general classifiers like Naive Bayes
classifier (Arian Hosseinzadeh et al., 2013) to discriminative classifiers such as decision
tree classifier were used. Random Forest classifiers were used in majority of these
models even though it is computationally expensive compared to other models and
scaling a random forest algorithm is very challenging. Random Forests are an ensemble
then combined to a single unified prediction. In random forests case, each classifier is a
decision tree and decision tree is a predictive model which maps features data to a class
using a tree structure. Some tested a support vector machine approach (SVM) whose
goal is to maximize the margins between features and hyperplane used to separate two
classes. Both linear (uses linear kernel) and nonlinear (uses polynomial kernel) SVM
models were examined. Some models exploited the big data solutions like Hadoop (Rao,
V. R., Zolfaghar, K., Hazel, D. K., Mandava, V., Roy, S. B., & Teredesai, A. 2012) and
Mahout to accomplish speed when they were dealing with millions of patients records.
Regardless of the model used, one of the biggest challenges facing all recommender
systems is the sparse data problem. In a system with many patients and many features,
each patient will only have a fraction of the features present in the data which is a
common problem among hospital data.
3.3
Evaluation
The ideal readmission predictor is one that predicts an accurate risk probability
for each hospitalization. Classic machine learning model evaluation metrics such as
precision, recall, accuracy, Area Under the Curve (AUC), sensitivity, specificity, F-‐
measure and receiver operating characteristics are used to evaluate risk prediction
systems. The following section will cover the details of different evaluation metrics that
are being used in risk prediction system.
The available data that is used for model is typically divided into sets of training
set as test data because it is not feasible to test the system using new hospitalizations
without deploying the system. The preferences of test data are not present in the
training data that is used in machine learning models so that test data can be used
independently for evaluation. The risk prediction system predicts readmissions in the
test data and the readmissions labels estimated are compared to the actual values to
calculate different metrics. For readmission predictions, precision can be defined as the
proportion of test instances classified as readmissions that actually belong to
readmissions class. Recall can be defined as the proportion of total test instances that
were identified by classifier as belonging to readmissions class. Mathematically,
precision with respect to readmission is
true positives / (true positives + false positives)
where true positives are test instances where the model has accurately predicted as
readmissions and false positives are test instances where the model has incorrectly
predicted as belonging to readmissions class. Recall can be defined as true positives /
(true positives + false positives), where false negatives are test instances the classifier
has wrongly predicted as not belonging to readmissions class. F1 score is the harmonic
mean between precision and recall
F1 = 2 * (Precision * Recall) / Precision + Recall
The precision is important if there is a high cost related to falsely predicting patients to
belong to the class Readmission. Recall is relevant if the detection of patients that
belong to Readmission is the main goal. The accuracy is the traditional evaluation
used sensitivity, specificity, F-‐measure and receiver operating characteristics. A Receiver
Operator Characteristic (ROC) curve shows hit/miss rates for different classification
thresholds (framework). The area under an ROC curve is a performance measure with
perfect success having area 1 and a random success having area 0.5. These curves are
very similar to precision/recall curves; recall corresponds with sensitivity (hit rate) and
precision corresponds with specificity with miss rate plotted on x-‐axis and hit rate is
plotted on y-‐axis. The AUC measure is typically interesting when the problem is
imbalanced when labeled dataset is highly skewed that is when the number of instances
with No Readmission label significantly outnumbers the number of instances with class
label Readmission (Vivek R Rao et al., 2014). Most models have poor predictive
performance. Among models that used 30 days readmission as the outcome, most of
them had AUC < 0.70 (refer: systematic review) with few exceptions which used small
samples (700 training samples). One way to split the data into test and training data is to
randomly assign instances to training and test set but this might not give the complete
picture of performance because the data can be split in number of different ways. k-‐fold
cross validation addresses this issue by randomly splitting the original data into k-‐folds,
and k-‐1 of these folds are used for training, while the left out fold used for testing. These
steps are repeated to use each fold as the test set while training on the other folds that
are remaining. The final reported metrics are then averaged across the k-‐folds to
compute models average performance. k varied from 3 to 10 in the literature of
readmission prediction. k-‐fold cross validation gives more realistic picture of model
the models exploited the cross validation techniques (majority used 3-‐10 folds) to
improve the accuracy of the model.
4.
Methods
4.1
Data Collection
First, to gather data for this study, patient cohorts for three specific conditions:
heart failure (HF), chronic obstructive pulmonary disease (COPD), and Diabetes
(DIAB) were identified and the study data was prepared. Patient data was gathered
from the UNC Health Care System to support this study. Data for patients from the UNC
Health Care system were retrieved from the Carolina Data Warehouse for Health (CDW-‐
H). All patients are adults (>17 years) who have both inpatient and outpatient medical
data in the CDW-‐H since 2008. All patients had at least one hospitalization for the
specific cohort condition. With IRB approval, operational data for patients admitted to
UNC Hospitals between January 2008 and August 2015 were obtained. UNC health care
system started using EPIC health care systems from 2014-‐April. The data gathered
included data from EPIC system as well as old system. The six and half year sample
included a total of 20293 patients with 59794 variables (12 main classes: BLOOD BANK,
CPT, CPT4, ENCOUNTER, ICD9, ICD9-‐CM, LAB ( lab code system used by EPIC health care
system), LAB-‐LEGACY (lab code system used by LEGACY system), Medications,
Microbiology, NDC, Pathology and Cytology). More relevant for this study, ICD9, ICD9-‐
CM, CPT, CPT4 and Medications were used for while constructing models. Integrating
data from LEGACY and EPIC systems was challenging because of the complex structure
study. Readmit distributions and events distributions were analyzed to come up with
filter criteria. Generalized data models were created to convert the diverse set of
patient information provided by health care system into input that is suitable for
machine learning risk models and exploratory analysis. The main idea is to have a
general database models to capture patient history as events with timestamps which
makes it easy to apply filter criteria and extract features for machine learning models.
Patients information is either static (gender, demographic information) or temporally
varying (emergency visits, lab tests) and the general model incorporates temporal data
as a sequence of events using timestamps associated with them. This type of general
framework for automated feature extraction and risk prediction was used in (framework
piece) and provided useful for scaling up and generalizing the model across different
DRGs (Diagnostic related groups). Data received from health care was stored in mysql
database using the common data model for further analysis. Events data from the
database was further analyzed to come up with inclusion/exclusion criteria for the
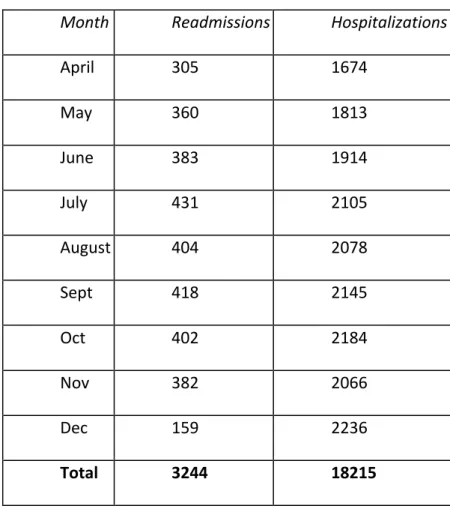
dataset for risk models. Table 1 describes number of events in recorded monthly from
EPIC healthcare System. There is a sudden increase in events recorded from April 2014
because the roll out of EPIC system was transitioned completely by that time. Table 2
describes the month wise distribution readmissions and the December 2014 has very
few readmission because of lack of data of admissions from January 2015. Data from
April 2014 to November 2014 (8 months) was considered for this study.
Table 1: Monthly distribution of events recorded
Month Number of events
01/01/2014 792
01/02/2014 1922
01/03/2014 2370
01/04/2014 145746
01/05/2014 161007
01/06/2014 183601
01/07/2014 218404
01/08/2014 230690
01/09/2014 227393
01/10/2014 235979
01/11/2014 214314
01/12/2014 228719
01/01/2015 230
01/02/2015 263
Table 2: Readmit analysis monthly
Month Readmissions Hospitalizations
April 305 1674
May 360 1813
June 383 1914
July 431 2105
August 404 2078
Sept 418 2145
Oct 402 2184
Nov 382 2066
Dec 159 2236
Total 3244 18215
Table 3: Descriptive statistics for the three cohorts
Condition
Total
hospitalizations
Readmission
hospitalizations
Readmission
rate
Unique
Patients
COPD 6542 1151 0.18 5695
HF 4890 1028 0.21 3929
DIAB 7033 1242 0.18 6236
After data filtering, smaller and more focused disease-‐specific cohorts for further
analysis was defined. Using the appearance of the ICD-‐9 codes during a hospitalization
as inclusion criteria, three groups of hospitalizations corresponding to HF, COPD, and
DIAB were defined. These cohorts ranged in size from X to Y hospitalizations (for PN and
HF, respectively). Because some patients were hospitalized more than once, the number
of unique patients represented is slightly smaller as shown in the detailed descriptive
statistics reported in Table 3. Each of the hospitalizations in the three cohorts was
classified with one of two labels: (1) resulting in readmission (2) not resulting in
readmission. The label for a given hospitalization was determined by looking within the
same patient’s data for a subsequent admission to the hospital within 30 days of the
discharge date (regardless of reason for the subsequent hospitalization). After applying
this classification logic to all three cohorts, readmission rates ranged approximately
from 16% to 19% across the conditions.
4.2
Feature Description
The fundamental goal of this study was to characterize the change in
readmission risk over time by creating Machine Learning models using data from
different time frames. Toward this goal, first a binary outcome vector for each condition
[COPD, HF, DIAB] was defined. The length of each outcome vector reflected the number
of hospitalizations for the corresponding condition. Each value in the vector was either
one or zero, with a one for each hospitalization labeled as a readmission and zero for all
others. After that, for each visit, feature vectors generated from ICD9codes, CPT and
otherwise the value was set to 0. This consists of 41349 binary variables coding the ICD9
(10631), medications (18745), CPT (4093) and CPT4(7990) codes. Unfortunately, the
demographic data (age, sex and race) was not provided so it was not considered for this
analysis. This data was then converted to two dimensional array of size (n_samples,
n_features) for python’s Scikit-‐Learn analysis.
4.3
Models
Readmission risk prediction is treated as a binary classification problem for this
study. Classification algorithms takes labeled data as input (training data) and predicts
unseen data (test set) labels. The learning function of algorithm will first fit to the
training data and then try to predict the labels for test set. In Scikit-‐Learn, these two
steps needed to be provided explicitly for the algorithm. Logistic Regression algorithm
was used to construct models as it was used in many of models constructed in literature
(systematic review piece). Logistic regression outputs a predicted label based on the
probability of the test instance belonging to a certain label and the label with highest
probability was used for predicted label.
For each condition (COPD, HF, DIAB), models were generated by using patient
data from four time intervals namely 15 days, 30 days, 45 days and 60 days prior to
hospital admission. These models were compared to the baseline model generated from
data during hospitalization. Feature engineering techniques provide by Scikit-‐Learn were
used for model creation. Feature engineering is the process of transforming raw data
into features that better represent the underlying problem to the predictive models,
less overfitting and generalize better and normally provide higher accuracy (refer 5).
Univariate feature selection methods were used for reducing the feature set. Univariate
feature selection works by selecting the best features based on univariate statistical
tests. Select Percentile feature reduction method was used which removes all but top
10 percent highest scoring percentage of features. In order to fairly compare models,
Stratified K Fold Cross validation with 10 folds was used. It was used because the
training data is unbalanced with “not readmission” outcome label appearing majority of
times (greater than 80%). Stratification makes sure that the percentage of samples for
each class is similar across folds which ensures that there is no bias in any folds to have
only 1 particular class dominating the other one.
4.4
Algorithms
In this study, a generalized algorithm for hospital readmission is developed. The
algorithm can be used for future applications with different settings as well. There are
two main steps involved in the algorithm.
Step 1: Data generation
• Identify COPD, HF and DIAB patient cohorts using ICD9 codes
• For each condition, label each hospitalization as either readmit or not readmit based on
30-‐day readmission time interval
• For each hospitalization, get all the codes (ICD9, Medications and other codes) present
based on time prior to admission as a filtering criteria. Time varied from 0, 15, 30, 45
• Initialize a matrix with number of hospitalizations as rows and features as columns.
Initialize all the values to be zero. For each hospitalization, if a feature appears in the
hospitalization data then set the value in the matrix to 1. Also append a new column for
outcome label and set the corresponding outcome label which was already calculated
above
• Generate a csv file from the matrix created above.
Step 2: Binary Classification
• Load data from the csv file generated above and load it as a matrix that is suitable for
the machine learning model. (Scikit learn is used for this study)
• Separate the outcome labels and drop the column from the matrix to avoid using the
label as input to machine learning algorithm
• Apply feature engineering on input data. This study used selectKPercentile method
using k as 10 which reduces the features to top 10 percentile features that are most
predictive based on f_classifcation univariate measure.
• Train the logistic regression model by using the new features and the label. Use
stratified K folding as the data is unbalanced
• Get the metrics for evaluating the model performance.
The above algorithm was implemented in python using pandas and scikit learn libraries.
Code is available at https://github.com/sreenug/readmission and is publicly accessible.
5.
Results
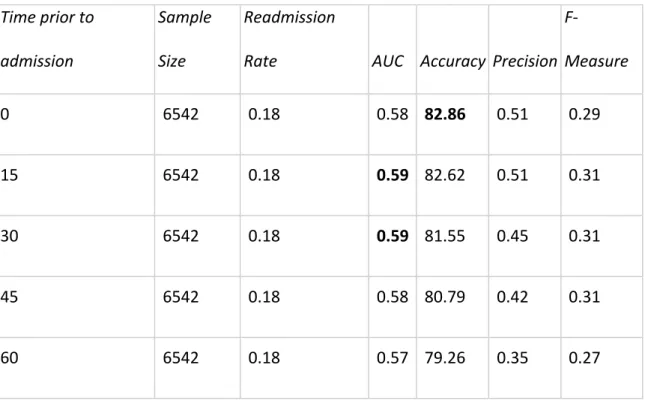
Results for each of the conditions are shown in Table 4 (COPD), Table 5 (HF) and
Usually, classification results are compared with a baseline random model which
assumes 50% random chance of identifying an instance belonging to the correct class.
That is, if a classifier just randomly guesses labels (0 and 1 in this case) to instances, it is
assumed that the model predicts 50% of labels correctly. However, the baseline random
model assumes that the labels in training and test sets are evenly balanced with one half
of instances consisting of readmission labels and the other half consisting of “no
readmit” labels. This assumption will not hold true in the hospital readmission case since
the labels are not uniformly distributed due to low readmission rates. This class
imbalance problem (Chawla, 2010) is a common issue in the healthcare field as only a
small percentage of population are afflicted by diseases and illnesses.
The most common evaluation metric in literature for predicting early readmission,
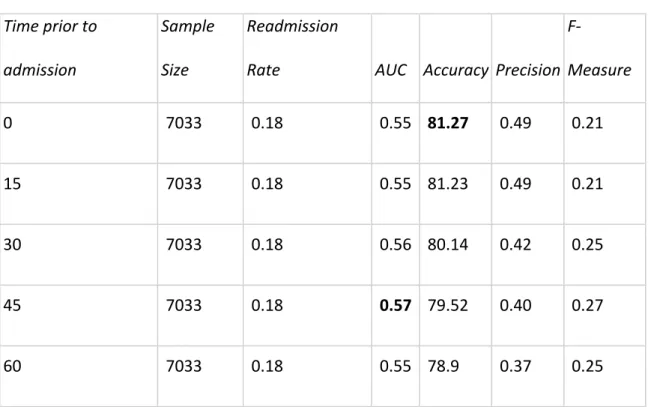
area under the ROC (AUC) was used. It is reported in Tables 4, 5, 6 along with accuracy,
precision and F-‐measures with respect to the readmission class. Among all three
cohorts, baseline models that considered data from hospitalization and without any
patient history consistently outperformed all the other models which considered patient
history when comparing with the metric of accuracy. This is verified in Fig 2. In
comparison with the AUC metric, HF and DIAB models, which took past 45 days data
into consideration, outperformed all other models. This is verified in Fig 1. Of particular
interest is the low HF model accuracy when compared to COPD and DIAB models,
than the other cohorts. The results also show that COPD with the highest accuracy is
most predictive among the three cohorts, as shown in Fig. 1
Table 4: COPD results from 10-‐fold cross validation
Time prior to
admission
Sample
Size
Readmission
Rate AUC Accuracy Precision
F-‐
Measure
0 6542 0.18 0.58 82.86 0.51 0.29
15 6542 0.18 0.59 82.62 0.51 0.31
30 6542 0.18 0.59 81.55 0.45 0.31
45 6542 0.18 0.58 80.79 0.42 0.31
60 6542 0.18 0.57 79.26 0.35 0.27
Table 5: HF results from 10-‐fold cross validation
Time prior to
admission
Sample
Size
Readmission
Rate AUC Accuracy Precision
F-‐
Measure
0 4890 0.21 0.56 79.68 0.51 0.28
15 4890 0.21 0.57 78.45 0.45 0.28
30 4890 0.21 0.57 77.57 0.42 0.32
60 4890 0.21 0.57 76.95 0.40 0.29
Table 6: DIAB results from 10-‐fold cross validation
Time prior to
admission
Sample
Size
Readmission
Rate AUC Accuracy Precision
F-‐
Measure
0 7033 0.18 0.55 81.27 0.49 0.21
15 7033 0.18 0.55 81.23 0.49 0.21
30 7033 0.18 0.56 80.14 0.42 0.25
45 7033 0.18 0.57 79.52 0.40 0.27
60 7033 0.18 0.55 78.9 0.37 0.25
Fig 2: Accuracy comparison among patient cohorts
6.
Discussion and Conclusion
Leveraging the Electronic Health Records (EHR) to construct features and labels,
this study developed and tested a Logistic Regression algorithm to predict and the risk
of readmission by considering patient's’ history. For each condition, comparing the
baseline model to other models considering patient's history, it is found that the latter
did not produce better predictive performance than the baseline model. This might be
because of increase in number of features used. Models that considered history have
more features for prediction, and adding on more number of features could lead to over
fitting and a noisy data set. To avoid these problems, more complex feature
representation can be used and the model can be retrained with new data contents or
newly added attributes. Using different feature representation for history and a
different feature representation for baseline model can be explored to build a more
robust model. It is also possible to test the features generated from more complicated
feature engineering on different machine learning algorithms to improve the results.
Instead of just considering 60 days of history, longer periods could be considered for
further analysis. There are several important limitations that should be taken into
consideration before generalizing the results obtained from this study. The size of
dataset considered is small. Only 6 months’ data has been used for prediction along
with varying 60 days of past data. In this study, models were created using only ICD-‐9
codes and medications without using demographic information. Repeated observations
of codes were not considered for feature creation since only binary feature
frequency analysis might also improve the results. It is also likely that the reliability of
ICD-‐9 codes and medication data might have been impacted by recording errors or
misdiagnoses. However, the results might change if more data especially of greater
duration is considered for prediction. The current fast pace of research in Machine
Learning will improve the model fitting to increase its prediction precision, which might
Bibliography
Jencks, S. F., Williams, M. V., & Coleman, E. A. (2009). Rehospitalizations among patients
in the Medicare fee-‐for-‐service program. New England Journal of Medicine, 360(14),
1418-‐1428.
Pedregosa, F., Varoquaux, G., Gramfort, A., Michel, V., Thirion, B., Grisel, O., ... &
Duchesnay, E. (2011). Scikit-‐learn: Machine learning in Python. The Journal of Machine
Learning Research, 12, 2825-‐2830.
Balaban, R. B., Weissman, J. S., Samuel, P. A., & Woolhandler, S. (2008). Redefining and
redesigning hospital discharge to enhance patient care: a randomized controlled study.
Journal of general internal medicine, 23(8), 1228-‐1233.
Xu, Y., Hong, K., Tsujii, J., Eric, I., & Chang, C. (2012). Feature engineering combined with
machine learning and rule-‐based methods for structured information extraction from
narrative clinical discharge summaries. Journal of the American Medical Informatics
Association, 19(5), 824-‐832.
Liaw, A., & Wiener, M. (2002). Classification and regression by randomForest. R news,
Zolfaghar, K., Meadem, N., Teredesai, A., Roy, S. B., Chin, S. C., & Muckian, B. (2013,
October). Big data solutions for predicting risk-‐of-‐readmission for congestive heart
failure patients. In Big Data, 2013 IEEE International Conference on (pp. 64-‐71). IEEE.
Rao, V. R., Zolfaghar, K., Hazel, D. K., Mandava, V., Roy, S. B., & Teredesai, A.
Readmissions Score as a Service (RaaS).
Hosseinzadeh, A., Izadi, M. T., Verma, A., Precup, D., & Buckeridge, D. L. (2013, June).
Assessing the Predictability of Hospital Readmission Using Machine Learning. In IAAI.
Kansagara, D., Englander, H., Salanitro, A., Kagen, D., Theobald, C., Freeman, M., &
Kripalani, S. (2011). Risk prediction models for hospital readmission: a systematic
review. Jama, 306(15), 1688-‐1698.
Perotte, A., Ranganath, R., Hirsch, J. S., Blei, D., & Elhadad, N. (2015). Risk prediction for
chronic kidney disease progression using heterogeneous electronic health record data
and time series analysis. Journal of the American Medical Informatics Association,
ocv024.
Sculley, D., Holt, G., Golovin, D., Davydov, E., Phillips, T., Ebner, D., ... & Young, M.
(2014). Machine learning: The high interest credit card of technical debt. In SE4ML:
Software Engineering for Machine Learning (NIPS 2014 Workshop).
Shams, I., Ajorlou, S., & Yang, K. (2014). A predictive analytics approach to reducing 30-‐
day avoidable readmissions among patients with heart failure, acute myocardial
infarction, pneumonia, or COPD. Health care management science, 18(1), 19-‐34.
Futoma, J., Morris, J., & Lucas, J. (2015). A comparison of models for predicting early
hospital readmissions. Journal of biomedical informatics, 56, 229-‐238.
He, D., Mathews, S. C., Kalloo, A. N., & Hutfless, S. (2014). Mining high-‐dimensional
administrative claims data to predict early hospital readmissions. Journal of the
American Medical Informatics Association, 21(2), 272-‐279.
Ian H. Witten, Eibe Frank , Mark A. Hall (2011). Data Mining: Practical Machine Learning
Tools and Techniques
Hoens, T. R., & Chawla, N. V. (2010). Generating diverse ensembles to counter the
problem of class imbalance. In Advances in Knowledge Discovery and Data Mining (pp.
488-‐499). Springer Berlin Heidelberg.
Tran, T., Luo, W., Phung, D., Gupta, S., Rana, S., Kennedy, R. L., ... & Venkatesh, S. (2014).
A framework for feature extraction from hospital medical data with applications in risk