Decreasing the Average Delay, Connectivity,
and Routing Load in Clustered Mobile
Ad-Hoc Networks
Reza AssarehDepartment of Computer Engineering, Science and Research Branch, Islamic Azad
University, Tehran, Iran Midia Reshadi
Department of Computer Engineering, Science and Research Branch, Islamic Azad
University, Tehran, Iran
Masoud Sabaei*
Computer Engineering and Information Technology Department,
Amirkabir University of Technology, Hafez Avenue, Tehran, Iran
Ahmad Khademzadeh IT Faculty,
Iran Telecommunication Research Center, Tehran, Iran
Received: 15 August, 2017 - Accepted: 15 March, 2018
Abstract- Clustering is an efficient method for increasing scalability in mobile ad hoc networks. In this method, several nodes called clusterheads are responsible for serving the nodes in their cluster. Choosing the optimal number of clusterheads can improve the quality-of-service metrics such as delay in clustered networks. There have been several studies to model the delay in mobile ad hoc networks with flat structure, but assessing the delay in clustered networks is still open research topic. In this paper, first we model the average hop count in clustered mobile ad hoc networks, and then, analytically, we show that an increased number of clusterheads increases the probability of new routes with lower hop counts and consequently, reduces delay in each connection. The effect of the number of clusterheads on average delay and two other metrics; connectivity and routing load is analyzed for two types of clustering methods: with and without gateways.
Keywords: Average Delay, Connectivity, Clusterheads, Routing Load, Hop Count
I. Introduction
A mobile ad hoc network (MANET) consists of a set of wireless and mobile nodes that do not require a
*Corresponding Author
fixed infrastructure for communicating with each other [1]. In this network, routing is performed by network nodes due to the lack of external fixed equipment. Because the cooperation of all nodes in the routing
process complicates the algorithm and increases the size of routing tables, clustering algorithms have been suggested. In these methods, the network nodes are organized in groups called clusters; in each cluster, a node called a clusterhead is responsible for monitoring and routing the cluster packets. In the proposed clustering algorithms, network connectivity is implemented two ways: with and without gateways. In algorithms without gateways such as the weighted clustering algorithm (WCA) [2], the network infrastructure includes clusterheads with direct links between them. In gateway-based algorithms such as the fast WCA (FWCA) [3], the network infrastructure includes clusterheads and gateway nodes with various connecting links.
The average delay is one of the most important quality-of-service metrics in real time communications. Each packet will be exposed to a set of delays on the route to its destination. At each hop of the route, delays for packet processing, queuing, transmission, and propagation are observed [4]. The end-to-end delay is the sum of all these delays for all hops in the route. It is clear that the number of hops in the route plays an important role in the level of end-to-end delay in ad hoc networks and is affected by the number of clusterheads. In the absence of a fixed infrastructure, network connectivity is very important metric. Network connectivity depends on parameters such as the number of nodes in the network, transmission range of the nodes, initial position, and mobility model of the nodes as well as the number of clusters in clustered networks. A higher probability of adjacent nodes in the network infrastructure leads to an increase in the connectivity of the network. Routing load is the amount of traffic control required to transmit a specified original amount of data. In other words, this metric shows how much control traffic (in the route discovery and maintenance phases) is required to deliver a specific volume of original data to their destinations [5]. To measure the amount of traffic, transmission count can be used. Transmitting a packet from one node to another (each hop count) is counted as one transmission [6]. In clustered networks, unlike in flat networks in which route request packets must be sent through all the network nodes, the control packets are sent through a logical infrastructure (the clusterheads and gateways). As a result, the number of clusterheads will have a direct effect on the frequency of control packet regeneration throughout the network. In previous studies, the effects of different parameters on average delay, connectivity, and routing load have been analyzed separately for flat ad hoc networks. However, as far as we are aware, the effect of the number of clusterheads on these metrics has not been mathematically analyzed for clustered mobile ad hoc networks. In this paper, we focus explicitly on the open question of how the number of clusterheads in clustered MANETs affects the average end-to-end delay, connectivity, and routing load. We then provide an analysis-based conclusion. Answering this question will be useful for choosing the optimal number of clusterheads as well as implementing the future clustering algorithms.
In this paper, for a clustered ad hoc network, we first calculate the probability of a route with i links
between any desired source and destination and present a model for the average hop counts in this network. Accordingly, we show that for each connection, increasing the number of clusterheads can lead to a route with fewer hops, and consequently, the average end-to-end delay in the network will decreased. In contrast, we show that increasing the number of clusterheads increases the probability of a route between two nodes in the network. Therefore, the number of clusterheads has a direct relationship with the connectivity of the network. We also prove that although the increase in the number of clusterheads leads to an increase in the routing load in the network, it can decrease the total network traffic load for a specified packet rate due to the reduction of the average hop count for each connection. Finally, we analyze two types of clustered networks, with and without gateways, in this study through simulation.
This paper is organized as follows: In Section 2, the research background is presented. In Section 3, the model of the system is described. In Section 4, the average delay, connectivity, and routing load for clustering networks with and without gateways are analyzed. In Section 5, the simulation results of the algorithms are examined and finally, in Section 6, the conclusion is presented.
II. Related work
Because of the importance of the average delay, connectivity, and routing load in a MANET network, numerous studies have been carried out to identify their influencing parameters.
In [7], assuming that network nodes move using the random way point (RWP) mobility model, the connectivity and average delay for flat ad hoc networks with N mobile nodes were calculated. It was shown that by increasing the number of nodes in the network, connectivity increases. Further, if the network is connected, the average delay will decrease due to the possibility of routes with lower hop counts. In [7], a circle with radius a was used as a simulation environment and the probability distribution function of the distance between two nodes was calculated. Moreover, the probability of a neighborhood for both desired nodes in the network was calculated. Finally, by calculating the probability of a route with i links between the source and destination, the effect of the number of nodes and the mobility of nodes on connectivity and average delay was evaluated.
In [8], assuming that the network nodes move according to the RWP mobile in a square environment of d × d, the probability of a neighborhood for two nodes in a flat ad hoc network was calculated. Then, the connectivity and the average end-to-end delay were obtained for each pair of source and desired destination nodes. The authors showed that in a non-connected network, higher numbers of network nodes increases the network connectivity and decreases the end-to-end delay. In contrast, in a connected network, because of channel competition and access delays, more nodes in the network increases the average end-to-end delay.
In [9], the effects of three parameters, routing protocol, packet size, and node pause time, are verified on two important metrics, average delay and average
Volume 10- Number 1 – Winter 2018 37
jitter, individually and in combination. This study showed that the type of routing protocol has a key role in the average delay of a flat ad hoc network. The size of the packets had more effect on the jitter factor. Moreover, the route chosen by routing algorithms has a great effect on the average final delay in the network. In [10] and [11], a correlated mobility model for nodes was considered in which nodes are classified in groups and the movement of nodes of a group is limited to a specified region. In these studies, network nodes were clustered based on the mobility correlation between them, but the concept of a clusterhead was not considered in clusters. In these two papers, the conflict between network capacity and delay was explored. In [10], the maximum number of packet copies for redundancy was considered. It was shown that increasing packet redundancy rapidly decreases capacity and the delay initially decreases and then increases. Thus, there is an optimal value for capacity and delay depending on the amount of closed redundancy. In [11], the correlation between nodes was investigated. It was shown that an average mobility correlation, in comparison with weak correlation and strong correlation, best addresses the capacity-delay conflict. That is, by adjusting the number of clusters and area covered by each cluster, the competition for limited radio resources and delay can be greatly reduced.
The authors in [12] studied the cluster-based routing protocol (CBRP) using reactive and proactive routing algorithms. It was shown that, by clustering the network and determining the clusterhead for each cluster, in the route discovery phase, routing information is exchanged among clusterheads rather than among all the nodes of the network. As a result, the routing load is reduced. In [12], the complexity of communications in the route discovery phase for CBRP is equal to O(2M), where M is the number of clusterheads in the network.
In some studies on clustering algorithms [13–16], it has been stated that increasing the number of clusterheads in the network will increase the hop count in the network routes, thus increasing the end-to-end delay. Accordingly, in these studies, the clusters were set up in such a way that the number of clusterheads in the network was minimal. In these papers, it was assumed that increasing the number of clusterheads in the network would increase the network infrastructure, and thus the route created between each pair nodes would have a higher hop count and, consequently, increase the average end-to-end delay in the network.
To our best knowledge, the effect of the number of clusterheads on the average delay, connectivity, and routing load has not been analyzed analytically in previous work.
III. System Model
In this section, a model is presented for calculating the average hop count in the network. Accordingly, three main network metrics, average delay, connectivity, and routing load, are analyzed. Finally, the effect of the number of clusterheads on each is investigated.
A. Assumptions and Prerequisites
In this paper, we assume that for a network, N
nodes are uniformly distributed over a square environment of d × d and move according to the RWP mobility model. The RWP is commonly used in most similar studies on MANETs. In this model, each node moves in the network by selecting a random destination point from the simulation environment and moving toward it at a velocity randomly chosen within a given range. Upon reaching the destination, it stays there for a time before repeating the process. These steps are repeated until the simulation period is finished. In this paper, the traffic transmitted by each node is based on the constant bit rate model. The clusterheads are selected randomly regardless of the physical properties of the nodes. All symbols are defined in Table 1.
Table 1. Definition of symbols
Meaning Symbol
Number of nodes N
Number of Clusterheads M
Number of gateways Gw
Length and width of simulation area d
Transmission range r
Average number of hop count in each exchnage
𝐻𝑜𝑝𝐶𝑜𝑢𝑛𝑡 ̅̅̅̅̅̅̅̅̅̅̅̅̅̅
Pdf of the distance X between a node pair with RWP mobility model
𝑓𝑋(𝑥)
The probability of establishing a link between arbitrary node pair
g(r)
The probability that both source and
destination nodes were
ordinary(member) node
𝑃𝑚,𝑚
The probability that one of the source or destination nodes was clusterhead and another was member
𝑃𝑚,𝑐ℎ
The probability that both source and destination nodes were clusterhead
𝑃𝑐ℎ,𝑐ℎ
Average number of packets that can be send in each successful exchange
𝑏̅
Probability of existing a route between arbitrary node pair
CR
Average Path Expiration Time between source and destination
𝑃𝐸𝑇 ̅̅̅̅̅̅
B. Average Delay Analysis
To calculate the average delay, we assume that the delay of transmitting a bit of data from one node to a neighboring node is constant and equals t. If the average number of hops in each connection is known, the average delay in each connection is obtained as [8]
𝑑𝑒𝑙𝑎𝑦̅̅̅̅̅̅̅̅ = ℎ𝑜𝑝 𝑐𝑜𝑢𝑛𝑡̅̅̅̅̅̅̅̅̅̅̅̅̅ . 𝑡 (1)
In [8], to calculate the ℎ𝑜𝑝 𝑐𝑜𝑢𝑛𝑡̅̅̅̅̅̅̅̅̅̅̅̅̅ in a flat ad hoc network (without clustering), PL, the probability of existing a route with L hops between each source and desired destination is
ℎ𝑜𝑝 𝑐𝑜𝑢𝑛𝑡̅̅̅̅̅̅̅̅̅̅̅̅̅ = ∑𝑘𝐿=1𝑃𝐿 . 𝐿,𝑘
≤ 𝑁
(2)Further, to calculate PL, the probability of both
desired nodes in a network g(r) being in the same neighborhood is
𝑔(𝑟) = ∫ 𝑓𝑋(𝑥)𝑑𝑥 𝑟
0 (3)
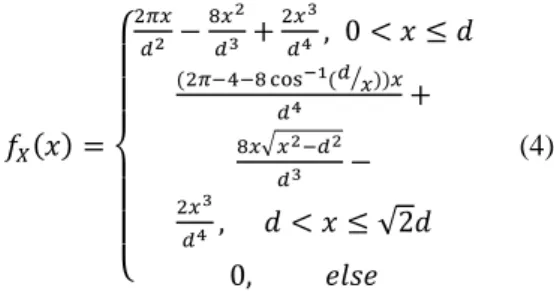
Here, r is the transmission range and fX(x) is the
probability distribution function of the distance X
between two nodes. In [8], fX(x) is calculated as follows
𝑓𝑋(𝑥) =
{ 2𝜋𝑥
𝑑2 − 8𝑥2
𝑑3 + 2𝑥3
𝑑4 , 0 < 𝑥 ≤ 𝑑 (2𝜋−4−8 cos−1(𝑑 𝑥⁄ ))𝑥
𝑑4 +
8𝑥√𝑥2−𝑑2
𝑑3 −
2𝑥3
𝑑4 , 𝑑 < 𝑥 ≤ √2𝑑 0, 𝑒𝑙𝑠𝑒
(4)
Finally, the probability of a route with L links between a source and destination in a flat network with the RWP mobility model is
𝑃𝐿= 𝐾𝐿𝑔(𝑟)𝐿, 1 ≤ 𝐿 ≤ 𝑁 − 1 (5)
Where
𝐾1= 1 (6a)
𝐾𝐿= (𝑁 − 𝐿)𝐾𝐿−1, 2 ≤ 𝐿 ≤ 𝑁 − 1 (6b)
According to the Equation (1), the number of hops for the communication path must be determined to calculate the delay in each connection. Subsequently, to calculate the number of hops, the probability of existing route between each source and desired destination must be estimated.
By adapting Equation (5), we first calculate the probability PL of a route with L hops between a source and destination in a clustered ad hoc network (Equations 10 and 15). Then, the average hop count in each connection is calculated from Equation (2). Finally, the average end-to-end delay is obtained from Equation (1).
As mentioned earlier, in most routing algorithms in clustered ad hoc networks, the desired route between two transmitter and receiver nodes is a route that starts from the transmitter node, arrives at the clusterhead of the transmitter, and then ends up at the node of the receiver through the network infrastructure. In networks without gateways, the infrastructure only includes clusterheads (Fig. 1(a)). In contrast, gateway-based network infrastructure comprises clusterheads and the gateways between them (Fig. 1(b)).
We first compute 𝑃𝐿 for a clustered ad hoc network
without gateways and then consider a network with gateways. Before computing this probability, we calculate the following probabilities.
The probability 𝑃𝑚,𝑚 that both source and
destination nodes are ordinary nodes (not clusterheads) is
𝑃𝑚,𝑚= (𝑁−𝑀
2 )
(𝑁 2)
= (𝑁−𝑀)(𝑁−𝑀−1)𝑁(𝑁−1) (7)
The probability 𝑃𝑚,𝑐ℎ that one of the nodes is a
ordinary node and the other is a clusterhead is
𝑃𝑚,𝑐ℎ= (𝑀
1)(𝑁−𝑀1 ) (𝑁
2)
= 2 .(𝑀)(𝑁−𝑀)𝑁(𝑁−1) (8)
The probability 𝑃𝑐ℎ,𝑐ℎthat both the source and
destination nodes are clusterheads is
𝑃𝑐ℎ,𝑐ℎ= (𝑀
2) (𝑁
2)
= (𝑀)(𝑀−1)𝑁(𝑁−1) (9)
(a)
(b)
Fig 1. Route between source and destination nodes in a clustered ad hoc network (a) without and (b) with
gateways
Volume 10- Number 1 – Winter 2018
39
38
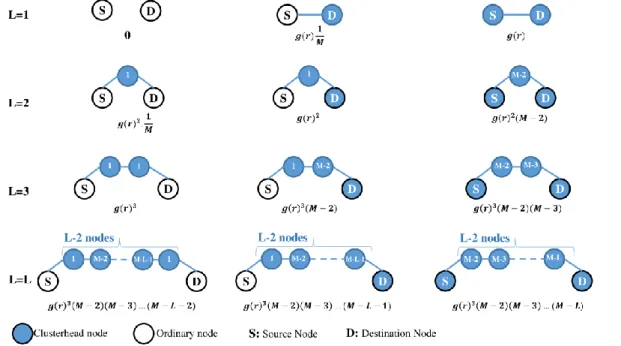
Fig 2. Probability of a route with L hops between a source and destination for the networks without gateway, where both nodes are ordinary, one is ordinary and the other is a clusterhead, and both nodes are clusterheads
- Calculation of probability 𝑷𝑳 in a clustered
network without gateway nodes
In a network without gateways, the route between the source and the destination is a sequence of clusterhead nodes: the first element of this sequence is the clusterhead of the source and the last element is the clusterhead of the destination. In these networks, we calculate the probabilities of a route with L hops between two nodes under the three conditions listed above: both source and destination nodes are ordinary nodes, one of the nodes is ordinary and the other is a clusterhead, and both nodes are clusterheads. According to Equation (3), the probability of a neighborhood containing both desired nodes in network is equal to g(r) [8]. To calculate the probability PL of a route with L hops between the
source and destination nodes at we must first calculate the number of permitted cases for each of the above conditions. Figure 2 shows the probability of a route with L hops between the source and destination under different conditions. In this figure, the number of nodes that can be placed in each location between the source and destination are shown in the corresponding circle.
If both source and destination are ordinary nodes, the probability of existing a route with one hop (L=1) between them is zero because in clustered networks without gateways, two ordinary nodes must be connected by at least one clusterhead (Row1, Column 1). If one of the source and destination nodes is clusterhead, the P is equal to neighborhood probability of two nodes (g(r)) multiplied by probability of two nodes be in the same cluster (Row1, Column 2). If both source and destination are clusterhead, the probability of existing route with one hop between them is g(r) because in the clustered networks, two clusterhead can communicate with each other directly (Row1, Column 3). Generally, if source and destination are ordinary nodes, to existing one route with L hops between them, need a sequence of nodes
with L-2 intermediate nodes so that first node is CH of source and last node is CH of destination. Other nodes in this sequence are selected from remained clusterheads (Row L, Column 1). If the source or destination is clusterhead, its neighbor node in the sequence could be selected from remained clusterheads (Row L, Column 2, 3).
Hence, probability PL is obtained as
𝑃𝐿=
{
𝑃𝑚,𝑐ℎ. 𝑔(𝑟).𝑀1 + 𝑃𝑐ℎ,𝑐ℎ. 𝑔(𝑟), L = 1 𝑃𝑚,𝑚. 𝑔(𝑟)2.𝑀1 + 𝑃𝑚,𝑐ℎ. 𝑔(𝑟)2+ 𝑃𝑐ℎ,𝑐ℎ. 𝑔(𝑟)2. (𝑀 − 2), 𝐿 = 2
𝑃𝑚,𝑚. 𝑔(𝑟)𝐿. 𝑈𝐿−2+ 𝑃𝑚,𝑐ℎ. 𝑔(𝑟)𝐿. 𝑈𝐿−1+
𝑃𝑐ℎ,𝑐ℎ. 𝑔(𝑟)𝐿. 𝑈𝐿, 3 ≤ 𝐿 ≤ 𝑀 + 1
(10)
Where
𝑈0 𝑎𝑛𝑑 𝑈1= 1 (11a)
𝑈𝐿= (𝑀 − 𝐿)𝑈𝐿−1 (11b)
Three points regarding Equation (10) should be considered:
Point 1. In the networks without gateway, each ordinary node (source or destination) can only connect directly with its clusterhead. For this reason, in Equation (10), coefficient 𝑀1 is used (and using high-degree nodes as clusterheads can increase the number of two-hop routes between two ordinary nodes in a network).
Point 2. Equation (10) shows that, for all values of
L except for L = 2, probability 𝑃𝐿 increases as the
number of clusterheads M is increased. For L = 2, there is also a threshold 𝑀𝑡ℎ𝑟𝑒𝑠ℎ𝑜𝑙𝑑 such that the value of 𝑃2
rapidly increases if it is exceeded. To obtain
𝑀𝑡ℎ𝑟𝑒𝑠ℎ𝑜𝑙𝑑, the following equation should be
differentiate twice and then its roots obtained. The value of 𝑀𝑡ℎ𝑟𝑒𝑠ℎ𝑜𝑙𝑑 is equal to the largest root.
𝑃2= 𝑁(𝑁−1)1 . 𝑀3−𝑁(𝑁−1)5 . 𝑀2+ 𝑁(𝑁−1)(2𝑁+3). 𝑀 + 𝑁(𝑁−1)1−2𝑁 +𝑀1 (12)
To reduce the combinatorial complexity of calculations arising from higher numbers, the numerical method in Equation (12) can be used to calculate the value of 𝑀𝑡ℎ𝑟𝑒𝑠ℎ𝑜𝑙𝑑 for different values of
N. For example, for N = 50, 100, 200, and 400 nodes,
𝑀𝑡ℎ𝑟𝑒𝑠ℎ𝑜𝑙𝑑 is respectively 10, 7, 6, and 13. Therefore,
for L = 2, except for the small interval M< 𝑀𝑡ℎ𝑟𝑒𝑠ℎ𝑜𝑙𝑑,
probability𝑃𝐿 increases along with the number of
clusterheads M. This interval has a limited growth as the number of nodes further increases and can be ignored. Therefore, a larger number of clusterheads increases the probability of a route with fewer hops between the source and destination. In other words, if the network is connected (∑𝑀+1𝐿=1 𝑃𝐿= 1), the average
hop count and, consequently, end-to-end delay in the network, decreases if the number of clusterheads increases.
Point 3: It was found that by increasing the number of clusterheads, the probability of shorter routes increases. However, it could be that there is a better route for each pair of origin and destination nodes if M
is increased. For a route with two hops, this is not true. In Equation (10) for L = 2, it is clear that the first term is less than M. This term shows that if the source and destination nodes are both ordinary nodes, the probability of two-hop routes between them decreases with as the number of clusterheads increases. By increasing the number of clusterheads, the probability that the ordinary nodes are two distinct clusters increases. In which case the two nodes cannot connect through a common clusterhead node and more than two hops are required. This is because source and destination nodes can only connect directly with their clusterheads if gateways aren’t used. Therefore, if the network is not connected, with a number of different clusterheads, and the average hop count can only be compared for common exchanges, which are exchanges in which a route is found for two nodes for all numbers of clusterheads. In such a case, the average hop count is an increment function for value of𝑀 ≤𝑁2.
However, this function is descending for 𝑀 >𝑁2 because in this mode, the value of the first term in Equation (10) decreases.
- Calculation of 𝑷𝑳 in a gateway-based clustered
network
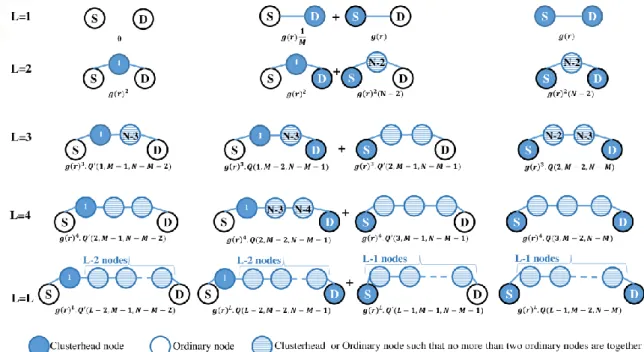
In a gateway-based clustered network, the route between the source and the destination is a sequence of clusterheads such that the first element of this sequence is the clusterhead of the source node and between the two adjacent clusterheads in this sequence, zero, one or
two non-cluster nodes can be placed as a gateway. Here, we need to calculate the number of permitted cases that can be used to create a route between the source and destination. In a gateway-based network, there are at most two gateway nodes between the two adjacent clusterheads in a route. In this section, the probability PL of a route with L hops for different
source and destination node positions are calculated separately (Fig. 3). In figure 3, the number of nodes that can be placed in any location on the route are indicated inside the circle. The calculation steps are similar to the previous one, with the difference that in this case, two clusterheads in addition to direct communication can communicate through one or two ordinary nodes as gateway. It is clear that, in a gateway-based clustered network, this probability can be calculated as follows
𝑃𝐿=
{
𝑃𝑚,𝑐ℎ 2 . 𝑔(𝑟).
1 𝑀+
𝑃𝑚,𝑐ℎ
2 . 𝑔(𝑟) + 𝑃𝑐ℎ,𝑐ℎ. 𝑔(𝑟), L = 1 𝑃𝑚,𝑚. 𝑔(𝑟)2+
𝑃𝑚,𝑐ℎ
2 . 𝑔(𝑟)2+ 𝑃𝑚,𝑐ℎ
2 . (𝑁 − 2). 𝑔(𝑟)2+ 𝑃𝑐ℎ,𝑐ℎ. 𝑔(𝑟)2(𝑁 − 2), 𝐿 = 2 𝑃𝑚,𝑚. 𝑔(𝑟)𝐿. 𝑄′(𝐿 − 2, 𝑀 − 2, 𝑁 − 𝑀 − 2) + 𝑃𝑚,𝑐ℎ
2 . 𝑔(𝑟)𝐿. 𝑄(𝐿 − 2, 𝑀 − 2, 𝑁 − 𝑀 − 1) + 𝑃𝑚,𝑐ℎ
2 . 𝑔(𝑟)𝐿. 𝑄′(𝐿 − 1, 𝑀 − 1, 𝑁 − 𝑀 − 1) + 𝑃𝑐ℎ,𝑐ℎ. 𝑔(𝑟)𝐿. 𝑄(𝐿 − 1, 𝑀 − 2, 𝑁 − 𝑀),
2 ≤ 𝐿 ≤ 𝑀 + 1 (15)
In this equation, function Q(k, c, o) shows the number of allowed cases to locate K nodes between two clusterheads, and function Q'(k, c, o) shows the number of allowed cases to locate K nodes between a clusterhead and an ordinary node. For both Q and Q’,
each of the K intermediate nodes can be selected from among the c remaining clusterheads (excluding the primary and end nodes and the source and destination nodes), or o the remaining ordinary nodes (excluding the beginning and end nodes and the source and destination nodes), such that in each route, more than two nodes are not placed together. In the following, we first derive Q and then Q'.
We know that to construct a route with k hops between the two nodes of the clusterhead, a minimum of ⌊𝑘3⌋ clusterhead nodes are necessary because a clusterhead must be placed between both ordinary nodes.
Volume 10- Number 1 – Winter 2018 41
Fig 3. Probability of a route with L hops between a source and destination for gateway-based networks where both nodes are ordinary nodes, one is an ordinary node and the other is a clusterhead, and both are clusterheads
This number of clusterheads can be placed between two clusterheads using the pattern “- - CH- - CH - - CH - -CH - - CH - - CH - - CH - -.” Each CH represents one of the ⌊𝑘3⌋ clusterhead nodes and each dash can be either an ordinary node, a clusterhead, or nothing. In contrast, the number of ordinary nodes used between these two clusterheads can range from 0 to𝑘 − ⌊𝑘3⌋. Therefore, Q(k, c, o), where k is the number of permitted cases between the two clusterheads, c is the number of clusterheads, and o is the number of ordinary nodes, can be calculated as follows
𝑄(𝑘, 𝑐, 𝑜) =
∑𝑘−⌊𝑘 3𝑖=0 ⁄ ⌋(𝑐−𝑘+𝑖)!𝑐! .(𝑜−𝑖)!𝑜! . (∑⌊𝑖 2𝑗=0⁄ ⌋(𝑘 − 𝑖 + 1𝑖 − 𝑗 ) (𝑖 − 𝑗𝑗 )) , 𝐾 ≥ 1 (16)
The value of i in the first summation is the number of ordinary nodes in the route. The value of j in the second summation shows the number of times two ordinary nodes can be located adjacent to each other in the route.
For a case for which one end is a clusterhead and the other is ordinary node (Q'(k, c, o)) we can calculate
Q(k, c, o) and then subtract the unauthorized excess cases which are cases where the first and second nodes adjacent to the ordinary node are ordinary nodes, and the third node is a clusterhead. Therefore, Q' can be calculated as follows
𝑄′(𝑘, 𝑐, 𝑜) =
{
𝑄(𝑘, 𝑐, 𝑜), 𝑘 = 1 𝑄(𝑘, 𝑐, 𝑜) − 𝑜. (𝑜 − 1), 𝑘 = 2 𝑄(𝑘, 𝑐, 𝑜) − 𝑜. (𝑜 − 1). 𝑐, 𝑘 = 3
𝑄(𝑘, 𝑐, 𝑜) −
𝑜. (𝑜 − 1). 𝑐. 𝑄(𝑘 − 3, 𝑚 − 1, 𝑜 − 2), 𝑘 ≥ 4
(17)
In a gateway-based clustering structure, every ordinary source node can only connect directly with its clusterhead. For this reason, in Equation (10), a
coefficient of 𝑀1 is used. Here, unlike in the structure without gateway, if the source node is a clusterhead, it can be directly connected with any other node (whether they are cluster members or not).
Equation (15) indicates that for all values of L
probability 𝑃𝐿 increases with the number of
clusterheads M. Therefore, increasing the number of clusterheads increases the probability of a route with fewer hop count between the source and destination. In other words, whether the network is connected to a gateway-based structure or not, increasing the number of clusterheads reduces the average number of hop count, which will hence decrease the end-to-end delay. Equations (10) and (15) show, respectively, that for clustered networks without gateways (in a connected network) and with gateways (in a connected or non-connected network), more clusterheads M increase the likelihood of a route with L hops. If the routing algorithm works correctly, that is, if there are two routes with hop count of L and L + 1, the route with L
+ 1 hop counts is not selected. Therefore, by increasing
M, the probability of choosing a route with a lower hop counts increases. In contrast, by increasing the number of clusters, the average number of members in each cluster is reduced and the intra-cluster delay, which results from the queuing and delay of resource allocation in channels based on time division multiple access (TDMA )[2, 17] decreases. As a result, according to Equations (1) and (2), an increase in the number of clusterheads causes a decrease in the average end-to-end delay in the network. For clustered structure without gateway that network is not connected, the average hop counts with respect to cluster number first increases and then decreases, so that the optimal hop count is obtained when all nodes are clusterheads.
C. Connectivity Analysis
The probability of existing at least one route
between two nodes in a network indicates the level of connectivity in a network. According to Equation (10), the probability of a route between each network node in a clustered MANET network with and without gateways can be respectively calculated as follows:
𝑃𝑐𝑜𝑛𝑛𝑒𝑐𝑡𝑖𝑣𝑖𝑡𝑦= ∑𝑀+1𝐿=1𝑃𝐿 (18)
𝑃𝑐𝑜𝑛𝑛𝑒𝑐𝑡𝑖𝑣𝑖𝑡𝑦= ∑𝑁−1𝐿=1𝑃𝐿 (19)
Where 𝑃𝐿 is the probability of a route with L hops
between the source and destination, as obtained from Equations (10) and (15). Because 𝑃𝐿 is an increasing
function with respect to M, in both structures with and without gateways, the network connectivity increases as the number of clusterheads increases.
D. Routing Load Analysis
The routing load refers to the amount of control load needed to find and maintain the best route between network nodes. In clustered networks, the routing load can be divided into two parts (Equation (20)): hello message control packets, which are periodically provided by all nodes and broadcast over the whole network(Hello packets) and control packets for route discovery, generated by source and destination nodes and retransmitted by clusterheads and gateways(Route Discovery Load).
𝑅𝑜𝑢𝑡𝑖𝑛𝑔𝐿𝑜𝑎𝑑 = 𝐻𝑒𝑙𝑙𝑜𝑃𝑎𝑐𝑘𝑒𝑡𝑠 + 𝑅𝑜𝑢𝑡𝑒𝐷𝑖𝑠𝑐𝑜𝑣𝑒𝑟𝐿𝑜𝑎𝑑 (20)
Because hello messages are generated by all nodes and are sent as a pandemic, their number does not depend on the number of clusterheads, and for this reason, we compare only the number of route discovery packets with respect to the number of clusterheads.
The route discovery control load contains the transmissions required for route request (RREQ) and reply (RREP) messages (the transmission of a packet from a node to a neighboring node is considered one transmission). Before establishing a connection, a RREQ message is sent in the form of a packet from the source node to the clusterhead, and then the packet is sent to the forwarding clusterhead through cluster and gateways. However, ordinary nodes do not transfer this packet (unlike algorithms such as Ad hoc on demand distance vector), in which the RREQ packets broadcast over the whole network). Therefore, before each exchange, M + GW + 1 transmissions are needed to transmit a RREQ message in the network. After finding route, the RREP is transmitted from the shortest route to the source. Therefore, the number of required transmissions for a RREP message in the return route is equal to 𝐻𝑜𝑝𝐶𝑜𝑢𝑛𝑡̅̅̅̅̅̅̅̅̅̅̅̅̅̅. As a result, the route discovery load in each exchange is obtained as follows:
𝑅𝑜𝑢𝑡𝑒𝐷𝑖𝑠𝑐𝑜𝑣𝑒𝑟𝑦𝐿𝑜𝑎𝑑(𝑖𝑛 𝑒𝑎𝑐ℎ 𝑒𝑥𝑐ℎ𝑎𝑛𝑔𝑒) = 𝑀 + 𝐺𝑤 + 1 + 𝐻𝑜𝑝𝐶𝑜𝑢𝑛𝑡̅̅̅̅̅̅̅̅̅̅̅̅̅̅ (21)
Where the Gw value in the clustering without
gateway is zero. Equation (21) shows that increasing the number of clusterheads M on the one hand increases the routing load in each exchange but, on the
other hand, reduces the average hop count (𝐻𝑜𝑝𝐶𝑜𝑢𝑛𝑡̅̅̅̅̅̅̅̅̅̅̅̅̅̅), which in turn reduces the routing load.
An important point to note is that although an increase in the number of clusterheads increases the number of RREQ and routing load transmissions in each exchange, it can reduce the number of hops per exchange, which leads to fewer hops in each connection between the source and the destination. Thus, the total number of data packets and the total amount of transmissions in the network decreases. Therefore, for a proper analysis, it is better to evaluate the total traffic load in the network, i.e., both data traffic and control.
To calculate the total traffic load in each connection, first, we assume 𝑏̅ is the average number of packets that are transmitted when finding a route (a successful connection) and over the time that route is exist. This parameter depends on factors such as the radius of the node neighborhood, the node velocity, and the bit rate of the network, and can be calculated as follows.
𝑏̅ = 𝑃𝐸𝑇̅̅̅̅̅̅. 𝑃𝑎𝑐𝑘𝑒𝑡𝑅𝑎𝑡𝑒 (22)
In this equation, Packet Rate is the packet transmission rate of the nodes, and𝑃𝐸𝑇̅̅̅̅̅̅ is the average path expiration time between the source and the destination. 𝑃𝐸𝑇̅̅̅̅̅̅ is the time that takes to expire the first link on the route between the source and the destination. In this case, the amount of traffic load for each successful connection, i.e., the number of required transmissions for exchanging data and control packets, is obtained as
𝑇𝑟𝑎𝑓𝑓𝑖𝑐𝐿𝑜𝑎𝑑(𝑖𝑛 𝑆𝑢𝑐𝑐𝑒𝑠𝑠𝑓𝑢𝑙 𝑒𝑥𝑐ℎ𝑎𝑛𝑔𝑒) = [𝐻𝑜𝑝𝐶𝑜𝑢𝑛𝑡̅̅̅̅̅̅̅̅̅̅̅̅̅̅ . 𝑏̅] + [𝑀 + 𝐺𝑤 + 1 + 𝐻𝑜𝑝𝐶𝑜𝑢𝑛𝑡̅̅̅̅̅̅̅̅̅̅̅̅̅̅] (23)
In this equation, Gw is zero in clustering without
gateway. Equation 23 is true for each successful and sustainable route between the source and the destination. If the route is lost due to the mobility of nodes during the transmission of data traffic, then the traffic load for a new route should be recalculated using this equation. In unsuccessful connections, where no route is found between the source and the destination, RREQ transmissions are sent in the network (M + GW + 1) so the average traffic load of the network in each connection (successful and unsuccessful) can be calculated as
𝑇𝑟𝑎𝑓𝑓𝑖𝑐𝐿𝑜𝑎𝑑(𝑖𝑛 𝑒𝑎𝑐ℎ 𝑒𝑥𝑐ℎ𝑎𝑛𝑔𝑒) = 𝐶𝑅. [𝐻𝑜𝑝𝐶𝑜𝑢𝑛𝑡̅̅̅̅̅̅̅̅̅̅̅̅̅̅ . 𝑏̅ + 𝐻𝑜𝑝𝐶𝑜𝑢𝑛𝑡̅̅̅̅̅̅̅̅̅̅̅̅̅̅] +
[𝑀 + 𝐺𝑤 + 1] (24)
In this equation, CR (connectivity ratio) indicates the ratio of success of finding a route between the source and the destination and can be calculated from
𝐶𝑅 = 𝑁𝑢𝑚𝑏𝑒𝑟 𝑜𝑓 𝑡𝑖𝑚𝑒𝑠 𝑎 𝑟𝑜𝑢𝑡𝑒 ℎ𝑎𝑠 𝑏𝑒𝑒𝑛 𝑓𝑜𝑢𝑛𝑑 𝑁𝑢𝑚𝑏𝑒𝑟 𝑜𝑓 𝑡𝑖𝑚𝑒𝑠 𝑎 𝑟𝑜𝑢𝑡𝑒 𝑖𝑠 𝑟𝑒𝑞𝑢𝑒𝑠𝑡𝑒𝑑 (25)
Equation (24) shows that if 𝑏̅ is large enough (𝑏̅ >
𝑏𝑡ℎ𝑟𝑒𝑠ℎ𝑜𝑙𝑑), the decrease in 𝐻𝑜𝑝𝐶𝑜𝑢𝑛𝑡̅̅̅̅̅̅̅̅̅̅̅̅̅̅ due to the
increase in M can reduce the total traffic load of the total network. To calculate𝑏𝑡ℎ𝑟𝑒𝑠ℎ𝑜𝑙𝑑, we assume that
M1 and M2 are the number of clusterheads, 𝐺𝑤1 and 𝐺𝑤2 are the number of gate nodes, and ℎ1 and ℎ2, are
the average hop counts for common routes found in the
Volume 10- Number 1 – Winter 2018 43
two clustering algorithms. For 𝑀2> 𝑀1, we have 𝐻2< 𝐻1, and in this case, 𝑏𝑡ℎ𝑟𝑒𝑠ℎ𝑜𝑙𝑑 is calculated using
𝑏𝑡ℎ𝑟𝑒𝑠ℎ𝑜𝑙𝑑=(𝑀2𝐶𝑅+𝐺𝑤2)−(𝑀1+𝐺𝑤1)
1∩2 . (𝐻1−𝐻2) − 1 (26)
In this equation, 𝐶𝑅1∩2 is the ratio of success of
finding a route in both algorithms and can be calculated from
𝐶𝑅1∩2=
𝑁𝑢𝑚𝑏𝑒𝑟 𝑜𝑓 𝑡𝑖𝑚𝑒𝑠 𝑎 𝑟𝑜𝑢𝑡𝑒 ℎ𝑎𝑠 𝑏𝑒𝑒𝑛 𝑓𝑜𝑢𝑛𝑑 𝑖𝑛 𝑏𝑜𝑡ℎ 𝑁𝑢𝑚𝑏𝑒𝑟 𝑜𝑓 𝑡𝑖𝑚𝑒𝑠 𝑎 𝑟𝑜𝑢𝑡𝑒 𝑖𝑠 𝑟𝑒𝑞𝑢𝑒𝑠𝑡𝑒𝑑 (27)
Consequently, if, in a network, the transmission range, node velocity, and bit rate are such that 𝑏̅, the average number of packets in each successful connection, is above threshold, then increasing the number of clusters from M1 to M2 decreases the total
traffic load in a network.
IV. Simulation Results
In this section, the simulation of both clustering algorithms, without and with gateways, are presented separately and for different cluster numbers. To create a number of different clusterheads in each algorithm, different transmission range were used to create and maintain the clusters. Moreover, for all algorithms, for the exchange of information during simulation, the transmission range of the nodes were fixed to r. Clusterheads were selected randomly disregarding the characteristics of the nodes. We also set the initial battery power of the nodes so that turns off the nodes do not affect the simulation results. The proposed clustering algorithms were evaluated in MATLAB software. Each test was executed 10 times for 1,000 seconds and the averages of the results were used to evaluate the algorithm. The initial position of each node is based on a uniform random distribution. All simulation parameters are presented in Table 2.
First, metrics are provided for measuring each end-to-end delay parameter, network connectivity, and routing load performance. Then, based on these metrics, the simulation results for each algorithm are provided.
A. Network Connectivity
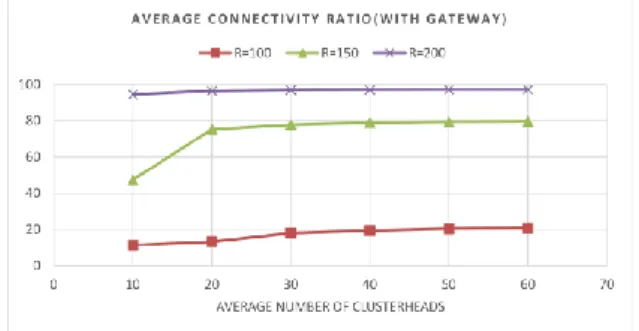
To assess network connectivity, we use a new metric CR (connection ratio), which is equal to the number of times that route has been found between the source and the destination divided by the number of requests for exchange multiplied by 100%. This metric is shown in figures 4 and 5, respectively, for clustering algorithms without and with gateways and different transmission range. As both figures show, network connectivity increases when the number of clusterheads increases. As mentioned earlier, this is due to the increase of the probability of a route between two nodes of the network. According to figures 4 and 5, it is clear that for clustering algorithms with and without gateways, the growth in connectivity is much higher when the number of clusters is increased.
B. End-To-End Delay
To evaluate the average end-to-end delay, the average hop count in the network should be evaluated.
For a fair analysis of this metric, we evaluated two metrics separately: the total number of routes found for each hop count and average number of hops for common exchanges (the common exchanges is refer to the exchanges that a route has been found for all the algorithms with different numbers of clusterheads).
Table 2. Simulation Parameters
Values Parameters
1000m x 1000m Simulation area
60 Number of mobile
nodes (N)
100m,150m and 200m Transmission ranges
8 m/s Maximum velocity
(𝑉𝑚𝑎𝑥)
2 m/s Minimum
velocity(𝑉𝑚𝑖𝑛)
3s Maximum Pause Time
Random way point Mobility model
Constant bit rate (CBR) Traffic model
In algorithms without gateway
50-700, with gateway
1-10 Packet Rate
Fig 4. Network connectivity in the clustering algorithm without gateways for different numbers of clusterheads
Fig 5. Network connectivity in the gateway-based clustering algorithm for different numbers of clusterheads
- Total number of routes found by separating the hop counts
4
Figures 6 and 7 show the number of routes for each hop count, for clustering algorithms without and with gateways, respectively, for a transmission range of r = 150. In both figures, it is clear that by increasing the number of clusterheads, the frequency of routes increases. This increase is higher for lower hop counts. In figure 6, for networks with fewer clusterheads (M = 20) there is a peak for routes with a hop count off two. As discussed earlier, this is due to the fact that in clustering without gateways and networks fewer clusterheads, most of the routes are related to intra-cluster exchanges. In figure 7, for algorithms with 20 clusterheads, there is a dip for routes with a hop count of four. This is due to the fact that in the simulation conditions of this study, for gateway-based algorithms, the probability of a route with four hops is less than the probability of a route with three hops between a source and destination (𝑃3> 𝑃4). The reason for this is that,
as shown in figure 3, to change the routes from four hops to three hops, a new node should be placed in the route that must be a clusterhead. Hence, we have𝑃4≈ 𝑀. 𝑔(𝑟). 𝑃3. In contrast, according to the simulation
parameters, the probability of two neighboring nodes in the network is equal to 0.03 𝑔(𝑟) ≈ 0.03. Hence, for
𝑀 < 33, we have𝑃3> 𝑃4.
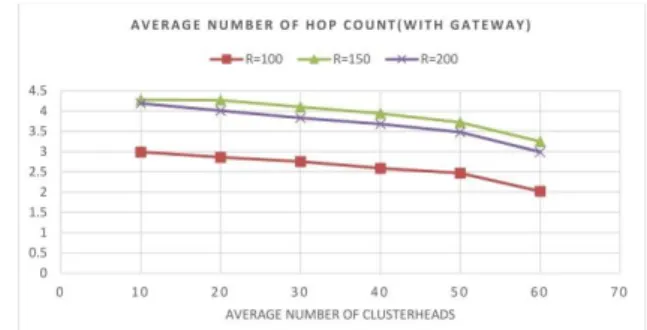
- Average hop count for common exchanges Figures 8 and 9 show the average hop count for common exchanges in clustering algorithms without gateways and with gateways, respectively. Figure 8 shows that in clustering algorithms without gateway, for a certain transmission range, increasing the number of clusterheads initially increases and then reduces the average hop count in the network (as previously proven). For each transmission range, the best average value for the hop count is when all nodes are clusterheads. According to figure 9, in gateway-based clustering algorithms, for each constant transmission range, the ratio of the average hop count to the number of clusterheads is always descending. In these algorithms, for each transmission range, the best average hop count is when all nodes are clusterheads. In figures 8 and 9, the average hop count is calculated only for common routes, so the difference in behavior for different transmission range is justified (smaller transmission ranges mean that fewer routes are found and the hop count per route is lower).
Fig 6. Total number of routes for each hop count in the clustering algorithm without gateways
Fig 7. Total number of routes for each hop count in the clustering algorithm with gateways
Fig 8. Average hop count for common exchanges in the clustering algorithm without gateways
Fig 9. Average hop count for common exchanges for the gateway-based clustering algorithm
C. Routing Load
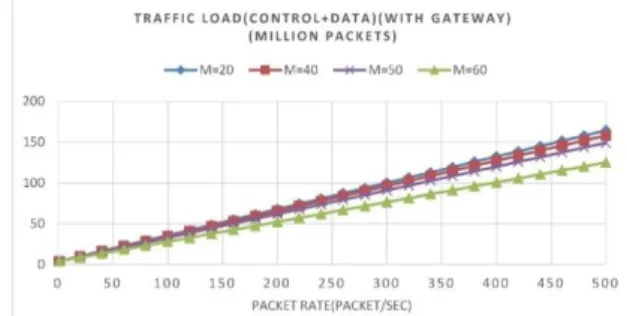
As mentioned earlier, transmitting a packet from a node to a neighborhood node is called a transmission. For example, transmitting ten packets on a five-hop route requires fifty transmissions. To evaluate the routing load performance, two metrics are considered: the number of control transmissions for the finding route (Route Discovery Load) and the total number of control and data transmissions in the network (Traffic Load). Here, for the fair comparison, the second metric is calculated for connections, and a route is found for all the algorithms for a number of different clusterheads. Figures 10, 11, 12, and 13 show these two metrics for clustering algorithms without and with gateways for transmission range r = 150. The horizontal axis in these charts shows the packet transmission rate in the network.
Figures 10 and 11 clearly show that algorithms with more clusterheads have more average control transmissions. However, as shown in figure 11, for the gateway-based algorithms, there are very few differences between the algorithms with 40, 50, or 60 clusters.
Volume 10- Number 1 – Winter 2018 45
Fig 10. Number of control transmissions for finding a route in the clustering algorithm without gateways
Fig 11. Number of control transmissions for finding a route in the clustering algorithm with gateways
Fig 12. Number of control and data transmissions for common exchanges in clustering algorithms without gateways
Fig 13. Number of control and data transmissions for common exchanges in the clustering algorithm with gateways
This is because, in addition to clusterheads, numerous nodes undertake the role of gateways in the network and are placed in the network infrastructure. According to figures 12 and 13, algorithms with more clusterheads have a lower overall traffic load (except two networks with M = 20 and M = 40, which are same
because of the similarity of the average hop count in each connection). As stated above, increasing the packet rate in the network will increase the average number of packets (𝑏̅) transmitted in each successful exchange. If the value of 𝑏̅ is larger than a threshold
𝑏𝑡ℎ𝑟𝑒𝑠ℎ𝑜𝑙𝑑, increasing the number of clusterheads will
reduce the traffic load of the network. It is clear, in the gateway-based algorithms, because of the use of gateways, the threshold 𝑏𝑡ℎ𝑟𝑒𝑠ℎ𝑜𝑙𝑑needed for the bit
rate is much lower (Equation (26)). V. CONCLUSIONS
In this paper, the effect of clusterheads on the average end-to-end delay, network connectivity, and routing load was investigated in clustered MANETs. We proved analytically that in clustered ad hoc networks, the best delay and connectivity performances are obtained when all network nodes are clusterheads. We also showed that although the routing load increases when the number of clusterheads increases, if the average number of packets transmitted per exchange is greater than a threshold, the traffic load of the total network decreases. The simulation results also confirm this claim. All evaluations in this study were carried out for two clustering modes: with and without gateways. In the future, we plan to provide a formula for calculating the number of optimal clusterheads in MANETs by identifying the effect of clusterheads on other quality-of-service metrics in the network so that the best quality of service is obtained.
ACKNOWLEDGMENT
We thank Kim Moravec, PhD, from Edanz Group (www.edanzediting.com/ac) for editing a draft of this manuscript.
REFERENCES
1. Ahmadi, M., Shojafar, M., Khademzadeh, A., Badie, K., & Tavoli, R. (2015). A hybrid algorithm for preserving energy and delay routing in mobile ad-hoc networks. Wireless Personal Communications, 85(4), 2485-2505.
2. Chatterjee, M., Das, S. K., & Turgut, D. (2002). WCA: A weighted clustering algorithm for mobile ad hoc networks. Cluster computing, 5(2), 193-204.
3. Aissa, M., & Belghith, A. (2014). Quality of Clustering in mobile Ad Hoc networks. Procedia Computer Science, 32, 245-252.
4. Hussain, S. M., Nizamuddin, S. A., Asuncion, R., Ramaiah, C., & Rehman, S. U. (2016). Least delay path estimation routing protocol (LDPERP) with enhanced multimedia transmission through parallel links over heterogeneous MANETS. Paper presented at the Research and Development (SCOReD), 2016 IEEE Student Conference on.
5. Maan, F., & Mazhar, N. (2011, June). MANET routing protocols vs mobility models: A performance evaluation. In Ubiquitous and Future Networks (ICUFN), 2011 Third International Conference on (pp. 179-184). IEEE.
6. Perkins, C. E., Royer, E. M., Das, S. R., & Marina, M. K. (2001). Performance comparison of two on-demand routing protocols for ad hoc networks. IEEE Personal communications, 8(1), 16-28.
7. Farhadi, G., & Beaulieu, N. C. (2006). On the connectivity and average delay of mobile ad hoc networks. Paper presented at the Communications, 2006. ICC'06. IEEE International Conference on.
8. Tan, Y., & Li, X. (2010). A Study of End-to-end Delay in MANET. Paper presented at the Pervasive Computing Signal Processing and Applications (PCSPA), 2010 First International Conference on.
9. Hakak, S., Anwar, F., Latif, S. A., Gilkar, G., & Alam, M. K. (2014). Impact of packet size and node mobility pause time on average end to end delay and Jitter in MANET's. Paper presented at the Computer and Communication Engineering (ICCCE), 2014 International Conference on.
10. Wang, C., Ye, B., Wang, X., Guo, S., & Lu, S. (2014). Delay and Capacity Analysis in MANETs with Correlated Mobility and ${f} $-Cast Relay. IEEE Transactions on Parallel and Distributed Systems, 25(11), 2829-2839.
11. Jia, R., Yang, F., Yao, S., Tian, X., Wang, X., Zhang, W., & Xu, J. (2016). Optimal Capacity-Delay Tradeoff in MANETs with Correlation of Node Mobility. IEEE Transactions on Vehicular Technology.
12. Abolhasan, M., Wysocki, T., & Dutkiewicz, E. (2004). A review of routing protocols for mobile ad hoc networks. Ad hoc networks, 2(1), 1-22.
13. Ali, H., Shahzad, W., & Khan, F. A. (2012). Energy-efficient clustering in mobile ad-hoc networks using multi-objective particle swarm optimization. Applied Soft Computing, 12(7), 1913-1928.
14. Wang, X., Cheng, H., & Huang, H. (2014). Constructing a manet based on clusters. Wireless Personal Communications, 75(2), 1489-1510.
15. Aissa, M., Belghith, A., & Drira, K. (2013). New strategies and extensions in weighted clustering algorithms for mobile ad hoc networks. Procedia Computer Science, 19, 297-304.
16. Sett, S., & Thakurta, P. K. G. (2015). Multi Objective Optimization on Clustered Mobile Networks: An ACO Based Approach Information Systems Design and Intelligent Applications (pp. 123-133): Springer.
17. Assareh, R., Sabaei, M., Khademzadeh, A., & Reshadi, M. (2017). A Novel Many-Objective Clustering Algorithm in Mobile Ad Hoc Networks. Wireless Personal Communications, 97(2), 2971-2997.
AUTHOR BIOGRAPHIES
Reza Assareh received his B.Sc. and M.S.c degree in computer engineering from Islamic Azad University respectively in 2004 and 2007. He is now Ph.D. candidate at the Department of Computer Engineering at Islamic Azad University, Research & Science Branch, Tehran, Iran. Assareh is a lecturer at Islamic Azad University Shahr-e-Rey Branch. His research interests include mobile adhoc networks, wireless sensor network and RFID system. E-mail: [email protected]
Masoud Sabaei received his B.Sc. degree from Esfahan University of Technology, Esfahan, Iran, and his M.Sc. and Ph.D. form Amirkabir University of Technology (Tehran Polytechnic), Tehran, Iran, all in the field of Computer Engineering in 1992, 1995 and 2000, respectively. Dr. Sabaei has been professor of Computer Engineering Department, Amirkabir University of Technology (Tehran Polytechnic), Tehran, Iran since 2002. His research interests are
wireless networks, mobile ad hoc networks, wireless sensor networks, and telecommunication network management.
Ahmad Khademzadeh was born in Mashhad, Iran, in 1943. He received the B.Sc. degree in applied physics from Ferdowsi University, Mashhad, Iran, in 1969 and the M.Sc., Ph.D. degrees respectively in Digital Communication and Information Theory and Error Control Coding from the University of Kent, Canterbury, U. K. He is currently the Head of Education and National Scientific and Informational Scientific Cooperation Department at Iran Telecom Research Center (ITRC). He was the head of Test Engineering Group and the director of Computer and Communication Department at ITRC. He is also a lecturer at Tehran Universities and he is a committee member of Iranian Computer society and also a committee member of the Iranian Electrical Engineering Conference Permanent Committee. Dr. Khadem Zadeh has been received four distinguished national and international awards including Kharazmi International Award, and has been selected as the National outstanding researcher of the Iran Ministry of Information and Communication Technology. Mr.Khadem Zadeh could be reached at [email protected].
Midia Reshadi is currently an Assistant Professor at the Science and Research Branch of the Islamic Azad University (SRBIAU), in the Computer and Electrical Engineering Department. He is carrying out his research at SRBIAU in the field of communication infrastructures of multi-core chips in NoCLab laboratory. Involved research topics are Photonic NoCs, fault and yield issues in NoCs, routing and switching in on-chip communication networks. He received an M.Sc. in Computer architecture in SRBIAU. Previously, his B.Sc. was in the field of Computer Hardware Engineering from the Arak Branch of the Islamic Azad University. He carried out his M.Sc. and Ph.D thesis under supervision of Dr. Ahmad Khademzadeh.
Volume 10- Number 1 – Winter 2018 47