User Guide
IM/ACT–EN Issue 1Data Management Software
AutoChart
ABB
EN ISO 9001:2000
Cert. No. Q 05907
EN 29001 (ISO 9001)
Lenno, Italy – Cert. No. 9/90A
Stonehouse, U.K.
0255
The Company
We are an established world force in the design and manufacture of instrumentation for industrial process control, flow measurement, gas and liquid analysis and environmental applications.
As a part of ABB, a world leader in process automation technology, we offer customers application expertise, service and support worldwide.
We are committed to teamwork, high quality manufacturing, advanced technology and unrivalled service and support.
The quality, accuracy and performance of the Company’s products result from over 100 years experience, combined with a continuous program of innovative design and development to incorporate the latest technology.
The UKAS Calibration Laboratory No. 0255 is just one of the ten flow calibration plants operated by the Company and is indicative of our dedication to quality and accuracy.
Information in this manual is intended only to assist our customers in the efficient operation of our equipment. Use of this manual for any other purpose is specifically prohibited and its contents are not to be reproduced in full or part without prior approval of the Technical Publications Department.
Health and Safety
To ensure that our products are safe and without risk to health, the following points must be noted: 1. The relevant sections of these instructions must be read carefully before proceeding. 2. Warning labels on containers and packages must be observed.
3. Installation, operation, maintenance and servicing must only be carried out by suitably trained personnel and in accordance with the information given.
4. Normal safety precautions must be taken to avoid the possibility of an accident occurring when operating in conditions of high pressure and/or temperature.
5. Chemicals must be stored away from heat, protected from temperature extremes and powders kept dry. Normal safe handling procedures must be used.
6. When disposing of chemicals ensure that no two chemicals are mixed.
Data Management Software AutoChart Contents
Contents
1 Accessing AutoChart ... 2 1.1 Account Activation ... 2 1.2 Logging On ... 3 1.3 Forgotten Password ... 3 2 Navigation ... 4 3 Charting ... 43.1 Chart Page Overview ... 4
3.2 Meters Panel ... 5 3.3 Date Selector ... 6 3.4 Chart Settings ... 6 3.4.1 Data Source ... 6 3.4.2 Chart Style ... 6 3.4.3 Data Annotation ... 7 3.5 Legend Panel ... 7 3.6 Data View ... 7 3.7 Exporting Data ... 8 3.8 Printing ... 8 4 Account Management ... 8 4.1 Changing Password ... 8 5 Administration ... 9
5.1 Administration Page Overview ... 9
5.2 Meter Administration ... 9
5.2.1 Amending Meter Names ... 9
5.2.2 Amending Meter Locations ... 10
5.2.3 Adding Meter Groups ... 10
5.2.4 Amending Meter Groups ... 10
5.2.5 Adding Meter Sites ... 11
5.2.6 Amending Meter Sites ... 11
5.3 User Administration ... 12
5.3.1 Adding New Users ... 12
5.3.2 Amending User Details ... 13
5.3.3 Amending User Passwords ... 13
5.3.4 Amending User Security Permissions ... 14
5.3.5 Moving Users to Different Organizations ... 14
5.4 Security Groups ... 15
5.4.1 Adding New Security Groups ... 15
5.4.2 Amending Security Group Details ... 15
5.4.3 Amending Security Group Meter Access Permissions ... 16
5.4.4 Amending Security Group Members ... 16
5.5 Organizations ... 17
5.5.1 Adding New 'Child' Organizations ... 17
5.5.2 Amending Organization Details ... 17
5.6 Meter Ownership ... 17
5.6.1 Granting Access to Meters ... 17
5.6.2 Transferring Meter Ownership0 ... 18
Appendix A – Glossary ... 19
Data Management Software
AutoChart 1 Accessing AutoChart
1 Accessing AutoChart
AutoChart can be accessed from any computer with an internet connection using a web browser (for example, Internet Explorer, or Firefox).
Before you can access AutoChart, an AutoChart Administrator in your local ABB sales office (or your own organization) must create an account for you, linked to your email address. Before you can access your account, it must be activated – see Section 1.1 below. Once activated, you can log on normally (see Section 1.2, page 3) or reset a forgotten password (see Section 1.3, page 3).
1.1 Account Activation
To activate your account:
1. Go to www.abbautochart.net to access AutoChart's log on dialog:
2. Click the tab:
3. Enter your email address into the Email Address field and click to receive an email from AutoChart containing account activation instructions and a link.
4. On receipt of the email, click on the link (or copy and paste it into your browser address bar) to open the 'Reset Password' dialog:
5. Enter a password in into the 'New Password' field and click .
6. Click the tab:
7. Enter your email address and password and click to access your account.
Note. If an activation email was sent to you when the account was first created (see Section 5.3.1, page 12) start the following procedure at step 4.
Data Management Software
AutoChart 1 Accessing AutoChart
1.2 Logging On To log on to AutoChart:
1. Go to www.abbautochart.net to access AutoChart's log on dialog:
2. Enter your email address and password and click to access your account.
1.3 Forgotten Password
If you have forgotten your password, AutoChart can send you a secure link to enable you to reset it.
1. From the log on dialog, click the tab.
2. Enter your email address and click to enable AutoChart to send you an email containing instructions and a secure link to the 'Reset Password' dialog.
3. Clicking on the link in the email to access the 'Reset Password' dialog:
4. Enter a new password and click .
5. If your password change is successful, you can now log on to AutoChart – see Section 1.2.
Note. If you have forgotten your password, refer to
Section 1.3, following. Note. If you do not receive an email, first ensure that the email address you have entered is correct. If you still do not receive an email, contact your administrator.
Data Management Software
AutoChart 2 Navigation
2 Navigation
The toolbar at the top of the AutoChart home page and all other AutoChart pages provides the primary method for navigating AutoChart.
In addition to the toolbar, icons on the home page provide alternative links to the Chart page, Administration page (if accessible), account details and online help. The home page also displays latest system news (for example, details of updates or new features) and links to activated plug-ins. Referring to Fig. 2.1:
a Click to return to the home page.
b Click to open the Chart page – see Section 3.1, following.
c Click to open the Administration page – see Section 5.1, page 9.
d Current logged-in user.
e Displays the organization you are logged in to. If you have access to more than one organization, click on the dropdown arrow to select another from the organization tree:
f Click to your access your account details – see Section 4, page 8.
g Click to launch the online help.
h Click to log out of AutoChart.
3 Charting
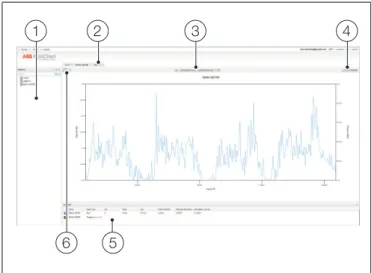
3.1 Chart Page Overview Referring to Fig. 3.1:
a Meters panel – see Section 3.2, page 5.
b Chart tabs.
Click on a tab to view the chart page for that meter or meter group.
c Date selector – see Section 3.3, page 6.
d Chart settings – see Section 3.4, page 6.
e Legend panel – see Section 3.5, page 7.
f Data view selector buttons – see Section 3.6, page 7.
The Meters and Legend panels are hidden by clicking the arrow buttons ( and ) located to the right of the panel titles. Hiding the panels expands the chart view. This is useful when presenting or working with a large set of data.
Fig. 2.1 AutoChart Home Page
4
5
8
3
1
2
6
7
Fig. 3.1 Chart Page Overview
5
1
2
3
4
Data Management Software
AutoChart 3 Charting
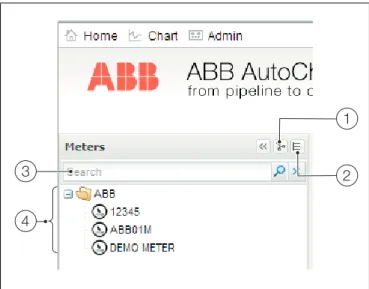
3.2 Meters Panel
The Meters panel lists all the meters and meter groups you can access.
Referring to Fig. 3.2:
a Tree View button
Click to display meters organized into a hierarchical tree arranged within meter sites. Meter sites often correspond to a geographical location or administrative group within an organization.
Initially, the tree displays only the first level of meters and meter sites. Click on the icon next to a meter or meter site name to expand the tree.
Meter sites are displayed in the order specified when created; meters within a meter site are displayed in alphabetical order.
b List View button
Click to display all meters in alphabetical order. Meter sites are not included in this view.
c Meter search box
To search for a meter or meters, enter all or part of the name of the meter and click .
Meters matching the search criteria are displayed in the meters panel in either tree or list view.
To clear a search, click .
d Meters and meter group list: – meter site
– meter – meter group
For the purposes of charting, meter groups are exactly the same as individual meters. Unless specified otherwise, all references to meters in this section includes meter groups.
To view data for a specific meter, click the meter in the meter panel to open a new Chart Tab in the charting window.
Double-click a meter in the meter panel or click the meter's Chart Tab to switch the current tab to that meter. Ctrl-click the meter in the meter panel to open more than one Chart Tab for the same meter.
To view multiple meters in the same tab, open a Chart Tab for the first meter and then Ctrl-click each additional meter to add it to the tab.
Fig. 3.2 Meters Panel
3
2
1
Data Management Software
AutoChart 3 Charting
3.3 Date Selector
The current date range is shown on the date selector.
The date navigation buttons ( and ) move the date range backwards or forwards by the currently selected interval. For example, If a week of data is selected (see below), click to move the start date back by 1 week.
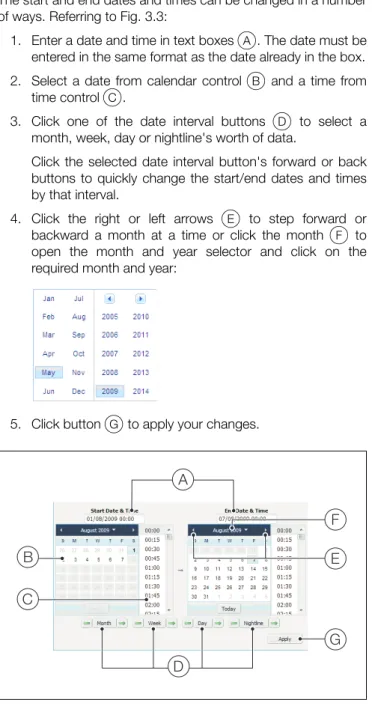
The date selector button changes the date range for the current chart tab. Clicking on the date selector button displays the date selector dialog – see Fig. 3.3. The start and end dates and times can be changed in a number of ways. Referring to Fig. 3.3:
1. Enter a date and time in text boxes A. The date must be entered in the same format as the date already in the box. 2. Select a date from calendar control B and a time from
time control C.
3. Click one of the date interval buttons D to select a month, week, day or nightline's worth of data.
Click the selected date interval button's forward or back buttons to quickly change the start/end dates and times by that interval.
4. Click the right or left arrows E to step forward or backward a month at a time or click the month F to open the month and year selector and click on the required month and year:
5. Click button G to apply your changes.
The date and time range can also be changed by clicking on the chart and dragging the shaded area to the left or right.
3.4 Chart Settings
The chart settings dialog enables you to change the source of the data (Section 3.4.1) the chart style (Section 3.4.2) and add annotations to the data.
3.4.1 Data Source
The data source tab (Fig. 3.4) enables you to change the data type, units of measurement and chart type for the current chart.
3.4.2 Chart Style
The chart style tab (Fig. 3.5) enables you to add grid lines to the chart.
Fig. 3.3 Date Selector Dialog
B
C
A
D
F
G
E
Fig. 3.4 Chart Settings – Data Source Tab
Data Management Software
AutoChart 3 Charting
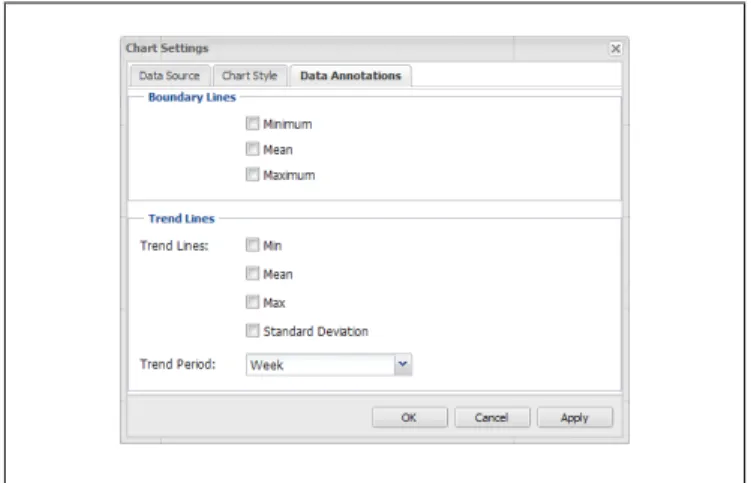
3.4.3 Data Annotation
The data annotations tab (Fig. 3.6) enables you to add boundary and trend lines to the chart.
Boundary Lines
Check the appropriate tickbox to overlay the chart with boundary lines showing the minimum, mean and maximum values for each data series.
Trend Lines
Check the appropriate tickbox to overlay the chart with trend lines that show how the boundaries of the data are changing over time.
You can trend data for periods of 1 day, 1 week or 1 month. Select the time period you want the trend to show from the Trend Period dropdown box:
3.5 Legend Panel
The legend panel (Fig. 3.7) displays the statistics for the current chart's data.
When the mouse pointer is positioned over a column header, the header changes color and a dropdown arrow is displayed. Click the dropdown arrow to display menu A to sort the column in ascending or descending order; or select 'Columns' to display menu B from where you can hide or unhide columns by selecting/deselecting the appropriate checkbox.
Each data series can have its color changed from the default color. Right-click in any row to display menu C. Select 'Choose colour' to display the color picker D and select a color for that data series.
Alternatively, you can change the data series color by right-clicking on the chart, choosing the data series from the menu and selecting a color – see Fig. 3.8.
3.6 Data View
You can choose to display the data from a meter in either Chart View format or Table View format.
Referring to Fig. 3.9, click the Chart View button A to display the data as a chart. Click the Table View button B to display the data in a table.
Fig. 3.6 Chart Settings – Data Annotation Tab
Note. To show a trend you must be viewing data for a longer period than the range selected.
Fig. 3.7 Legend Panel
Fig. 3.8 Selecting a Data Series Color
Fig. 3.9 Data View Selection
A
C
D
B
Data Management Software
AutoChart 4 Account Management
If the data is displayed in a table, minimum and maximum values for the data series are highlighted:
Minimum: Maximum:
3.7 Exporting Data
If data is displayed in Table Format (see Section 3.6, above), the button is displayed at the top of the table. Click this button to export the data as an Excel™ file. The standard Windows File Download dialog is displayed:
3.8 Printing
The chart image can be saved and printed by right-clicking on the chart and selecting 'Print' to open the Print dialog.
To get the best printing results, AutoChart saves the chart as a '.png' image file that can be opened in a graphics package for editing and printing.
Before saving the chart image, select a predefined image size from the dropdown menu or specify a custom size.
4 Account Management
Your account details are managed from the Account Details page:
You can amend your name and email address and also change the language AutoChart is displayed in.
By default, AutoChart uses the language your browser is configured to use (if available). If your local language is not available, AutoChart defaults to English (GB).
To change language, select a language from the dropdown list:
When all amendments have been made, click to save the changes. The confirmation message is displayed. 4.1 Changing Password
To change your password, click in the Account Details page to display the 'Change Password' dialog:
Enter your current password followed by your new password. Enter your new password again and click the button.
Note. Ensure your browser is configured to enable downloads from this site.
Data Management Software
AutoChart 5 Administration
5 Administration
5.1 Administration Page Overview Referring to Fig. 5.1:
A List panel – displays lists of:
– meters and meter groups (Meters tab selected) – Users (Users tab selected)
– Security Groups (Security Groups tab selected) – Organizations (Organisations tab selected).
B Administration tabs – click on a tab to view the page for each function
C Administration details panel.
5.2 Meter Administration
5.2.1 Amending Meter Names
Referring to Fig. 5.2:
1. Click the meter A to display its details in the administration details panel.
2. Enter the new name in meter name field B. 3. Click 'Save' button C.
AutoChart sends an instruction to the meter hardware requesting a name change. While waiting for the name change to be accepted by the meter, the meter's name in AutoChart is updated temporarily to the new name. If the meter hardware does not accept the new name for any reason (for example, rename instruction not received, Invalid characters used or name too long) the meter hardware sends an instruction to AutoChart to reset the name to match the current hardware name. If this occurs, repeat the above procedure, ensuring the new name is entered correctly.
Fig. 5.1 Administration Page Overview
A
B
C
Note. You cannot add meters to or delete them from AutoChart. Each meter is added automatically when it is manufactured or installed.
Note. You can change a meter's name only if you have the 'Rename Meters' security permission – see Section 5.3.4, page 14.
Fig. 5.2 Amending Meter Names
A
B
Data Management Software
AutoChart 5 Administration
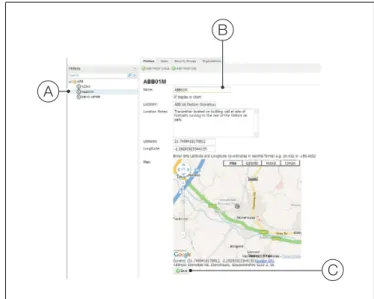
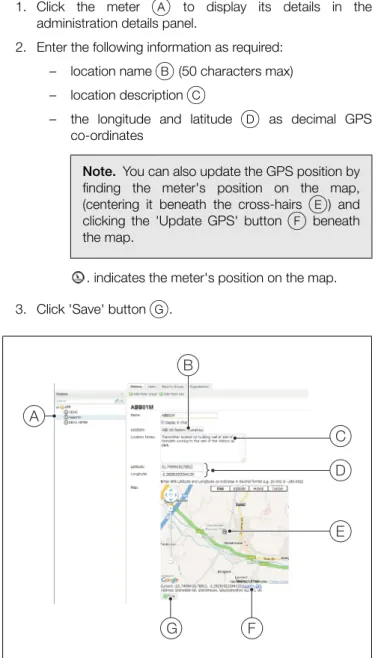
5.2.2 Amending Meter Locations
Referring to Fig. 5.3:
1. Click the meter A to display its details in the administration details panel.
2. Enter the following information as required: – location name B (50 characters max) – location description C
– the longitude and latitude D as decimal GPS co-ordinates
. indicates the meter's position on the map. 3. Click 'Save' button G.
5.2.3 Adding Meter Groups
Referring to Fig. 5.4:
1. Click 'Add Meter Group' button A.
2. Enter a name for the new group in text field B. 3. Click 'Create Group' button C.
The new group is displayed in the list panel marked with the icon.
5.2.4 Amending Meter Groups
You can amend a meter group by changing the group name and adding or removing meters.
Meter groups comprise meters in 'add' and 'subtract' meter lists. The output of meters in the 'add' list are added together for chart display purposes. The output from meters in the 'subtract' list is subtracted from the output of the meter(s) in the 'add' list for chart display purposes.
Referring to Fig. 5.5:
1. Click the meter group A to display its details in the administration details panel.
2. If required, enter a new name for the group in text field B and click 'Update Name' button C.
3. To add meters to the meter group, click on a meter in the list panel and drag it to either the 'Add meters' or 'Subtract meters' field D.
4. To remove a meter from either list, drag it into waste basket E.
Note. You can also update the GPS position by finding the meter's position on the map, (centering it beneath the cross-hairs E) and clicking the 'Update GPS' button F beneath the map.
Fig. 5.3 Amending Meter Locations
A
G
B
D
C
E
F
Note. You cannot delete a meter group once it has been created.
Fig. 5.4 Adding Meter Groups
Fig. 5.5 Amending Meter Groups
B
A
C
A
Data Management Software
AutoChart 5 Administration
5.2.5 Adding Meter Sites
You can create hierarchical trees of sites within sites to help you organize your meters.
Referring to Fig. 5.6:
1. Click 'Add Meter Site' button A.
2. Enter a name for the new site in text field B.
3. If required, select a 'parent' site for the new site from dropdown list C.
4. Click 'Save' button D.
The new site is displayed in the list panel and is indicated by the icon.
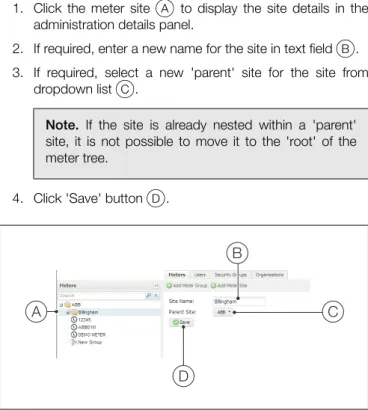
5.2.6 Amending Meter Sites
You can amend a meter site's name and/or assign it to a different 'parent' site.
Referring to Fig. 5.7:
1. Click the meter site A to display the site details in the administration details panel.
2. If required, enter a new name for the site in text field B. 3. If required, select a new 'parent' site for the site from
dropdown list C.
4. Click 'Save' button D.
Note. You cannot delete a meter site once it has been created.
Note. To create the new site at the 'root' of the meter tree or, if you don't yet have any meter sites, leave the 'parent' site selection blank.
Fig. 5.6 Adding Meter Sites
C
B
A
D
Note. If the site is already nested within a 'parent' site, it is not possible to move it to the 'root' of the meter tree.
Fig. 5.7 Amending Meter Sites
A
B
C
Data Management Software
AutoChart 5 Administration
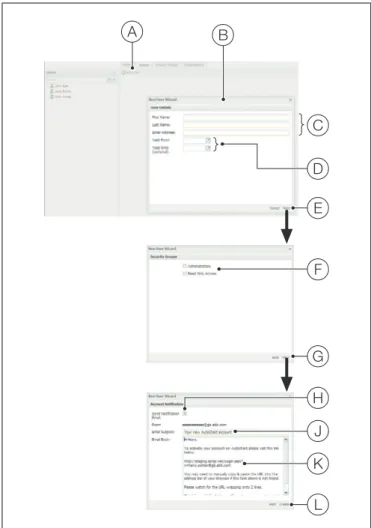
5.3 User Administration 5.3.1 Adding New Users
Referring to Fig. 5.8:
1. Click 'Add User' button A to open 'New User Wizard' dialog B.
2. Enter the user's first and last names and email address into text fields C.
3. Enter valid from and valid until (optional) dates into date fields D (or click and select a date from the calendar) and click 'Next' E.
4. Click a tickbox F to assign the user to a security group and click 'Next' G.
5. If required, click tickbox H to send the new user a notification email containing an account activation link.
6. Edit the email subject J and body text K as required.
7. Click 'Create' button L to add the new user and send the notification email (if selected at step 5).
Note. The user inherits the access privileges assigned to the group automatically (see Section 5.4, page 15), but access privileges can be added later if you are not sure at this stage to what group or groups the user should be assigned.
Note. This removes the need for the user to complete the first 3 steps of the Account activation process – see Section 1.1, page 2.
Note. Take care not to change the activation link as this prevents it from working correctly.
Fig. 5.8 Adding New Users
A
E
B
C
D
F
G
J
L
K
H
Data Management Software
AutoChart 5 Administration
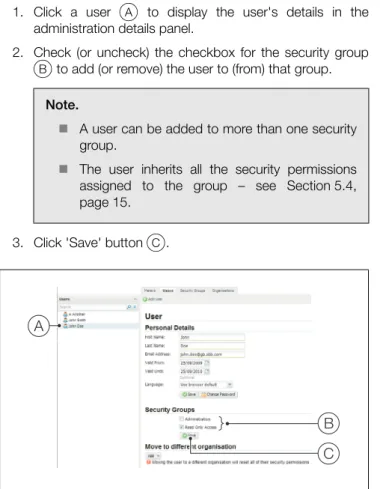
5.3.2 Amending User Details
Referring to Fig. 5.9:
1. Click a user A to display the user's details in the administration details panel.
2. Amend the user's details B as required.
3. Click 'Save' button C.
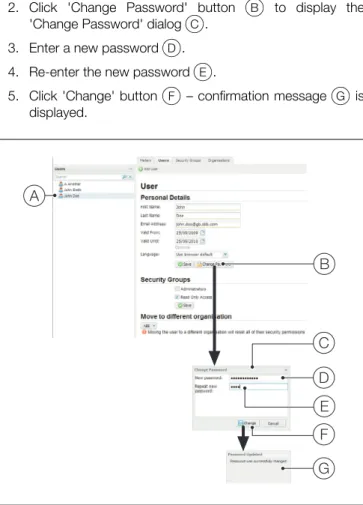
5.3.3 Amending User Passwords
Referring to Fig. 5.10:
1. Click a user A to display the user's details in the administration details panel.
2. Click 'Change Password' button B to display the 'Change Password' dialog C.
3. Enter a new password D. 4. Re-enter the new password E.
5. Click 'Change' button F – confirmation message G is displayed.
Note. Changing the user's email address requires them to use the new email address when logging on to AutoChart.
Fig. 5.9 Amending User Details
A
B
C
Fig. 5.10 Amending User Passwords
A
B
D
E
F
G
C
Data Management Software
AutoChart 5 Administration
5.3.4 Amending User Security Permissions
For more information about user security groups and user permissions, refer to Section 5.4, page 15.
Referring to Fig. 5.11:
1. Click a user A to display the user's details in the administration details panel.
2. Check (or uncheck) the checkbox for the security group
B to add (or remove) the user to (from) that group.
3. Click 'Save' button C.
5.3.5 Moving Users to Different Organizations
Referring to Fig. 5.12:
1. Click a user A to display the user's details in the administration details panel.
2. Click dropdown arrow B to display organization tree C. 3. Click on the organization D to move the user to.
Note.
A user can be added to more than one security group.
The user inherits all the security permissions assigned to the group – see Section 5.4, page 15.
Fig. 5.11 Amending User Security Permissions
A
B
C
Note. Moving a user removes that user from all security groups. To enable a user access to the new organization, add them to the required security group(s) – see Section 5.3.4, page 14.
Fig. 5.12 Moving Users to Different Organizations
A
B
C
D
Data Management Software
AutoChart 5 Administration
5.4 Security Groups
Access to AutoChart's features is controlled by security groups. Each security group is assigned a combination of access rights that include the ability to:
Access all or selected meters and meter groups
Rename meters
Edit meter location details
Create, edit and delete users
Create, edit and delete organizations
Edit the default chart settings for an organization
Users can be assigned to multiple security groups and it is the combination of groups that determine a user's access rights. For example, one security group could enable a user to rename meters only and another group could enable a user to create users only. By adding different users to a combination of these groups, you can organize administrative roles within an organization without having to manage each user's permissions individually.
5.4.1 Adding New Security Groups
Referring to Fig. 5.13:
1. Click 'Add Security Group' button A to open 'New Security Group' dialog B.
2. Enter a name for the group C.
3. Select whether this security group's permissions are to apply to 'child' organizations of the organization that a user (assigned to this group) belongs to D.
4. Click 'Create Group' button E to add the new security group.
5.4.2 Amending Security Group Details
Referring to Fig. 5.14:
1. Click a security group A to display the group's details in the administration details panel.
2. Change the group name B if required.
3. Select whether this security group's permissions are to apply to 'child' organizations of the organization that a user (assigned to this group) belongs to C.
4. Check or uncheck security permissions as required D.
5. Click 'Save' button E.
Fig. 5.13 Adding New Security Groups
A
B
D
C
E
Note. For further details of Meter Access permissions, refer to Section 5.4.3, page 16.
Fig. 5.14 Amending Security Group Details
A
B
D
E
C
Data Management Software
AutoChart 5 Administration
5.4.3 Amending Security Group Meter Access Permissions
The members of each security group can be enabled access either to all meters in the organization to which they belong (and, where set, all 'child' organizations) or to selected meters only.
Referring to Fig. 5.15:
1. Click a security group A to display the group's details in the administration details panel.
2. Select 'All Meters' B to enable access to all meters in an organization.
OR
Select 'Specific Meters Only' C to limit access to specific meters. Check the box next to the meter or meters to which access is to be enabled in the organization's meter tree D.
To enable access to all of the meters and meter groups within a meter site (including any meters that are added to the site after permission is granted), check the box next to the meter site.
3. Click 'Save' button E.
5.4.4 Amending Security Group Members
Referring to Fig. 5.16:
1. Click a security group A to display the group's details in the administration details panel.
2. Click 'Add and Remove Members' button B to display the 'Members' dialog C.
3. To add a member:
a. Click dropdown arrow D. b. Select new member from list E. c. Click 'Add Member' button F.
4. To remove a member, click 'Remove' button G next to member to be removed.
5. Click exit button H to close dialog.
Note. This enables you to add security permissions in advance of meters being added to AutoChart and ensures that access is available to the relevant users as soon as a new meter comes online.
Note. When access to a meter site is enabled, the site's 'child' meters are selected automatically and their checkboxes disabled.
Fig. 5.15 Amending Security Group Meter Access Permissions
A
C
B
D
E
Fig. 5.16 Amending Security Group Members
A
C
B
E
D
F
G
H
Data Management Software
AutoChart 5 Administration
5.5 Organizations
All actions within AutoChart take place in the context of an organization.
All meters, meter groups, users and security groups belong to an organization and it is from this 'owner' organization that they get their settings.
Organizations are used to split security access into logical groups, either within one large organization with many 'child' organizations or into separate groups that have no connection.
5.5.1 Adding New 'Child' Organizations
Referring to Fig. 5.17:
1. Click 'Add Organisation' button A. 2. Enter the new organization's name B.
3. Click dropdown arrow C and select an appropriate 'parent' organization from the organization tree.
4. Click 'Save' button D.
5.5.2 Amending Organization Details
Referring to Fig. 5.18:
1. Click an organization A to display its details in the administration details panel.
2. Amend the organization’s name B as required.
3. Click dropdown arrow C and select an appropriate 'parent' organization from the organization tree as required.
4. Click 'Save' button C.
5.6 Meter Ownership
Every meter in AutoChart is allocated to an organization. The 'owner' organization is responsible for access to the meter. However, the owner organization can, if required:
Grant another organization access to a meter – see Section 5.6.1, below
or
Transfer ownership of a meter to another organization – see Section 5.6.2, page 18.
5.6.1 Granting Access to Meters
Referring to Fig. 5.19:
1. Select the 'Meters' tab A. 2. Click 'Assign Meters' button B. 3. Select a meter C.
4. Select 'Grant Access' option D.
5. Select other permissions the organization are to have over the meter E as required.
6. If access is to be restricted to a limited time period, select 'Valid From' and 'Valid Until' dates F.
7. Select the organization G to grant access to. 8. Review selections H and click 'OK' button J.
Fig. 5.17 Adding New 'Child' Organizations
Fig. 5.18 Amending Organization Details
A
B
D
C
A
B
D
C
Note. Access to multiple meters may be granted at once. Shift-Click or Ctrl-Click meters to select more than one.
Fig. 5.19 Granting Access to Meters
A
B
G
H
J
C
D
E
F
Data Management Software
AutoChart 5 Administration
5.6.2 Transferring Meter Ownership
Referring to Fig. 5.20:
1. Select the 'Meters' tab A. 2. Click 'Assign Meters' button B. 3. Select a meter C.
4. Select 'Transfer Full Control' option D.
5. If required, check 'Display in Chart' checkbox E to have the meter appear immediately in the new owning organization's chart screen.
6. Select the new owner organization F.
7. Review selections G and click 'OK' button H.
Note. Multiple meters may be transferred at once. Shift-Click or Ctrl-Click meters to select more than one.
Note. The meter no longer appears in the list on the left hand side and you no longer control this meter.
Fig. 5.20 Transferring Meters
A
B
F
G
H
C
D
E
Data Management Software
AutoChart Appendix A – Glossary
Appendix A – Glossary
Meter Data gathering instrument that monitors the required properties of a pipeline (for example, flow or pressure) and reports them back to AutoChart; typically via an encrypted SMS message sent daily.
Meter Group A means of merging data from multiple meters into a single data source.
Meter Site A means of collecting meters, meter groups and other meter sites into a hierarchical organization of meters. This hierarchy enables easier organization of meters (for example into geographical areas), simplified reporting and negates the need for meters to be managed individually.
User A person with access to AutoChart (via a log on account).
Security Group
A container for collections of users that have shared security permissions. Security groups make functions of the site, including access to meters, available to all users within the group. Organization The top level entity within AutoChart. All meters,
meter sites, meter groups and users belong to organizations.
Context Menu
A context-sensitive menu that appears when you click the right-hand mouse button over certain elements of the user interface. Trend Lines Lines that can be added to a chart indicating
how the boundaries of the data are changing over time.
Gridlines Lines that can be added to a chart to make a data series easier to read.
Boundary Lines
Lines that can be added to a chart indicating the minimum, mean and maximum values for each data series.
Data Management Software AutoChart Index
Index
A Accessing AutoChart ...2 Account Activation ...2 Details ...8 Log on ...3 Management ...8 Password ...3, 8 Administrator ...2 C Chart page ...4Boundary and trend lines ...7
Chart settings ...4, 6 Data annotations ...7
Data series colors ...7
Data View Exporting data ...8
Min. and Max. values ...8
Data view ...7
Data view selector buttons ...4, 7 Date range ...6 Date selector ...4, 6 Legend panel ...4, 7 Hiding ...4 Meters panel ...4, 5 Hiding ...4 Printing ...8 H Home page ...4 L Language ...8 M Meters ... 5 Administration ... 9 Amending location of ... 10 Meter groups ... 5 Meter sites ... 5 Renaming ... 9 Searching for ... 5 O Online help ... 4 Organizations Adding ... 17 S Security groups Adding ... 15 Amending ... 15 T Toolbar ... 4 U Users Amending ... 13 Password ... 13
PRODUCTS & CUSTOMER SUPPORT
Products
Automation Systems • for the following industries:
– Chemical & Pharmaceutical – Food & Beverage
– Manufacturing – Metals and Minerals – Oil, Gas & Petrochemical – Pulp and Paper
Drives and Motors
• AC and DC Drives, AC and DC Machines, AC Motors to 1kV
• Drive Systems • Force Measurement • Servo Drives
Controllers & Recorders
• Single and Multi-loop Controllers • Circular Chart and Strip Chart Recorders • Paperless Recorders
• Process Indicators Flexible Automation
• Industrial Robots and Robot Systems Flow Measurement
• Electromagnetic Flowmeters • Mass Flowmeters
• Turbine Flowmeters • Wedge Flow Elements
Marine Systems & Turbochargers • Electrical Systems
• Marine Equipment
• Offshore Retrofit and Refurbishment Process Analytics
• Process Gas Analysis • Systems Integration Transmitters • Pressure • Temperature • Level • Interface Modules
Valves, Actuators and Positioners • Control Valves
• Actuators • Positioners
Water, Gas & Industrial Analytics Instrumentation • pH, Conductivity and Dissolved Oxygen Transmitters and
Sensors
• Ammonia, Nitrate, Phosphate, Silica, Sodium, Chloride, Fluoride, Dissolved Oxygen and Hydrazine Analyzers • Zirconia Oxygen Analyzers, Katharometers, Hydrogen
Purity and Purge-gas Monitors, Thermal Conductivity
Customer Support
We provide a comprehensive after sales service via a Worldwide Service Organization. Contact one of the following offices for details on your nearest Service and Repair Centre.
UK ABB Limited Tel: +44 (0)1453 826661 Fax: +44 (0)1453 829671 USA ABB Inc. Tel: +1 215 674 6000 Fax: +1 215 674 7183 Client Warranty
Prior to installation, the equipment referred to in this manual must be stored in a clean, dry environment, in accordance with the Company's published specification.
Periodic checks must be made on the equipment's condition. In the event of a failure under warranty, the following documentation must be provided as substantiation:
1. A listing evidencing process operation and alarm logs at time of failure.
IM/ACT–EN
Issu
e 1
ABB has Sales & Customer Support expertise in over 100 countries worldwide
www.abb.com
The Company’s policy is one of continuous product improvement and the right is reserved to modify the information contained herein without notice. Printed in UK (10.09) © ABB 2009
ABB Limited
Oldends Lane, Stonehouse Gloucestershire GL10 3TA UK Tel: +44 (0)1453 826661 Fax: +44 (0)1453 829671 ABB Inc.
125 E. County Line Road Warminster
PA 18974 USA
Tel: +1 215 674 6000 Fax: +1 215 674 7183
Internet Explorer and Excel are registered trademarks of Microsoft Corporation in the United States and/or other countries Firefox is a registered trademark of the Mozilla Foundation in the United States and/or other countries