Virtual discovery of melatonin receptor
ligands to modulate circadian rhythms
Reed M. Stein1,11, Hye Jin Kang2,11, John D. McCorvy2,9,11, Grant C. Glatfelter3,10,11, Anthony J. Jones3, Tao Che2, Samuel Slocum2, Xi-Ping Huang2, Olena Savych4,
Yurii S. Moroz5,6, Benjamin Stauch7,8, Linda C. Johansson7,8, Vadim Cherezov7,8, Terry Kenakin2, John J. Irwin1, Brian K. Shoichet1,12 ✉, Bryan L. Roth2,12 ✉ & Margarita L. Dubocovich3,12 ✉
The neuromodulator melatonin synchronizes circadian rhythms and related physiological functions through the actions of two G-protein-coupled receptors: MT1
and MT2. Circadian release of melatonin at night from the pineal gland activates
melatonin receptors in the suprachiasmatic nucleus of the hypothalamus,
synchronizing the physiology and behaviour of animals to the light–dark cycle1–4. The
two receptors are established drug targets for aligning circadian phase to this cycle in disorders of sleep5,6 and depression1–4,7–9. Despite their importance, few in vivo active
MT1-selective ligands have been reported2,8,10–12, hampering both the understanding of
circadian biology and the development of targeted therapeutics. Here we docked more than 150 million virtual molecules to an MT1 crystal structure, prioritizing
structural fit and chemical novelty. Of these compounds, 38 high-ranking molecules were synthesized and tested, revealing ligands with potencies ranging from
470 picomolar to 6 micromolar. Structure-based optimization led to two selective MT1 inverse agonists—which were topologically unrelated to previously explored
chemotypes—that acted as inverse agonists in a mouse model of circadian re-entrainment. Notably, we found that these MT1-selective inverse agonists advanced
the phase of the mouse circadian clock by 1.3–1.5 h when given at subjective dusk, an agonist-like effect that was eliminated in MT1- but not in MT2-knockout mice. This
study illustrates the opportunities for modulating melatonin receptor biology through MT1-selective ligands and for the discovery of previously undescribed, in vivo
active chemotypes from structure-based screens of diverse, ultralarge libraries.
The recent determination of the crystal structures of the MT1 and MT2 receptors13,14 afforded us the opportunity to seek previously unde-scribed chemotypes with new functions, including MT1-selective ligands, by computational docking of an ultralarge make-on-demand library15, seeking molecules that complemented the main ligand-bind-ing (orthosteric) site of the receptor. Given the similarity of the MT1 and MT2 sites—in which 20 out of 21 residues are identical—and the chal-lenges of docking for selectivity16, we sought to prioritize previously undescribed, high-ranking chemotypes from the docking screen that were unrelated to known melatonin receptor ligands and expected that these molecules interacted differentially with the two melatonin receptor types17–19.
We docked more than 150 million ‘lead-like’ molecules, characterized by favourable physical properties from ZINC (http://zinc15.docking. org)15,20. These largely make-on-demand molecules have not previously
been synthesized, but are usually accessible by two-component reac-tions. Use of complex building blocks in these reactions biases towards diverse, structurally interesting molecules15,20. Each library molecule was sampled in an average of more than 1.6 million poses (orientations × conformations) in the MT1 orthosteric site13 by DOCK3.721, generat-ing more than 72 trillion complexes for the library overall and scorgenerat-ing each pose for physical complementarity to the receptor site21. Seek-ing diversity, the top 300,000 scorSeek-ing molecules were clustered by topological similarity, resulting in 65,323 clusters, and those that were similar to known MT1 and MT2 ligands from ChEMBL2322 were eliminated (Methods, Fig. 1 and Extended Data Table 1).
The best-scoring molecules from each of the top 10,000 clusters were inspected for engagement with residues that recognize ligands in the MT1 crystal structure13,14 and for new polar partners in the MT1 site. In the docked complexes, these included hydrogen bonds with https://doi.org/10.1038/s41586-020-2027-0
Received: 3 August 2019 Accepted: 31 January 2020 Published online: 10 February 2020
1Department of Pharmaceutical Chemistry, University of California San Francisco, San Francisco, CA, USA. 2Department of Pharmacology, School of Medicine, University of North Carolina at
Chapel Hill, Chapel Hill, NC, USA. 3Department of Pharmacology and Toxicology, Jacobs School of Medicine and Biomedical Sciences, University at Buffalo (SUNY), The State University of New
York, Buffalo, NY, USA. 4Enamine Ltd, Kiev, Ukraine. 5National Taras Shevchenko University of Kyiv, Kiev, Ukraine. 6Chemspace, Monmouth Junction, NJ, USA. 7Bridge Institute, USC Michelson
Center for Convergent Biosciences, University of Southern California, Los Angeles, CA, USA. 8Department of Chemistry, University of Southern California, Los Angeles, CA, USA. 9Present
address: Department of Cell Biology, Neurobiology and Anatomy, Medical College of Wisconsin, Milwaukee, WI, USA. 10Present address: Designer Drug Research Unit, National Institute on
Drug Abuse Intramural Research Program, Baltimore, MD, USA. 11These authors contributed equally: Reed M. Stein, Hye Jin Kang, John D. McCorvy, Grant C. Glatfelter. 12These authors jointly
Discovery of chemotypes with distinct efficacies
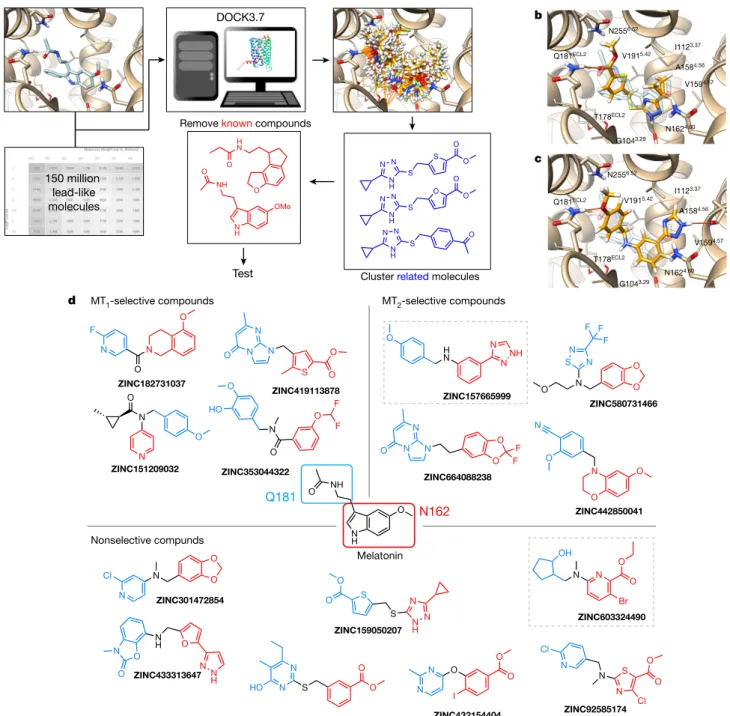
These active molecules included both agonists and inverse agonists, consistent with the emphasis on chemotype novelty (Fig. 1 and Extended Data Table 1). This novelty is supported quantitatively by their low topo-logical similarity to known melatonin receptor ligands24, and visually by comparison of the new ligands to their closest analogues among the known compounds (Extended Data Table 1). The different chemotypes often engaged the same residues that recognize 2-phenylmelatonin in the crystal structures. Examples include the hydrogen-bond interac-tions with N1624.60 made by the methoxy group of 2-phenylmelatonin that, in the docked models, were made by esters (ZINC92585174), pyridines (ZINC151209032) and benzodioxoles (ZINC301472854).
Test a b c 150 million lead-like molecules
Cluster related molecules
Q181ECL2 N1624.60 V1915.42 T178ECL2 V1594.57 I1123.37 G1043.29 N2556.52 N2556.52 T178ECL2 N1624.60 V1594.57 I1123.37 V1915.42 Q181ECL2 A1584.56 G1043.29 DOCK3.7 A1584.56
Remove known compounds
N162
MT2-selective compounds MT1-selective compounds
Nonselective compunds
Q181 d
O
H
N NNH
N O N N F F F N S O O O S S N H N N O O N O N N O N H O O N H N Br N OH N O O N N Cl O S N Cl O
HO N S O
O
N N O O
N I O N O O N Cl O HO N O F F O S O O N N N O O N N F O N N N O F O F O O N O O N O N H NH O Melatonin ZINC157665999 ZINC151209032 ZINC442850041 ZINC353044322 ZINC603324490 ZINC182731037 ZINC159050207 ZINC433313647 ZINC580731466 ZINC92585174 ZINC432154404 ZINC664088238 ZINC576887661 ZINC301472854 ZINC419113878 H N O
O S O
S N N N H O S N N N H O O O S N N N H O N H OMe NH O
Fig. 1 | Large library docking finds novel, potent melatonin receptor ligands. a, Docking for new melatonin receptor chemotypes from the make-on-demand library. b, Docked pose of ZINC159050207, an hMT1/hMT2 non-selective
agonist with low nanomolar activity. c, Docked pose of ZINC157665999, an MT2-selective inverse agonist. In b and c, the crystallographic geometry of
Q181ECL2, N1624.60, T178ECL2 and N2556.52, and hydrogen bonds with the backbone atoms of A1584.56, G1043.29 and F179ECL2. Conformationally strained molecules and those with unsatisfied hydrogen-bond donors were deprioritized23. Within the best-scoring clusters, all members were inspected and the one that best fitted these criteria was prioritized. Ultimately, 40 molecules with ranks ranging from 16 to 246,721, or the top 0.00001% to top 0.1% of the more than 150 million docked molecules, were selected for de novo synthesis and testing. Of the 38 molecules that were successfully synthesized (a 95% fulfilment rate), 15 had activity at either or both of the human MT1 and MT2 receptors in functional assays (Fig. 1 and Extended Data Table 1), a hit rate of 39% (calculated as the number of active compounds/number of physically tested compounds).
Similarly, whereas 2-phenylmelatonin stacks an indole with F179ECL2, the docked ligands stack benzoxazines (ZINC482850041), thiophenes (ZINC419113878) and furans (ZINC433313647). Whereas 2-phenylme-latonin forms hydrogen bonds with Q181ECL2 through its acetamide, the docked ligands use esters or pyridines (Fig. 1). The new ligands also dock to interact with new residues, including hydrogen bonds with T178ECL2, N2556.52, A1584.56, G1043.29 and F179ECL2 (Fig. 1b, c and Extended Data Fig. 3a–d).
Consistent with docking against an agonist-bound MT1 structure, four of the ligands were MT1-selective agonists (Extended Data Fig. 1a, b), with half-maximum effective concentration (EC50) values in the 2–6 μM range, and without detectable MT2 activity at concentrations of up to 30 μM: ZINC419113878, ZINC151209032, ZINC353044322 and ZINC182731037. Notably, ZINC159050207—although it was not selective between the receptor types—is a 1 nM MT1 agonist and is one of the most-potent molecules found directly from a docking screen25–30 (Fig. 1b, Extended Data Table 1 and Extended Data Fig. 1c, d). Admit-tedly, many ligands were just as active at the MT2 receptor or were even selective for it (Extended Data Table 1 and Extended Data Fig. 1). Thus, although the initial docking against the MT1 structure found new, potent chemotypes, and some of these were type-selective, they were just as likely to prefer the MT2 type as the MT1 type. This attests to both the strengths and weaknesses of chemotype novelty as a strategy for compound prioritization, and the need for further optimization.
We sought to improve 12 of these chemotype families, selecting ana-logues from the make-on-demand library. Several thousand such mol-ecules were docked into the MT1 site (see Methods and Extended Data Table 2). Of the 131 synthesized and tested, 94 analogues had activity at either or both the MT1 or MT2 melatonin receptors at concentrations of ≤10 μM (Extended Data Table 2, Extended Data Fig. 2 and Supple-mentary Table 1); of the 12 chemotype families, 5 showed improved potency. While this structure-based analogue-finding method could often find more-potent ligands, the efficacy, selectivity and bias of these compounds were sensitive to small structural changes (Extended Data Fig. 3).
We were particularly interested in type-selective ligands with in vivo efficacy, as these are unreported in the field. We investigated two MT1-selective inverse agonists, ZINC555417447 and ZINC157673384, and a selective MT2 agonist, ZINC128734226 (from here on referred to as
UCSF7447, UCSF3384 and UCSF4226, respectively), for their affinities
(Fig. 2 and Supplementary Data 3, 4), in vitro signalling, pharmacokinet-ics (Extended Data Table 3), selectivity to mouse as well as the human melatonin receptors (Fig. 2 and Supplementary Data 3, 4), and for their efficacies in mouse models of circadian behaviour (Fig. 3 and Extended Data Figs. 4, 5, 7). As expected, UCSF7447 and UCSF3384 competed for 2-[125I]iodomelatonin binding with higher affinity for the human MT1 receptors. Inhibition constant (Ki) values in the absence of GTP—304 nM and 938 nM for UCSF7447 and UCSF3384, respectively—were improved by uncoupling the G protein from the receptor by addition of GTP, with Ki values improving to 7.5 nM and 63 nM, respectively, support-ing their status as inverse agonists (Fig. 2a, b, Extended Data Fig. 6 and Supplementary Data 3). Both UCSF7447 and UCSF3384 increased the basal levels of cAMP—also as expected for inverse agonists—with EC50 values of 41 nM and 21 nM for human MT1, selectivity for human MT1 over human MT2 of 53- and 31-fold, and inverse-agonist efficacies of 62% and 47% to human MT1, respectively (Fig. 2c, d and Extended Data Fig. 6). The third molecule, UCSF4226 was an human MT2-selective agonist with an MT2 over MT1 selectivity of 54-fold in 2-[125I]iodomelatonin binding assays and a selectivity of 91-fold in bioluminescence resonance energy transfer (BRET) assays; in isoproterenol-stimulated cAMP inhibition assays, the agonist had an EC50 of 7.1 nM at human MT2, a value closely matched by an EC50 of 6.3 nM in BRET assays (Supplementary Data 4). After intravenous administration in mice, the three molecules were permeable in the central nervous system, with brain:plasma ratios ranging from 1.4 to 3.0. Plasma half-lives ranged from 0.27 to 0.32 h
(Extended Data Table 3), which is similar to melatonin2. Against mouse MT1 and MT2 receptors in vitro, the selectivity of the inverse agonists
UCSF7447 and UCSF3384 improved compared with the human
recep-tors and were, respectively, more than 158 and 100 times more selective
5 6 7 8 9 10 2-[ 125
I]Iodomelatonin binding (p Ki
)
2-[
125
I]Iodomelatonin binding (p Ki
)
hMT1
****
hMT2 mMT1 mMT2
**
* *
Receptor: GTP + Na+:
Receptor: GTP + Na+:
– + – + – + – + 5 6 7 8 9 10 *** *** ** **
hMT1 hMT2 mMT1 mMT2
– + – + – + – + 100 150 200 250 Isopr oter enol-stimulated
cAMP (% of basal)
Isopr
oter
enol-stimulated
cAMP (% of basal)
hMT1 hMT2
hMT1 hMT2
∞
log[UCSF7447 (M)]
(% of max.)
100 150 200 250
∞
log[UCSF3384 (M)]
(% of max.)
100 150 200 250
–11 –9 –7 –5 –11 –9 –7 –5
–11 –9 –7 –5 –11 –9 –7 –5
Isopr
oter
enol-stimulated
cAMP (% of basal)
Isopr
oter
enol-stimulated
cAMP (% of basal)
log[UCSF7447 (M)]
∞
100 150 200 250
log[UCSF3384 (M)] mMT1
mMT2 mMT1
mMT2
∞
(% of max.) 100
150 200
–11 –9 –7 –5 ∞
100 150 200
–11 –9 –7 –5 ∞
(% of max.)
a b c d e f 100 150 200
–11 –9 –7 –5 ∞ 100
150 200
–11 –9 –7 –5 ∞
Fig. 2 | Affinity, efficacy and potency of MT1-selective inverse agonists on
human and mouse MT1 and MT2 receptors. a, b, Affinity (pKi) of the inverse
agonists UCSF7447 (a) and UCSF3384 (b) compared with 2-[125I]iodomelatonin
for human MT1 (hMT1), human MT2 (hMT1), mouse MT1 (mMT1) and mouse MT2
(mMT2) receptors stably expressed in CHO cells. Competitive binding was
measured in the absence or presence of 100 μM GTP, 1 mM Na2EDTA and
150 mM NaCl. GTP uncouples G proteins from melatonin receptors, thus promoting the inactive conformations of the receptors46 and leading to a
higher affinity of the receptors for inverse agonists. Therefore, the lighter-coloured bars show higher binding affinities for the drugs compared with the paired darker-coloured bars. Connected symbols represent the pKi values of
individual determinations run in parallel. Ki values were derived from
competition binding curves (Supplementary Data 3). Bars represent the mean of five independent determinations. Statistical significance between pKi
averages was calculated by two-tailed paired Student’s t-test (t, d.f. and P values are described in the ‘Data analysis’ Methods section, and Supplementary Table 5). *P < 0.05; **P < 0.01; ***P < 0.001; ****P < 0.0001 compared with the corresponding pKi averages values derived in the absence of GTP. c–f,
Concentration–response curves of human and mouse MT1 and MT2 receptors
that were transiently expressed in HEK293T cells. Analysis of isoproterenol-stimulated cAMP production combined with UCSF7447 or UCSF3384 treatment. Data for UCSF7447 and UCSF3384 were normalized to the isoproterenol-stimulated basal activity. Insets, data normalized to the maximum effect of UCSF7447 or UCSF3384. c, Human MT1 and MT2 receptors
treated with UCSF7447. hMT1: pEC50 = 7.39 ± 0.10, Emax = −62 ± 13%, n = 8; hMT2:
pEC50 = 5.66 ± 0.10, Emax = −84 ± 9%, n = 8; hMT2/hMT1: EC50 = 53. d, Human MT1
and MT2 receptors treated with UCSF3384. hMT1: pEC50 = 7.68 ± 0.09, Emax = −47 ± 12%, n = 13; hMT2: pEC50 = 6.18 ± 0.04, Emax = −153 ± 14%, n = 12; hMT2/
hMT1: EC50 = 31. e, Mouse MT1 and MT2 receptors treated with UCSF7447. mMT1:
pEC50 = 7.20 ± 0.17, Emax = −56 ± 5%, n = 5; mMT2: pEC50, not determined, Emax, not
determined, n = 5; mMT2/mMT1: EC50 > 158. f, Mouse MT1 and MT2 receptors
treated with UCSF3384. mMT1: pEC50 = 7.00 ± 0.22, Emax = −49 ± 3%, n = 5; mMT2:
pEC50, not determined, Emax, not determined, n = 5; mMT2/mMT1: EC50 > 100.
for the mouse MT1 receptor compared with the mouse MT2 receptor at concentrations of up to 10μM for either compound (Fig. 2e, f and Supplementary Data 3). Conversely, whereas the agonist UCSF4226 lost little activity against the mouse receptor, its selectivity for the mouse MT2 receptor was much diminished (Supplementary Data 4). Accordingly, we moved forward to in vivo experiments in mice with the two selective MT1 inverse agonists.
In vivo pharmacology reveals new MT
1activities
We first examined the in vivo activity of the two MT1-selective inverse agonists in a mouse model of re-entrainment. In this ‘east-bound jet-lag’ model, mice were subjected to an abrupt 6-h advance in the light–dark cycle and treated at the new onset of the dark for three consecutive days to assess re-entrainment rate. At 30 μg per mouse, the agonist melatonin accelerates re-entrainment to the new cycle, consistent with its use in the treatment of east-bound jet-lag in humans (Fig. 3b and Extended Data Fig 4b). Conversely, the prototypical non-selective antagonist/inverse agonist luzindole (administered at 300 μg per mouse) decelerates re-entrainment, measured as the number of days to adapt to the new dark onset (Fig. 3b and Extended Data Fig 4e), as expected for an inverse agonist31–33. The selective MT1 inverse ago-nists UCSF7447 and UCSF3384, at a dose of 30 μg per mouse (about 1 mg kg−1), also decelerated re-entrainment (Fig. 3a, b and Extended Data Fig. 4c, d, l), phenocopying luzindole (encouragingly, at a tenfold lower dose).
Superficially, the shared effect of decelerating re-entrainment by
UCSF7447, UCSF3384 (Fig. 3a, b and Extended Data Fig. 4c, d, l) and
luzindole31,33 might seem expected, as all of the compounds share the same function as melatonin receptor antagonists/inverse agonists. However, luzindole is MT1/MT2 non-selective, in contrast to UCSF7447 and UCSF3384. The phenocopying by the compounds of luzindole suggests that deceleration of re-entrainment by all three molecules— slowing jet-lag accommodation—is mediated through the MT1 recep-tor alone. Supporting this, the effect of UCSF7447 was eliminated in MT1-knockout (MT1KO) mice (Fig. 3c and Extended Data Fig. 4h, i, m), but not in MT2-knockout (MT2KO) mice, in which its effect was actually increased, adding to the deceleration induced by deletion of the MT2 receptor alone (Fig. 3c and Extended Data Fig 4j, k, n).
The effect of the MT1-selective inverse agonists on the circadian phase was even more unexpected. Here, we measured their effects on circadian phase by monitoring the running wheel activity onset of free-running mice in constant darkness34–36 and administering the drugs to the mice at subjective dusk (circadian time 10, CT 10). Both inverse agonists induced a phase advance in the onset of the circadian wheel running rhythm, an effect that is characteristic of melatonin—the endogenous, non-selective agonist—and of non-selective agonist drugs such as ramelteon37 and agomelatine9,38 (Fig. 3d and Extended Data Fig. 5b–d, g, h). Whereas MT1-selective inverse agonists have few if any precedents in vivo, we would have ordinarily expected the opposite effect of the agonist39,40—that is, delaying rather than advancing the circadian phase. Instead, UCSF7447 advanced the onset of activity by approximately 1 h at 0.9 μg per mouse (about 0.03 mg kg−1), an effect similar to that of melatonin at its half-maximal effective dose (0.72 μg per mouse)34 (Fig. 3d and Extended Data Fig. 5g, h). At a higher dose (30 μg per mouse, about 1 mg kg−1), both UCSF7447 and UCSF3384 advanced the onset of running wheel activity with an amplitude simi-lar to melatonin34 at this circadian time (Fig. 3d and Extended Data Fig. 5b–d). Notably, whereas melatonin and ramelteon advance the phase when given at dusk (CT 10), and delay the phase when given at dawn (CT 2)35–37,41, UCSF7447 did not affect the circadian phase at dawn (Fig. 3f and Extended Data Fig 5r–w) and was only effective at dusk (Extended Data Fig. 7a–c).
The phenocopying effect of the non-selective agonist melatonin by the MT1-selective inverse agonists in shifting circadian phase motivated MLT VEH7447 3384LUZ
0 5 10 15
Number of days
** ** ** ** 0 5 10 15 20
Number of days
***P< 0.001 treatment ***P< 0.001 genotype ***
*
#
*
WT MT1KO MT2KO
b a c –2 –1 0
Phase delay (h)
NS
WT MT1KO MT2KO 0
1 2
Phase advance (h)
**
*** *P < 0.05 genotype × treatment
#
WT MT1KO MT2KO #
VEH MLT33847447 ************
f e d
VEH LUZ VEH MLT7447
0 1 2
Phase advance (h)
*** ***
1 3 5 7 9 11 13 15 17 0 2 4 6 8 Time (days) Hours per day VEH7447
***P < 0.001 treatment × time
* ***
*** ***
*
300 μg 30 μg
0.9 μg
Re-entrainment Phase shift
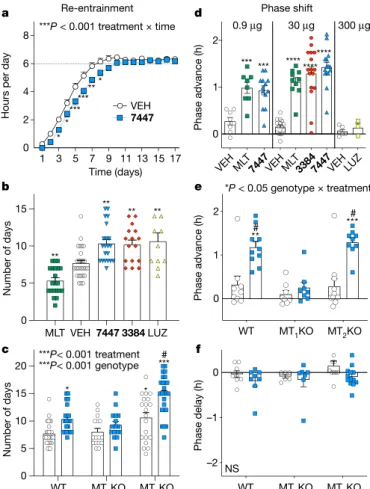
Fig. 3 | In vivo, MT1-selective inverse agonists decelerate re-entrainment rate
and induced a phase advance in circadian activity when administered at subjective dusk. a, b, In C3H/HeN wild-type (WT) mice, the inverse agonists UCSF3384 and UCSF7447 decelerate re-entrainment rate (a) and increase the number of days to re-entrainment after an advance of the dark onset by 6 h in the ‘eastbound jet-lag’ paradigm. a, Vehicle (VEH) versus UCSF7447 (7447; 30 μg per mouse); mixed-effect two-way repeated-measures analysis of variance (ANOVA) (treatment × time interaction: F16,735 = 3.39, P = 8.20 × 10⁻⁶). b,
Vehicle versus melatonin (MLT), UCSF3384 (3384; 30 μg per mouse), UCSF7447 (30 μg per mouse) or luzindole (LUZ; 300 μg per mouse); one-way ANOVA (F4,92 = 16.97, P = 1.86 × 10⁻¹⁰). c, The inverse agonist UCSF7447 targets MT1
receptors to increase the number of days to re-entrainment. Vehicle (white) versus UCSF7447 (blue; 30 μg per mouse); two-way ANOVA (treatment: F1,120 = 24.82, P = 2.14 × 10⁻⁶; genotype: F2,120 = 23.44, P = 2.55 × 10⁻⁹). d, The inverse
agonists UCSF3384 and UCSF7447 induce a phase advance in the onset of running wheel activity in constant dark at CT 10 (dusk), resembling the agonist melatonin. Left, vehicle versus melatonin or UCSF7447 (0.9 μg per mouse); one-way ANOVA (F2,26 = 13.60, P = 9.08 × 10⁻⁵). Centre, vehicle versus melatonin, UCSF3384 or UCSF7447 (30 μg per mouse); one-way ANOVA (F3,52 = 32.05, P = 7.15 × 10⁻¹²). Right, vehicle versus luzindole (300 μg per mouse); two-tailed
unpaired Student’s t-test (t = 0.92, d.f. = 7, P = 0.39). e, The phase advance of wheel activity onset by UCSF7447 is mediated by the MT1 receptor at CT 10
(dusk). Vehicle (white) versus UCSF7447 (blue; 30 μg per mouse); two-way ANOVA (treatment × genotype interaction: F2,49 = 4.46, P = 0.0166). f, The inverse
agonist UCSF7447, in contrast to melatonin, did not induce a phase delay in constant dark at CT 2 (dawn). Vehicle (white) versus UCSF7447 (blue; 30 μg per mouse); two-way ANOVA (treatment × genotype interaction: F2,49 = 0.384, P = 0.684). In f, one value is not shown due to scale, but is included in the analysis (value = 0.91 h). Data are mean ± s.e.m. NS, not significant. *P < 0.05, **P < 0.01, ***P < 0.001, ****P < 0.0001 compared with vehicle-treated wild-type mice. #P < 0.001; compared with vehicle-treated MT2KO mice. Post-test analyses were
us to investigate the mechanism of action and the role of off-target effects. Accordingly, both molecules, as well as the human MT2-selective agonist UCSF4226, were tested against a panel of common off-target receptors (Supplementary Data 1). In radioligand competition assays, no activity was seen up to a concentration of 10 μM for the new ligands. Against a panel of 318 G-protein-coupled receptors (GPCRs), activity was observed for only seven receptors when screened at a single con-centration, activity against none of these seven receptors was replicated in full concentration–response assays (Supplementary Data 2).
Consistent with activity mediated by the MT1 receptor, the advance in the onset of running wheel activity at dusk (CT 10) by UCSF7447 was eliminated in MT1KO mice but not in MT2KO mice (Fig. 3e and Extended Data Fig. 5l–q). These observations suggest that the MT1-selective inverse agonists UCSF7447 and UCSF3384 are not only potent, with effects on phase shift for UCSF7447 at 0.9 μg per mouse (about 0.03 mg kg−1) (Fig. 3d) and efficacies that resemble the long-established reagent luzindole in the jet-lag model at tenfold lower doses, but also that their unexpected activity in the circadian phase paradigm is medi-ated by the MT1 receptor. We note that the lack of precedence for this behaviour reflects a lack of MT1-selective inverse agonists to investigate this effect, something that is addressed by this study.
Discussion
We discovered, in a large library docking screen, multiple, previously undescribed chemotypes for melatonin receptors (Fig. 1) that have new signalling mechanisms and pharmacology. Three features of this study are worth emphasizing. First, docking a library of more than 150 million diverse, make-on-demand molecules found ligands that are topologically unrelated to known melatonin receptor ligands, with picomolar and nanomolar activity on the melatonin receptors. Second, the chemical novelty of these molecules translated functionally, confer-ring melatonin-receptor-type selectivity. Whereas the deceleration of re-entrainment (jet-lag model) by these inverse agonists resembled that of the classic non-selective antagonist/inverse agonist luzindole, their high selectivity for the MT1 receptor, and the chemical–genetic epistasis in the MT1KO mouse, convincingly implicates the MT1 receptor in this response. Unexpectedly, the inverse agonists conferred an agonist-like effect in circadian phase-shift experiments when administered at dusk, perhaps suggesting previously unknown signalling control for the MT1 receptor in the suprachiasmatic nucleus of the hypothalamus, which has known time-of-day-dependent receptor-mediated signalling pathways42. Third, these are, to our knowledge, the first MT1-selective inverse agonists that are active in vivo, with efficacy at doses as low as 0.9 μg per mouse in the circadian phase shift paradigm. Their efficacy in modulating time-dependent circadian entrainment supports their potential as lead molecules for the design of therapeutics for conditions and diseases that are affected by alterations in the circadian phase5–7,43. Certain caveats should be noted. Although we sought MT1-selective ligands, we found ligands for both melatonin receptor types, reflecting their conserved orthosteric sites. Indeed, rather than adopting a struc-ture-based strategy for type selectivity, we simply focused on chemical novelty among the high-ranking docked molecules15,17. Although the 39% docking hit rate was high, and the hits were potent, this probably reflects a site that is unusually well-suited to ligand binding: it is small, solvent-occluded and largely hydrophobic. These high hit rates and potencies may not always translate to other targets44,45.
The key observations of this work should nevertheless be clear. From a structure-based screen of a diverse, 150 million compound virtual library sprang 15 new chemical scaffolds, topologically unrelated to known melatonin receptor ligands, synthesized de novo for this project. From their chemical novelty emerged previously undescribed activi-ties, including inverse agonists and ligands with melatonin-receptor-type selectivity. The potency, brain exposure and selectivity of these ligands enable the disentanglement of the physiological role of the
MT1 receptor. Accordingly, we are making the MT1-selective inverse agonist UCSF7447, and the human MT2 selective agonist UCSF4226, openly available to the community as probe pairs together with a close analogue that has no measurable activity on the melatonin receptors (Extended Data Table 4). We note that only a small fraction of even the highest-ranking chemotypes from the docking screen were tested here; it is likely that hundreds-of-thousands of melatonin receptor ligands, representing tens-of-thousands of new chemotypes15, remain to be discovered from the make-on-demand library, which continues to grow (http://zinc15.docking.org). This study suggests that not only potent ligands may be revealed by docking such a library, but also that the new chemotypes explored can illuminate new in vivo pharmacology.
Online content
Any methods, additional references, Nature Research reporting sum-maries, source data, extended data, supplementary information, acknowledgements, peer review information; details of author con-tributions and competing interests; and statements of data and code availability are available at https://doi.org/10.1038/s41586-020-2027-0.
1. Zisapel, N. New perspectives on the role of melatonin in human sleep, circadian rhythms and their regulation. Br. J. Pharmacol. 175, 3190–3199 (2018).
2. Dubocovich, M. L. et al. International Union of Basic and Clinical Pharmacology. LXXV. Nomenclature, classification, and pharmacology of G protein-coupled melatonin receptors. Pharmacol. Rev. 62, 343–380 (2010).
3. Liu, J. et al. MT1 and MT2 melatonin receptors: a therapeutic perspective. Annu. Rev. Pharmacol. Toxicol. 56, 361–383 (2016).
4. Dubocovich, M. L. Melatonin receptors: role on sleep and circadian rhythm regulation. Sleep Med. 8, 34–42 (2007).
5. Mundey, K., Benloucif, S., Harsanyi, K., Dubocovich, M. L. & Zee, P. C. Phase-dependent treatment of delayed sleep phase syndrome with melatonin. Sleep 28, 1271–1278 (2005). 6. Rajaratnam, S. M. et al. Melatonin agonist tasimelteon (VEC-162) for transient insomnia
after sleep-time shift: two randomised controlled multicentre trials. Lancet 373, 482–491 (2009).
7. Lewy, A. J. et al. The phase shift hypothesis for the circadian component of winter depression. Dialogues Clin. Neurosci. 9, 291–300 (2007).
8. Jockers, R. et al. Update on melatonin receptors: IUPHAR Review 20. Br. J. Pharmacol. 173, 2702–2725 (2016).
9. de Bodinat, C. et al. Agomelatine, the first melatonergic antidepressant: discovery, characterization and development. Nat. Rev. Drug Discov. 9, 628–642 (2010). 10. Descamps-François, C. et al. Design and synthesis of naphthalenic dimers as selective
MT1 melatoninergic ligands. J. Med. Chem. 46, 1127–1129 (2003).
11. Spadoni, G. et al. Bivalent ligand approach on N-2-[(3-methoxyphenyl)methylamino] ethylacetamide: synthesis, binding affinity and intrinsic activity for MT1 and MT2 melatonin
receptors. Bioorg. Med. Chem. 19, 4910–4916 (2011).
12. Zlotos, D. P., Riad, N. M., Osman, M. B., Dodda, B. R. & Witt-Enderby, P. A. Novel difluoroacetamide analogues of agomelatine and melatonin: probing the melatonin receptors for MT1 selectivity. MedChemComm 6, 1340–1344 (2015).
13. Stauch, B. et al. Structural basis of ligand recognition at the human MT1 melatonin
receptor. Nature 569, 284–288 (2019).
14. Johansson, L. C. et al. XFEL structures of the human MT2 melatonin receptor reveal the
basis of subtype selectivity. Nature 569, 289–292 (2019).
15. Lyu, J. et al. Ultra-large library docking for discovering new chemotypes. Nature 566, 224–229 (2019).
16. Weiss, D. R. et al. Selectivity challenges in docking screens for GPCR targets and antitargets. J. Med. Chem. 61, 6830–6845 (2018).
17. Manglik, A. et al. Structure-based discovery of opioid analgesics with reduced side effects. Nature 537, 185–190 (2016).
18. Huang, X. P. et al. Allosteric ligands for the pharmacologically dark receptors GPR68 and GPR65. Nature 527, 477–483 (2015).
19. Lansu, K. et al. In silico design of novel probes for the atypical opioid receptor MRGPRX2. Nat. Chem. Biol. 13, 529–536 (2017).
20. Sterling, T. & Irwin, J. J. ZINC 15—ligand discovery for everyone. J. Chem. Inf. Model. 55, 2324–2337 (2015).
21. Coleman, R. G., Carchia, M., Sterling, T., Irwin, J. J. & Shoichet, B. K. Ligand pose and orientational sampling in molecular docking. PLoS ONE 8, e75992 (2013). 22. Bento, A. P. et al. The ChEMBL bioactivity database: an update. Nucleic Acids Res. 42,
D1083–D1090 (2014).
23. Irwin, J. J. & Shoichet, B. K. Docking screens for novel ligands conferring new biology. J. Med. Chem. 59, 4103–4120 (2016).
24. Muchmore, S. W. et al. Application of belief theory to similarity data fusion for use in analog searching and lead hopping. J. Chem. Inf. Model. 48, 941–948 (2008). 25. Katritch, V. et al. Structure-based discovery of novel chemotypes for adenosine A2A
receptor antagonists. J. Med. Chem. 53, 1799–1809 (2010).
26. de Graaf, C. et al. Crystal structure-based virtual screening for fragment-like ligands of the human histamine H1 receptor. J. Med. Chem. 54, 8195–8206 (2011).
27. Männel, B. et al. Structure-guided screening for functionally selective D2 dopamine
28. Kiss, R. et al. Discovery of novel human histamine H4 receptor ligands by large-scale structure-based virtual screening. J. Med. Chem. 51, 3145–3153 (2008).
29. Congreve, M. et al. Discovery of 1,2,4-triazine derivatives as adenosine A2A antagonists
using structure based drug design. J. Med. Chem. 55, 1898–1903 (2012).
30. Langmead, C. J. et al. Identification of novel adenosine A2A receptor antagonists by virtual
screening. J. Med. Chem. 55, 1904–1909 (2012).
31. Adamah-Biassi, E. B., Stepien, I., Hudson, R. L. & Dubocovich, M. L. Effects of the melatonin receptor antagonist (MT2)/inverse agonist (MT1) luzindole on re-entrainment of wheel running activity and spontaneous homecage behaviors in C3H/HeN Mice. FASEB J. 26, 1042.5 (2012).
32. Dubocovich, M. L. Luzindole (N-0774): a novel melatonin receptor antagonist. J. Pharmacol. Exp. Ther. 246, 902–910 (1988).
33. Browning, C., Beresford, I., Fraser, N. & Giles, H. Pharmacological characterization of human recombinant melatonin mt1 and MT2 receptors. Br. J. Pharmacol. 129, 877–886
(2000).
34. Dubocovich, M. L., Yun, K., Al-Ghoul, W. M., Benloucif, S. & Masana, M. I. Selective MT2
melatonin receptor antagonists block melatonin-mediated phase advances of circadian rhythms. FASEB J. 12, 1211–1220 (1998).
35. Benloucif, S. & Dubocovich, M. L. Melatonin and light induce phase shifts of circadian activity rhythms in the C3H/HeN mouse. J. Biol. Rhythms 11, 113–125 (1996).
36. Burgess, H. J., Revell, V. L., Molina, T. A. & Eastman, C. I. Human phase response curves to three days of daily melatonin: 0.5 mg versus 3.0 mg. J. Clin. Endocrinol. Metab. 95, 3325–3331 (2010).
37. Rawashdeh, O., Hudson, R. L., Stepien, I. & Dubocovich, M. L. Circadian periods of sensitivity for ramelteon on the onset of running-wheel activity and the peak of suprachiasmatic nucleus neuronal firing rhythms in C3H/HeN mice. Chronobiol. Int. 28, 31–38 (2011).
38. Van Reeth, O. et al. Comparative effects of a melatonin agonist on the circadian system in mice and Syrian hamsters. Brain Res. 762, 185–194 (1997).
39. Erşahin, C., Masana, M. I. & Dubocovich, M. L. Constitutively active melatonin MT1
receptors in male rat caudal arteries. Eur. J. Pharmacol. 439, 171–172 (2002). 40. Soares, J. M. Jr, Masana, M. I., Erşahin, C. & Dubocovich, M. L. Functional melatonin
receptors in rat ovaries at various stages of the estrous cycle. J. Pharmacol. Exp. Ther. 306, 694–702 (2003).
41. Lewy, A. J. et al. The human phase response curve (PRC) to melatonin is about 12 hours out of phase with the PRC to light. Chronobiol. Int. 15, 71–83 (1998).
42. Gillette, M. U. & Mitchell, J. W. Signaling in the suprachiasmatic nucleus: selectively responsive and integrative. Cell Tissue Res. 309, 99–107 (2002)
43. Reid, K. J. et al. Familial advanced sleep phase syndrome. Arch. Neurol. 58, 1089–1094 (2001).
44. Kufareva, I., Gustavsson, M., Zheng, Y., Stephens, B. S. & Handel, T. M. What do structures tell us about chemokine receptor function and antagonism? Annu. Rev. Biophys. 46, 175–198 (2017).
45. Cooke, R. M., Brown, A. J., Marshall, F. H. & Mason, J. S. Structures of G protein-coupled receptors reveal new opportunities for drug discovery. Drug Discov. Today 20, 1355–1364 (2015).
46. Lefkowitz, R. J., Mullikin, D. & Caron, M. G. Regulation of β-adrenergic receptors by guanyl-5′-yl imidodiphosphate and other purine nucleotides. J. Biol. Chem. 251, 4686–4692 (1976).
Publisher’s note Springer Nature remains neutral with regard to jurisdictional claims in published maps and institutional affiliations.
Methods
Molecular dockingThe MT1 receptor with nine thermostabilizing point mutations, as determined crystallographically13, was used in the docking calcula-tions. To prepare the structure for docking, atoms of the co-crystallized ligand, 2-phenylmelatonin, were used to seed the matching sphere calculation in the orthosteric site; these spheres represent favourable positions for individual ligand atoms to dock; 45 spheres were used in total. DOCK3.7 orients flexibases of pre-calculated ligand confor-mations into the orthosteric site by overlaying atoms of each library molecule onto these matching spheres. The receptor structure was protonated by REDUCE47 and assigned AMBER united atom charges48. For residues N1624.60 and Q181ECL2, the partial atomic charges of the side chain amide were increased without changing the net charge of the residue, as described previously49. The volume of the low protein dielectric, which defines the boundary between solute and solvent in Poisson–Boltzmann electrostatic calculations, was extended out 1.9 Å from the protein surface using spheres calculated by SPHGEN. Scoring grids were pre-calculated using CHEMGRID for AMBER van der Waals potential, QNIFFT50 for Poisson–Boltzmann-based electrostatic potentials, and SOLVMAP51 for ligand desolvation.
The resulting potential grids and ligand-matching parameters were evaluated for their ability to enrich known MT1 ligands over property-matched decoys. Decoys share the same physical properties as known ligands but are topologically dissimilar and are therefore unlikely to bind to the receptors. We extracted 31 known MT1 melatonin receptor ligands—both agonists and antagonists—from the IUPHAR database52 and 1,550 property-matched decoys were generated using the DUD-E pipeline. Docking success was judged based on the ability to enrich the known ligands over the decoys by docking rank, using adjusted logAUC values, as is widely done in the field. We also ensured that molecules with extreme physical properties were not enriched, as can happen when only counter-screening against property-matched decoys. In particular, we wanted to ensure that neutral molecules were enriched over charged ones. The docking parameters were also judged on how well they reproduced the expected binding modes of the known ligands as well as their ability to form hydrogen bonds with N1624.60 and Q181ECL2. The ‘lead-like’ subset of ZINC15 (http://zinc15.docking.org), charac-terized by favourable physical properties (for example, with calculated octanol-water partition coefficients (cLopP) ≤ 3.5 and with molecular mass ≤ 350 Da), was then docked against the MT1 orthosteric site21, using DOCK3.7. This library contained more than 150 million molecules, most of which were make-on-demand compounds from the Enamine REAL set15. Of these, more than 135 million molecules successfully docked, with more than 36 million receiving a favourable score (<0 kcal mol−1). An average of 3,445 orientations was calculated for each, and for each orientation, an average of 485 conformations was sampled. A simplex minimizer was used for rigid-body minimization on the best-scored pose for each ligand. Overall, about 72 trillion complexes were sam-pled and scored. The calculation time was 45,020 core hours, or 1.25 calendar days on 1,500 cores.
To reduce the redundancy of the best-ranking docked molecules, the top 300,000 ranked molecules were clustered by ECFP4-based Tanimoto coefficient (Tc) of 0.5, and the best-scoring member was used to represent the cluster. The resulting 65,323 clusters were filtered for novelty by calculating the ECFP4-based Tanimoto coefficient against >1,100 MT1 and MT2 receptor ligands from the CHEMBL2322 database. Molecules with Tanimoto coefficients of ≥0.38 to known MT1/MT2 ligands were not further pursued.
After filtering for novelty, the docked poses of the best-scoring members of each cluster were filtered by the proximity of their polar moieties to N1624.60 or Q181ECL2, and manually inspected for favourable geometry and interactions. Of the best-scoring molecules prioritized in this way, all members of its cluster within the top 300,000 molecules
were also inspected, and sometimes one of these was chosen if they exhibited more favourable poses or chemical properties. Finally, 40 compounds were chosen for testing, 38 of which were success-fully synthesized. To our knowledge, none of these compounds has been previously available and we are unaware of reports of them being previously synthesized.
Make-on-demand synthesis
Compounds were synthesized using 72,000 qualified in stock build-ing blocks and 130 well-characterized, two-component reactions at Enamine. Previously, molecules have been synthesized in 3–4 weeks with an 85% fulfilment rate; in this project the delivery time was 6 weeks, but with a 95% fulfilment rate for the 40 molecules that were prioritized from the initial docking screen. Each reaction is tested for conditions including temperatures, completion time and mixing53. Typically, compounds were made in parallel by combining reagents and solvents in a single vial in the appropriate conditions to allow the reaction to proceed to completion. The product-containing vial is filtered by centrifugation into a second vial to remove the precipitate and the solvent is evaporated under reduced pressure; the product is then purified by high-performance liquid chromatography. Identity and purity are assessed by liquid chromatography–mass spectrometry (LC–MS) and, as appropriate, 1H NMR (Supplementary Table 2, Sup-plementary Data 7). All compounds were shipped with a purity of 90% or better, and the three main compounds UCSF7447, UCSF3384 and
UCSF4226 were independently confirmed to be ≥95% pure by LC–MS
in secondary confirmation analyses at a second laboratory (Supple-mentary Data 5). Details regarding the synthesis and analyses of the compounds are provided in Supplementary Data 6, 7.
Structure-based ligand optimization
After experimental testing (see ‘cAMP assay’), 12 of the 15 active ligands from docking were prioritized for optimization, representing a range of activities and type selectivity (Extended Data Table 2 and Supple-mentary Table 1). Several thousand analogues of these ligands—each bearing the same scaffold as the parent molecule and with a Tanimoto coefficient of <0.38 to annotated melatonin receptor ligands—were selected from the ZINC database and docked to the MT1 binding site, again using DOCK3.7. The resulting docked poses were manually evalu-ated for interactions with N1624.60 or Q181ECL2, and 132 analogues were selected for de novo synthesis at Enamine, in two iterations. Of these, 131 were successfully synthesized, a >99% fulfilment rate.
Cell culture
HEK293T cells were maintained with complete Dulbecco’s modified Eagle’s medium (DMEM), supplemented with 10% fetal bovine serum (FBS), 2 mM l-glutamine, 100 U ml−1 penicillin G and 100 μg ml−1 strep-tomycin. Cells were maintained at 37 °C in the presence of 5% CO2.
Tango arrestin recruitment assay
cAMP assay
MT1 and MT2 receptors were tested using split luciferase-based GloSen-sor cAMP biosenGloSen-sor technology (Promega). HEK293T cells were plated in 15-cm cell-culture dishes (at around 50% cell confluency) with DMEM supplemented with 10% dialysed FBS, 2 mM l-glutamine, 100 U ml−1 penicillin G and 100 μg ml−1 streptomycin for 4–6 h. Then, cells were co-transfected with 8 μg of constructs encoding either MT1 or MT2 (de-Tango-ized constructs) and 8 μg of Glosensor DNA. The next day, transfected cells were seeded into poly-l-lysine-coated 384-well white clear-bottom cell-culture plates with complete DMEM supplemented with 1% dialysed FBS at a density of 20,000 cells per well for another 24 h. The subsequent day, cell medium was discarded and wells were loaded with 20 μl of assay buffer (1× HBSS, 20 mM HEPES, pH 7.4, 0.1% BSA). To measure agonist activity of MT1 or MT2 receptor, 10 μl of test compound solution at 3× final concentration was added for 15 min followed by addition of 10 μl of luciferin/isoproterenol mixture (at a final concentration of 4 mM and 200 nM, respectively) for another 15 min for luminescence quantification. Then, plates were counted using a SpectraMax luminescence reader (Molecular Device). Data were analysed using GraphPad Prism 8.
Calculation of log(Emax/EC50) and quantification of ligand bias
The Δlog(Emax/EC50) was calculated with melatonin as a reference ago-nist for G protein and β-arrestin pathway, and the ΔΔlog(Emax/EC50) was calculated between two pathways for each ligand55, as were
correspond-ing bias plots56. The bias factor is unitless and defined as 10ΔΔ log(Emax/EC )50 .
GPCRome counterscreen
Screening of compounds in the PRESTO-Tango GPCRome was accom-plished as previously described54 with several modifications. First, HTLA cells were plated in DMEM with 10% FBS and 10 U ml−1 penicil-lin–streptomycin. Next, the cells were transfected using an in-plate PEI method57. PRESTO-Tango receptor DNAs were resuspended in OptiMEM and hybridized with PEI before dilution and distribution into 384-well plates and subsequent addition to cells. After overnight incubation, drugs were added to cells without replacement of the medium. The remaining steps of the PRESTO-Tango protocol were followed as previ-ously described. For those six receptors for which activity was reduced to less than 0.5-fold of basal levels of relative luminescence units or for the one receptor for which basal signalling was increased greater than threefold of basal levels, assays were repeated as a full dose–response assay. Activity for none of the seven could be confirmed, and we dis-count the apparent activity seen in the single-point assay.
Inhibition screen
Binding assays were performed by the NIMH Psychoactive Drug Screen-ing program as described previously58. Detailed binding assay pro-tocols are available at: https://pdspdb.unc.edu/pdspWeb/content/ UNC-CH%20Protocol%20Book.pdf.
BRET recruitment assay
To measure the dissociation of labelled Gαi3 from the labelled Gβγ com-plex after the receptor stimulation, HEK293T cells were co-transfected in a 1:1:1:1 ratio of Gαi3-RLuc, Gβ3, GFP2-Gγ9, and human MT1or MT2 (de-Tango-ized constructs), respectively. After 24 h, transfected cells were plated in poly-l-lysine-coated 96-well white clear-bottom cell-culture plates with DMEM containing 1% dialysed FBS, 100 U ml−1 penicil-lin G and 100 μg ml−1 streptomycin at a density of 40,000 cells in 200 μl per well and incubated overnight. The following day, the medium was removed and cells were washed once with 100 μl of assay buffer (1× HBSS, 20 mM HEPES, pH 7.4, 0.1% BSA). Then 60 μl of assay buffer was loaded per well followed by addition of 10 μl of the RLuc substrate,
coelenterazine 400a (Nanolight), at 5 μM final concentration for 5 min. Drug stimulation was performed with the addition of 30 μl of 3× drug dilution of melatonin or UCSF4226 in assay buffer supplemented with 0.01% (w/v) ascorbic acid per well and incubated at room temperature for another 5 min. Both luminescence (400 nm) and fluorescent GFP2 emission (515 nm) were read for the plate for 1 s per well using Mithras LB940. The ratio of GFP2/RLuc was calculated per well and analysed using ‘log (agonist) vs. response’ in GraphPad Prism 8.
Radioligand binding
Reagents and ligands. 2-[125I]Iodomelatonin (SA: 2,200 Ci, 81.4 TBq mmol−1) was purchased from Perkin Elmer. Guanosine 5′-triphosphate sodium salt hydrate (GTP), melatonin and all other chemicals and reagents were obtained from Sigma-Aldrich.
Compound preparation. For receptor binding studies, UCSF7447 was dissolved in 50% DMSO/50% ethanol as a 13 mM stock solution, diluted 1/10 in 100% ethanol then 1/10 again in 50% ethanol/50% Tris-HCl buffer, pH 7.4 25 °C. Both UCSF3384 and UCSF4226 were dissolved in 100% ethanol as 13 mM stock solutions and then diluted 1/10 in 50% ethanol/50% Tris-HCl buffer, pH 7.4. Further dilutions were done in the same Tris-HCl buffer.
2-[125I]Iodomelatonin competition binding. CHO cells stably express-ing Flag-tagged recombinant human or mouse MT1 or MT2 melatonin receptors were grown in culture as monolayers in Ham’s F12 medium supplemented with fetal calf serum (10%), penicillin (1%; 10,000 I.U. ml−1)–streptomycin (5%; 10,000 μg ml−1) in CO2 at 37 °C as described. Cells were grown for 4 days to 90–95% confluence, then washed with PBS (potassium phosphate buffer, 10 mM, pH 7.4), detached with PBS containing 0.25 M sucrose and 1 mM EDTA, and pelleted by cen-trifugation (1,700g, 5 min) as described59. Cell pellets were suspended and homogenized in control buffer (50 mM Tris-HCl, 10 mM MgCl2; pH 7.4 at 25 °C) and washed twice by centrifugation (17,000g, 15 min) in control or inactive conformation buffer (50 mM Tris-HCl, 10 mM MgCl2, 100 μM GTP, 1 mM EDTA-Na2, 150 mM NaCl, pH 7.4 at 25 °C) as described59. 2-[125I]Iodomelatonin binding affinity was determined on membranes from CHO cells expressing human MT1 (9.6 ± 0.3 μg protein per assay;
Bmax = 1,154 ± 38 fmol mg−1 protein; n = 3), human MT2 (15 ± 1 μg protein per assay; Bmax = 352 ± 19 fmol mg−1 protein; n = 3), mouse MT1 (6.0 ± 0.022 μg protein per assay; Bmax = 1,705 ± 337 fmol mg−1 protein; n = 3) or mouse MT2 (6.4 ± 0.7 μg protein per assay; Bmax = 725 ± 93 fmol mg−1 protein;
n = 3). Ligand competition (10 pM to 100 μM) for 2-[125I]iodomelatonin (104 ± 2 pM, n = 30) binding was performed in control or inactive con-formation buffer in a total volume of 0.26 ml as described59. Assays were incubated for 1 h at 25 °C. Bound radioligand was separated from free by rapid vacuum filtration using glass microfibre filters (Whatman, Krackeler Scientific) saturated in 0.5% polyethylenimine solution. Total radioactivity bound to the filters was determined on a gamma counter59.
excluded from cell-based analyses when meeting the exclusion criteria of the outliers Grubbs test. Data shown in Fig. 2a, b were analysed by two-tailed paired Student’s t-test (Supplementary Table 5).
In vivo methods
Animals and housing. Male and female C3H/HeN wild-type, MT1KO, and MT2KO mice (average age, 6.28 months) used in this study were raised in our breeding colony at University at Buffalo. C3H/HeN mice homozygous for the MT1 and MT2 melatonin receptor gene deletion and their wild-type controls were generated from breeding pairs donated by S. M. Reppert (University of Massachusetts Medical School) and backcrossed with C3H/HeN mice (Harlan, now Envigo) for at least seven generations as described previously61. Genotype was confirmed using tail samples at the end of each experiment and was verified periodically during the tenure of the colony. The strains of mice in our breeding colony were re-derived periodically by backcrossing with wild-type mice to reduce genetic drift.
Mice were group-housed (3–5 per cage) with corncob bedding in poly-carbonate translucent cages (30 cm × 19 cm) and maintained in a 14/10 light–dark cycle (Zeitgeber time 0 (ZT 0) corresponds to lights on and ZT 14 to lights off) in temperature- and humidity-controlled rooms with ad libitum access to food and water in the Laboratory Animal Facility at the University at Buffalo. Light levels were 200–300 lx at the level of the cage. Treatments and animal care performed in the dark were carried out under a dim red safelight (15 W, Kodak 1A filter) with illuminance of less than 3 lx as described previously35. All experimental procedures using mice were conducted in accordance with guidelines set forth by the National Institutes of Health and approved by the University at Buffalo Institutional Animal Care and Use Committee.
Circadian rhythm measurements. Circadian rhythm phase was de-termined for each mouse using the onset of running wheel activity defined as CT 12 (onset of wheel activity). Running wheel activity was measured continuously by magnetic microswitches that detect wheel revolutions using a computer equipped with ClockLab data-collection software (Actimetrics). All actigraphy data were visualized and ana-lysed using ClockLab and MATLAB software. All mice were individually housed in cages (33 cm × 15 cm) equipped with running wheels in light-tight ventilated cabinets with controlled temperature and light–dark cycles (Phenome Technologies). Male and female mice were housed in separate cabinets for all experiments.
Phase shift. Changes in circadian phase induced by vehicle or drugs administered at various circadian times were assessed in wild-type, MT1KO and MT2KO male and female C3H/HeN mice (3–8 months of age) using methods and protocols that have been previously described34,35. Following a period of 14 days in a light–dark cycle, mice were placed in constant dark beginning at ZT 12 (dark onset) (ZT 0, lights on). Mice were kept in constant dark (2–3 weeks) until a stable free-running phase of running wheel activity rhythm onset was established. Circadian times of treatment were predicted from best fit lines of running wheel activ-ity onsets for running either before (7–14 days) and after (7–14 days) treatment. Treatment times were within a 2-h window at CT 2 (CT 1–3), CT 6 (CT 5–7) or CT 10 (CT 9–11). Mice were treated (0.1 ml per mouse, subcutaneously) with vehicle (30% ethanol saline, subcutaneously) or drugs (melatonin, UCSF3384 or UCSF7447, at 0.9 μg and 30 μg per mouse or luzindole at 300 μg per mouse in vehicle) for 3 consecutive days at the appropriate circadian time under dim red light. Vehicle or drug treatments were repeated for 3 consecutive days at the selected circadian time following the three-pulse treatment protocol described previously35. Phase shifts were quantified using the best fit lines for on-sets of activity during pre- and post-treatment periods. Differences are characterized as phase delays (pre-treatment ahead of post-treatment best fit line onset) or phase advances (post-treatment ahead of pre-treatment best fit line onset) of running wheel activity onset rhythms.
Re-entrainment experiments. Male and female C3H/HeN wild-type, MT1KO and MT2KO mice (3–6 months of age) were maintained under a 12:12 light–dark cycle for at least 2 weeks before experimental manipula-tions to enable stable entrainment to dark onset before advance of the light–dark cycle. Actigraphy data were recorded as described above and all experimental protocols were performed as described previously62. On the first day of treatment, the dark onset was advanced 6 h. This resulted in a short night. Mice were treated (0.1 ml per mouse, subcu-taneously) with vehicle (30% ethanol/70% saline) or drugs (melatonin,
UCSF3384 or UCSF7447 at 30 μg per mouse, or luzindole 300μg per
mouse, in vehicle) for three consecutive days 10–30 min before the new dark onset. After treatment, mice were given 14–20 days to re-entrain the onset of running wheel activity to the new dark onset. Using exported running wheel activity onsets from actograms, the number of onset hours advanced each day was determined by subtracting this value each day from the average onset of stably entrained running wheel activity for 3 days before treatment for each mouse. Furthermore, using the data from this calculation combined with visualization of actograms, the number of days to reach stable re-entrainment was determined for each mouse.
In vivo compound preparation. All compounds were administered in fixed doses of either 0.9 μg or 30 μg subcutaneously in a volume of 0.1 ml per mouse, which are equivalent to doses of 0.03 or 1 mg kg−1 for a 30 g mouse, respectively. Vehicle was 30% ethanol/70% saline for all doses. Melatonin, UCSF7447 and UCSF3384 were prepared as stock solutions of 3 mg ml−1 (100% ethanol) using sonication and vortexing to ensure that each drug was dissolved. Subsequently, stock solutions were diluted to 0.3 mg ml−1 (30 μg per 0.1 ml injection) or 0.009 mg ml−1 (0.9 μg per 0.1 ml injection) in vehicle. Luzindole was prepared similarly, except the starting stock solution was 30 mg ml−1 in 100% ethanol and it was administered from a solution of 3 mg ml−1 (300 μg per 0.1 ml injection) in vehicle. Treatment dilutions were prepared just before use under sonication with intermittent vortexing between steps and used within 5 min of preparation.
Data Fig. 7a–c were made by one-way ANOVA (P < 0.05) comparing hours shifted of circadian running wheel activity rhythm onsets (Fig. 3d (left), three groups: vehicle, melatonin and UCSF7447; Fig. 3d (centre), four groups vehicle, melatonin, UCSF7447 and UCSF3384; Extended Data Fig. 7a–c, four groups: vehicle, melatonin, UCSF7447 and luzindole) accompanied by post hoc analyses using Dunnet’s test to determine individual group differences compared with vehicle (P < 0.05). Compari-sons in Fig. 3d (right) between vehicle and luzindole were made using a two-tailed unpaired Student’s t-test (P < 0.05). Data in Fig. 3e, f were compared using a two-way ANOVA (3 × 2: genotype × treatment) with Tukey’s post hoc analyses (P < 0.05). P values and values for statistical analyses are included in the figure legends or listed in Supplementary Table 4. Either the overall interaction or the main effects are reported and interpreted using two-way ANOVAs as appropriate for assumptions of each dataset. No sex differences in treatment effects were evident in any dataset when assessed by two-way ANOVA or three-way ANOVA where appropriate; therefore, data were pooled between male and female mice for the described analyses. The n values represent the number of individual mice per condition or independent biological replicates in each experiment. Each dataset represents 2–4 independ-ent experimindepend-ents. The n value for each in vivo experimindepend-ent is listed below (n values with an asterisk indicate values for multiple comparisons ranging from 1 to 2 values less depending on the day of comparison due to missing onset data that are accounted for in statistical models as appropriate). See statistical parameters in Supplementary Table 4. Figure 3a, vehicle (n = 28 mice*) versus UCSF7447 (n = 21 mice*). Figure 3b, vehicle (n = 28) versus melatonin (n = 21), UCSF7447 (n = 21),
UCSF3384 (n = 16) or luzindole (n = 11). Figure 3c, wild-type (n = 28
vehicle; n = 21 UCSF7447), MT1KO (n = 16 vehicle; n = 16 UCSF7447) and MT2KO (n = 20 vehicle; n = 25 UCSF7447). Figure 3d, left: vehicle (n = 8) versus melatonin (n = 8) or UCSF7447 (n = 13); centre: vehicle (n = 15) versus melatonin (n = 10), UCSF3384 (n = 16) or UCSF7447 (n = 15); right: vehicle (n = 6) versus luzindole (n = 3). Figure 3e, wild-type (n = 9 vehicle;
n = 10 UCSF7447), MT1KO (n = 8 vehicle; n = 8 UCSF7447) and MT2KO (n = 11 vehicle; n = 9 UCSF7447). Figure 3f, wild-type (n = 8 vehicle; n = 8
UCSF7447), MT1KO (n = 6 vehicle; n = 7 UCSF7447) and MT2-KO (n = 10 vehicle; n = 13 UCSF7447).
Extended Data Figure 4l, C3H/HeN wild-type: vehicle (n = 28 mice*) versus UCSF3384 (n = 16 mice*). Extended Data Figure 4m, C3H/HeN MT1KO: vehicle (n = 16 mice*) versus UCSF7447 (n = 16 mice*). Extended Data Figure 4n, C3H/HeN MT2KO: vehicle (n = 21 mice*) versus UCSF7447 (n = 25 mice).
Extended Data Figure 7a, CT 2: vehicle (n = 3), melatonin (n = 3), luz-indole (n = 6) and UCSF7447 (n = 3). Extended Data Figure 7b, CT 6: vehicle (n = 8), melatonin (n = 4), luzindole (n = 9) and UCSF7447 (n = 9). Extended Data Figure 7c, CT 10: vehicle (n = 6), melatonin (n = 8), luz-indole (n = 3) and UCSF7447 (n = 4)
Pharmacokinetics. Pharmacokinetic experiments were performed by Sai Life Sciences. Plasma pharmacokinetics and brain distribution for
UCSF7447, UCSF3384 and UCSF4226 were investigated following a
single intravenous dose of 2 mg kg−1 in 9 male C57BL/6 mice. Each com-pound was formulated in 5% N-methyl-pyrrolidone, 5% solutol HS-15 and 90% normal saline. Blood samples (approximately 60 μl from each of three mice) were collected under light isoflurane anaesthesia from the retro-orbital plexus at 0.08, 0.25, 0.5, 1, 2, 4, 8, 12 and 24 h. Immediately after collection, plasma was obtained by centrifugation and stored at −70 °C until analysis. For blood collected at 0.5, 4 and 24 h, animals were euthanized with excess CO2 asphyxiation and brain samples were collected and homogenized in ice-cold phosphate-buffered saline (pH 7.4). Total homogenate volume was three times the brain weight.
All samples were processed for analysis by protein precipitation using acetonitrile and analysed using a fit-for-purpose LC–MS/MS method (lower limit of quantification, 2.01 ng ml−1 for plasma and 6.03 ng g−1 for brain for UCSF7447, 5.01 ng ml−1 for plasma and 3.00 ng g−1 for
brain for UCSF3384, 1.01 ng ml−1 for plasma and 6.09 ng g−1 for brain for UCSF4226). The non-compartmental analysis module in Phoenix WinNonlin (v.7.0) was used to assess the pharmacokinetic parameters. The maximum concentration (Cmax) and time to reach the maximum concentration (Tmax) were measured. The areas under the concentration time curve (AUClast and AUCinf) and elimination half-life were calculated by the linear trapezoidal rule. The terminal elimination rate constant,
ke, was determined by regression analysis of the linear terminal portion of the log plasma concentration–time curve. The terminal half-life (T1/2) was estimated as 0.693/ke.
Reporting summary
Further information on research design is available in the Nature Research Reporting Summary linked to this paper.
Data availability
Probe pairs (two similar ligands with and without activity) of inverse agonists selective for MT1 and agonists selective for hMT2 are available by arrangement with Sigma (Extended Data Fig. 3). The identities of the compounds docked in this study are freely available from the ZINC database (http://zinc15.docking.org) and active compounds may be purchased from Enamine. Raw data are available for Fig. 1, Extended Data Tables 1, 2 and Extended Data Figs. 1, 2 in Supplementary Tables 1 (MT1 and MT2 affinities, MT1 DOCK energies and ranks) and 2 (com-pound purity information). Bias information for Extended Data Fig. 3 is included in Supplementary Table 3. For Fig. 2, data from the GPCRome screens, concentration–response curves, and competition binding and LC–MS experiments are included in Supplementary Data 1–5 and synthesis routes and spectra of compounds in Supplementary Data 6, 7. Further data for Fig. 3 are included in Extended Data Figs. 4, 5, 7 and Supplementary Table 4. Raw data values and transformed data for in vitro cell-based assays as well as in vivo data for phase shift and re-entrainment are available for Figs. 2, 3 and Extended Data Figs. 4 (re-entrainment), 5 (phase shift), 6, 7a–c.
Code availability
DOCK3.7 is freely available for non-commercial research (http://dock. compbio.ucsf.edu/DOCK3.7/). A web-based version is freely available to all at http://blaster.docking.org/. The ultra-large library used here is freely available at http://zinc15.docking.org/.
47. Word, J. M., Lovell, S. C., Richardson, J. S. & Richardson, D. C. Asparagine and glutamine: using hydrogen atom contacts in the choice of side-chain amide orientation. J. Mol. Biol. 285, 1735–1747 (1999).
48. Weiner, S. J. et al. A new force field for molecular mechanical simulation of nucleic acids and proteins. J. Am. Chem. Soc. 106, 765–784 (1984).
49. Carlsson, J. et al. Structure-based discovery of A2A adenosine receptor ligands. J. Med.
Chem. 53, 3748–3755 (2010).
50. Gallagher, K. & Sharp, K. Electrostatic contributions to heat capacity changes of DNA-ligand binding. Biophys. J. 75, 769–776 (1998).
51. Mysinger, M. M. & Shoichet, B. K. Rapid context-dependent ligand desolvation in molecular docking. J. Chem. Inf. Model. 50, 1561–1573 (2010).
52. Southan, C. et al. The IUPHAR/BPS guide to pharmacology in 2016: towards curated quantitative interactions between 1300 protein targets and 6000 ligands. Nucleic Acids Res. 44, D1054–D1068 (2016).
53. Tolmachev, A. et al. Expanding synthesizable space of disubstituted 1,2,4-oxadiazoles. ACS Comb. Sci. 18, 616–624 (2016).
54. Kroeze, W. K. et al. PRESTO-Tango as an open-source resource for interrogation of the druggable human GPCRome. Nat. Struct. Mol. Biol. 22, 362–369 (2015).
55. Kenakin, T., Watson, C., Muniz-Medina, V., Christopoulos, A. & Novick, S. A simple method for quantifying functional selectivity and agonist bias. ACS Chem. Neurosci. 3, 193–203 (2012).
56. Kenakin, T. Biased receptor signaling in drug discovery. Pharmacol. Rev. 71, 267–315 (2019).
57. Longo, P. A., Kavran, J. M., Kim, M. S. & Leahy, D. J. Transient mammalian cell transfection with polyethylenimine (PEI). Methods Enzymol. 529, 227–240 (2013).
58. Besnard, J. et al. Automated design of ligands to polypharmacological profiles. Nature 492, 215–220 (2012).
60. Cheng, Y.-C. & Prusoff, W. H. Relationship between the inhibition constant (KI) and the concentration of inhibitor which causes 50 per cent inhibition (I50) of an enzymatic
reaction. Biochem. Pharmacol. 22, 3099–3108 (1973).
61. Sumaya, I. C., Masana, M. I. & Dubocovich, M. L. The antidepressant-like effect of the melatonin receptor ligand luzindole in mice during forced swimming requires expression of MT2 but not MT1 melatonin receptors. J. Pineal Res. 39, 170–177
(2005).
62. Dubocovich, M. L., Hudson, R. L., Sumaya, I. C., Masana, M. I. & Manna, E. Effect of MT1
melatonin receptor deletion on melatonin-mediated phase shift of circadian rhythms in the C57BL/6 mouse. J. Pineal Res. 39, 113–120 (2005).
Acknowledgements This study was supported by US NIH awards U24DK1169195 (to B.L.R. and B.K.S.), R35GM122481 (to B.K.S.), the NIMH Psychoactive Drug Screening Contract (to B.L.R.), GM133836 (to J.J.I.), ES023684 (to M.L.D.), UL1TR001412 and KL2TR001413 (to the University at Buffalo), a PhRMA Foundation Fellowship (73309 to A.J.J.), Jacobs School of Medicine and Biomedical Sciences unrestricted funds (to M.L.D.), R35GM127086 (to V.C.), EMBO ALTF 677-2014 (to B.S.), HFSP long-term fellowship LT000046/2014-L (to L.C.J.), a postdoctoral fellowship from the Swedish Research Council (to L.C.J.) and the National Science Foundation (NSF) BioXFEL Science and Technology Center 1231306 (to B.S. and V.C.). We thank G. Wilding from the Biostatistics, Epidemiology and Research Design (BERD) Core of the Clinical and Translational Science Institute at the University at Buffalo for statistical advice regarding analyses of in vivo data.
Author contributions B.K.S., B.L.R. and M.L.D. conceived the study. R.M.S. performed the docking and structure-based optimization. J.D.M. and H.J.K. performed the initial binding and functional assays and analyses, assisted by T.C. A.J.J. performed the 2-[I125]iodomelatonin and
GTP-perturbation assays. S.S. performed the profiling studies. G.C.G. performed the in vivo mouse pharmacology experiments and all animal husbandry. Y.S.M. and O.S. directed the compound synthesis, purification and characterization experiments. B.S., L.C.J., V.C., B.L.R., X.-P.H. and J.D.M. determined and validated the structures of the MT1 and MT2 receptor types, and made them
available before publication. T.K. performed signalling bias calculations. J.J.I. created the ultra-large libraries. B.L.R. supervised the pharmacology studies; B.K.S. supervised the docking and compound optimization; M.L.D. supervised the binding studies and the in vivo circadian rhythm experiments in mice. M.L.D. G.C.G. designed all in vivo experiments. R.M.S., B.K.S., M.L.D., G.C.G., J.D.M., H.J.K. and B.L.R. wrote the paper with contributions from other authors.
Competing interests B.K.S. and J.J.I. are founders of a company, BlueDolphin LLC, that works in the area of molecular docking. All other authors declare no competing interests.
Additional information
Supplementary information is available for this paper at https://doi.org/10.1038/s41586-020-2027-0.
Correspondence and requests for materials should be addressed to B.K.S., B.L.R. or M.L.D. Peer review information Nature thanks Derk-Jan Dijk, Irina Kufareva and Ieva Sutkeviciute for their contribution to the peer review of this work.
Extended Data Fig. 1 | Concentration–response curves of the initial 15 compounds in cAMP assays. a–f, Inhibition of isoproterenol-stimulated cAMP mediated by hMT1 (a, c, e) or hMT2 (b, d, f) in HEK293T cells by melatonin and
the 15 initial compounds. Data are normalized to the melatonin response. The 15 initial compounds were split into three graphs for clarity, melatonin
Extended Data Fig. 2 | Concentration–response curves of notable analogues based on initial hits in cAMP assays. a–f, Inhibition of isoproterenol-stimulated cAMP mediated by hMT1 (a, c, e) or hMT2 (b, d, f) in HEK293T cells by
melatonin and select analogues. Data are normalized to the melatonin response. The compounds were split into three graphs for clarity, melatonin