Explaining Student Behavior at Scale: The Influence of
Video Complexity on Student Dwelling Time
Frans van der Sluis
Online Learning Lab
Center for Innovation
Leiden University
The Hague, The Netherlands
[email protected]
Jasper Ginn
Online Learning Lab
Center for Innovation
Leiden University
The Hague, The Netherlands
[email protected]
Tim van der Zee
Leiden University Graduate
School of Teaching
Leiden University
Leiden, The Netherlands
[email protected]
ABSTRACT
Understanding why and how students interact with educational videos is essential to further improve the quality of Massive Online Open Courses (MOOCs). In this paper, we look at the complexity of videos to explain two related aspects of student behavior: the dwelling time (how much time students spend watching a video) and the dwelling rate (how much of the video they actually see). Building on a strong tradition of psycholinguistics, we formalize a definition for information complexity in videos. Furthermore, building on recent ad-vancements in time-on-task measures we formalize dwelling time and dwelling rate based on click-stream trace data. The resulting computational model of video complexity explains 22.44% of the variance in the dwelling rate for students that finish watching a paragraph of a video. Video complexity and student dwelling show a polynomial relationship, where both low and high complexity increases dwelling. These results indicate why students spend more time watching (and possibly contemplating about) a video. Furthermore, they show that even fairly straightforward proxies of student behavior such as dwelling can already have multiple interpretations; illustrating the challenge of sense-making from learning analytics.
Author Keywords
MOOCs; video; information complexity; dwelling time; learning analytics; student behavior.
INTRODUCTION
MOOCs have enjoyed increasing attention and popularity in recent years. The enthusiasm surrounding MOOCs is related to their ability provide large and previously hard-to-reach au-diences with easy access to open content and for bringing students the autonomy to learn at their own pace [16]. De-spite the recent successes of MOOCs, they have also been criticized due to unsatisfactory learning outcomes and poor implementation of instructional design principles [25]. Their
Permission to make digital or hard copies of all or part of this work for personal or classroom use is granted without fee provided that copies are not made or distributed for profit or commercial advantage and that copies bear this notice and the full citation on the first page. Copyrights for components of this work owned by others than ACM must be honored. Abstracting with credit is permitted. To copy otherwise, or republish, to post on servers or to redistribute to lists, requires prior specific permission and/or a fee. Request permissions from [email protected].
L@S 2016, April 25–26, 2016, Edinburgh, UK.
Copyright © 2016 ACM 978-1-4503-3726-7/16/04 ...$15.00.
scale, one-size-fits-all approach, and lack of face-to-face inter-action limit MOOCs in their ability to sufficiently support the learning process of students [17].
Compared to traditional classroom education, online educa-tion distinguishes itself in two important ways. Firstly, it lacks the control over the learning process that is typical for the classroom situation. An class teacher has a vast array of in-terventions available to steer the behavior of his or her students. To the contrary, MOOCs offer no such flexibility. Secondly, online education offers an opportunity to evaluate and explain student behavior through the vast amounts of data that can be gathered online. Essentially, online education exchanges control over the learning process for an abundance of data with which to monitor learners at scale. The challenge is to leverage this data to explain and steer student behavior.
Videos make up most of the educational content in MOOCs. This makes it important to better understand how students interact and engage with educational videos. By sensing the clicks of students as they navigate through the content of a course, we can create models that have the potential to predict various aspects of the learning process. For example, [23] eval-uate how click actions (pauses, seeking, skipping, replaying) reflect the perceived difficulty of a video, whereas [32] use click sequences to predict in-video dropouts, dwelling time, complete course dropouts, and subsequent clicks. However, the analysis of student behavior through clicks tends to be too granular for sense-making; that is, to be able to unam-biguously assign meaning to clicks and subsequently explain student behavior [28].
learning process. Nonetheless, several studies have proposed guidelines on creating “good” videos for MOOCs based on analyzing dwelling time, such as [19]. A particular popular guideline is the ’less than 6 minutes’ recommendation, pro-posed by [10], which is also based on analyzing dwelling times.
Student background is an important factor in explaining the time that students spend on watching a video. When students re-visit a course, re-watch a particular video, or watch an educational video as part of an on-campus education, they tend to be more selective about which parts of the video they view [3, 18, 23]. Furthermore, perceived difficulty is a confirmed factor for lower dwelling time. That is, difficulty correlates negatively with dwelling time [23].
Most insights on dwelling time come from studies looking to explain how humans read and use text. For the most part, such studies focus on the relevance of - and interest for - a text. Regarding the relevance of search results, [6] show that the difference in readability between document and search result snippet negatively predicts dwelling time, explaining 69% of its variation in the first 120 seconds. Likewise, for the interest in text, [31] show that interested readers have a lower reading time than non-interested readers. In turn, this can also be explained by textual complexity, such that complexity increases interest up to the point that it becomes too difficult to understand and slows down reading [33, 14]. Similarly, a lack of complexity reduces interest, causing readers to be more easily distracted while reading [31]. We can conclude from research on reading that information complexity is a key factor of dwelling time. In this paper, we explore whether similar effects can be seen for educational videos as for text. We hypothesize that:
1. Dwelling time increases in videos with high information complexity, and that;
2. Dwelling time increases in videos with low information complexity.
In order to (dis)confirm these hypotheses, we aim to make two contributions. First, we formalize both information com-plexity and student dwelling time within the context of videos by proposing a mathematical definition for both. Then, we explore whether, and if sohowdwelling time is explained by information complexity. To this end, we look at the dwelling time of 471,179 episodes of students watching a (part of a) video. These contributions have the potential to attach mean-ing to a student’s dwellmean-ing rate by showmean-ing how it relates to one of its causes - the information complexity. In turn, they put the basis for using video complexity as a metric that can hypothetically be optimized for a student’s learning process. This approach aims for sense-making by interpreting large-scale data on student behavior in a theoretically sound and meaningful way. Moreover, it aims to turn this understanding into actionable learning analytics by subsequently formalizing the causes of student behaviour.
This paper is organized as follows. First, theScalable Defi-nitionssection introduces and defines, respectively, measures of information rate and dwelling rate for videos. In turn, the
MethodologyandResultsdescribe a study on the relation be-tween these variables for 104 educational videos. Finally, the Discussioninterprets and discusses the theoretical as well as the practical implications of the findings on the influence of video complexity on student dwelling time.
SCALABLE DEFINITIONS
Dwelling rate
In its most basic definition, dwelling time is the time that users spend on a piece of content [6]. This is a variant of a time-on-task measure, where viewing content is only one of many possible tasks that a student undertakes during learning. In the case of educational videos, we can not only estimate the dwelling time but also the dwelling rate. Whereas dwelling time refers to how much time students spend watching a video, the dwelling rate refers to how much of the video they actually see. To compare across videos and with the information con-veyed within a video, we will define both measures as relative to the duration of the video.
Measuring time-on-task is complicated because most Learning Management Systems (LMS) only record events spread out over time (e.g., login, submit assignment), but do not record actual activity (e.g., working on an assignment) [20]. Time-on-task can only be estimated given a sufficient level of density and detail in the recorded events. The click events recorded by modern LMSs contain such detail, showing precisely which actions students take while watching a video (e.g., seeking, pausing) and when the video starts and ends. However, such time-on-task measures are based on the assumption that the time spent between two actions is spent on a task. This section discusses how video dwelling can be estimated from such sparse events.
Time-on-task estimation
Current efforts already seek to leverage click-stream logs to estimate how students watch a lecture video. For example, [18] analyze particular re-watching activity by looking at local peaks in backward seek actions. Similarly, [23] analyze for-ward seeking frequency and skipped video length. However, timed-based task estimators have been shown to work better than frequency-based estimators, explaining up to 15% more variance in learning behavior and outcomes [20]. [28] reach similar conclusions. Whereas it is difficult to unambiguously assign meaning to clicks (seeIntroduction), time-based esti-mators give a more precise estimation of student activity. In order to arrive at a reasonable estimation of dwelling time and dwelling rate, we extend on current efforts to analyze click-stream data [18, 23] by using these recent insights on deriving student activity from events [20].
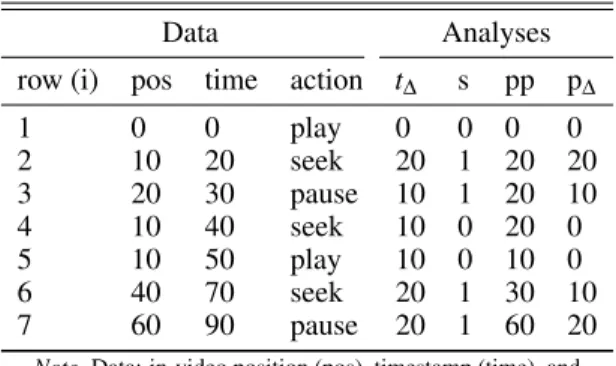
Table 1. Example click-stream trace log and analyses
Data Analyses
row (i) pos time action t∆ s pp p∆
1 0 0 play 0 0 0 0
2 10 20 seek 20 1 20 20
3 20 30 pause 10 1 20 10
4 10 40 seek 10 0 20 0
5 10 50 play 10 0 10 0
6 40 70 seek 20 1 30 10
7 60 90 pause 20 1 60 20
Note. Data: in-video position (pos), timestamp (time), and play rate (rate).
Note. Analyses: time increment (t∆), play state (s), initial position (pp), and4tu position increment (p∆).
defining dwelling rate and related features, the results of which are also included in Table 1. Each will be explained next.
The time spent in between two consecutive actionsiandi−1 forms the basis for any time-on-task measure [20]. Given the time of actioni,t∆can be defined as:
t∆(i) =time(i)−time(i−1).
To determine whether a video is actually running, the play state is derived from the action trace. Since we are interested in the period and with that the play state up to the point that an action is performed, this variable is defined as the play states up to and excluding the actioniitself:
s(i) =
1 if action(i−1) =‘play0 0 if action(i−1) =‘pause0 pos(i−1) otherwise
The value ofs(0)is to be set to either 0 or 1, depending on whether a video is already playing at the moment the video is opened by a student.
As Table 1 illustrates, the position pos can change due to viewing as well as through seek actions. This makes it difficult to determine how much of a video the student actually viewed. Moreover, it complicates the procedure by which we assign an in-video action to a section of the video. To mitigate this difficulty, we define the initial positionppof an actionibased on the previous actioni−1:
pp=
pos(i−1) if s(i) =0 pos(i−1) +t∆(i) otherwise
To determine how much of a video a student watched, the change in video positionp∆is derived from the action trace. Since it is not straightforward to derive ap∆measure solely from the changes in position pos(i)alone, we use the initial positionppto definep∆:
p∆(i) =
0 if s(i) =0 pp−pos(i−1) otherwise
Combined, the preceding set of features allows us to estimate the time-on-task.
Towards a measure of dwelling time and rate
Using the click-stream trace data and aforementioned anal-yses, we define two aspects of dwelling: time and rate. We define dwelling time as the total time that a student spends on watching a video relative to the nominal length of that video. As such, we regard pause time as integral to the time spent on watching a video:
∑it∆(i)
video duration (1)
Making dwelling time a function of video duration allows us to compare the amount of information viewed per amount of time (see next section).
We define dwelling rate as how much more or less a student watches of a video relative to the nominal length of that video. Formally, the dwelling rate is expressed as:
∑ip∆(i)
video duration (2)
This measure of dwelling rate has the particular advantage of only looking at (re-)watching, where re-watching is a par-ticular method that helps understanding complex videos by spreading the same amount of information over a longer period of time.
By definition, dwelling time includes time spent on activities other than watching the video. This follows an assumption common to time-on-task measures that the time spent in be-tween the recorded actions is spent on the attributed task. This is a fairly flexible definition, which can not only include time to think but also time to find background information on exter-nal websites. Since this can make the dwelling time a multiple of the video length, it is likely that this has a substantial effect on the variance. On the contrary, the definition of dwelling rate excludes most of the variance that would otherwise occur in dwelling time.
Information rate
Whereas measures of complexity are fairly well-defined for text [2], similar metrics for the complexity of the information in videos are scarce. Video adds both a time and visual di-mension to textual information, making such a metric more complicated than for text. Notwithstanding, the heavy reliance on spoken words in educational videos in MOOCs opens up the possibility to derive a complexity measure from video transcripts. Even though this focus on transcripts disregards both the visual and auditory channel, a substantial part of the educational content is embedded in what is being said. This possibility is further supported by evidence that language pre-sented either verbally or visually is processed in the same working memory component, the so-called phonological loop [1, 27, 9].
one needs to identify plausible and robust features of textual information complexity. Secondly, one needs to extend tex-tual information complexity to information rate by including the time dimension. Both challenges will be addressed in the subsequent sections.
Features of textual complexity
Since Lively and Pressey [24] introduced the first readability indicator roughly a century ago, many additional models of textual complexity have been created. Many of these models have since been criticized for their utilization of surface-level indicators as proxies for complex cognitive processes that occur when reading a text [2]. This argument is similar to that of [28], who argues that it is difficult to unambiguously assign meaning to surface-level indicators such as a certain number of words per sentence. Notable exceptions are in [34, 33], who apply deep syntactic-semantic analyses to better reflect the complex cognitive processes during reading.
To define a plausible and robust measure of complexity, we adopt a set of features introduced by [33]. Each of these features are based on well-known psycholinguistic findings on the causes of reading difficulty and are designed to be robust against overfitting. The applicability and robustness of this model has been shown elsewhere. The model used in [33] predicted human ratings of complexity withr=.442 on a new data set not used during model training. We will describe each of the features shortly. Domain-specific language aspects are deliberately not included, as the goal is to formalize a general model of information complexity which can be broadly applied.
Word length is a classic approach to inferring readability, having a central role in nearly all formulas concerning read-ability. The importance of word length is well supported. Longer words give higher fixation durations during reading [15], whereas shorter words are more likely to be skipped while reading [4]. Word length is generally defined in the following two ways:
len1=|c∈w|, word length in characterscper wordw;
len2=|s∈w|, word length in syllablessper wordw.
Sentence lengthis related to syntactic difficulty [7]. A sentence consisting of more words is likely to have more dependencies connecting them. The most common measure of sentence length is calculated by looking at the number of words.
wps=log|w∈S|, wordswper sentenceS.
A logarithm is added to counter a long tail in the length of sentences.
Lexical familiarityindicates how familiar a reader is with a word. It influences a reader’s fixations, such that more frequent words take less initial processing time [13] and high-frequency words are more likely to be skipped than less frequent words [29]. The most salient measure of lexical familiarity is printed word frequency. This can generally be approximated with two metrics. Based on the occurrence of a word on either the Dale list of 3000 common words [5] or on a large representative collection of writing:
fam1=|{w∈|wT∈|wT∈|D}|, the frequency of wordswon the Dale listDrelative to all the words in a textT.
fam2=log10cnt(w), the logarithm of the term count cnt per wordw.
For this study, the Google Books N-Gram corpus will be used for the term count function cnt.
Character and word density. Numerous studies related to priming have shown that a target string is better identified when it shares letters with a prime. This holds for identity priming (repeating the prime), form priming (using a partly different string) [11], as well as over longer distances [21].
Repetition creates a form of redundancy which can be mea-sured in terms of entropy. It defines the number of bits needed to encode a message [30]. Since the aim is not to measure text size but instead, to measure size-invariant information density, a sliding window is applied within which local entropy is cal-culated. Given the probabilitypof a sequencex1. . .xn, the
Sliding Window Entropy (SWE)Hw,noverXcan be defined
as:
Hw,n(X) = N
∑
i=w
1
N−wHn◦ {xj:j=i−w+1, . . . ,i} Hn(X) =−
∑
x1,...,xn∈X
p(x1, ...,xn)2logp(x1, ...,xn)
Here, w is the window size. Using Hw,n two features are
defined:
chan=Hw,n(C),n-gram SWE over charactersC.
worn=Hw,n(W),n-gram SWE over wordsW.
Dependency Locality Theory (DLT) states that a reader, while reading a sentence, performs a moment-by-moment integra-tion of new informaintegra-tion sources [8]. The amount of cognitive resources (i.e., integration costs) that this requires has been shown to account for differences in reading time across a range of linguistic effects [22]. Integration costs are dependent on the distance between the to be integrated head and its refer-ent, where distance is measured by the number of intervening discourse elements [8]. This effect is also present in learning from educational videos [27, 26], and is stronger for more complex videos [9]. This is approximated by defining a (new) discourse referent as a noun or verb (phrase).
Given a dependencydconnecting wordsaandb. LetYdbe a
collection containing each part-of-speech tagyfor the words and phrases between and including wordaandb, then the dependency length of dependencydis given by:
int= ∑d∈Dlog|{y ∈Yd|y ∈ {noun,verb}}|, integration
costs of dependenciesDin a sentence.
A logarithm is added to counter a long tail in integration costs.
Towards a measure of information rate
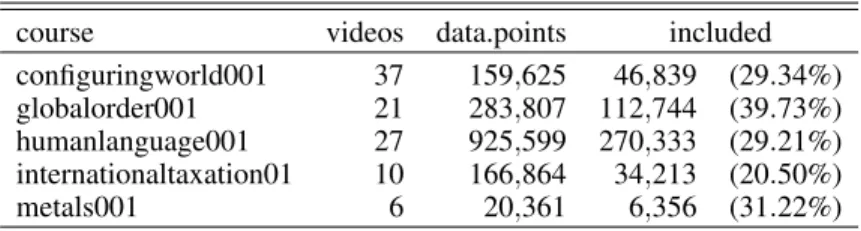
Table 2. Coursera click-stream data
course videos data.points included
configuringworld001 37 159,625 46,839 (29.34%) globalorder001 21 283,807 112,744 (39.73%) humanlanguage001 27 925,599 270,333 (29.21%) internationaltaxation01 10 166,864 34,213 (20.50%) metals001 6 20,361 6,356 (31.22%)
distinctive levels of complexity, namely on two ‘languages’ from Wikipedia: Simple English and regular English. The details of this model generation step are explained further on in theMethodologysection.
Given the resulting metric ofcomplexity, a measure of infor-mation rate can be defined as follows:
complexity×words per second (3)
Since words are the common information-bearing tokens in communication [14], this measure includes the time dimension throughwords per second.
By formalizing information rate in Equation 3, a scalable definition is given based on the spoken words in a video. This definition relies on a robust set of features which is expected to be applicable to video transcripts, even though they are likely distinct from normal texts. Furthermore, it relies on a plausible set of features which is expected to result in a meaningful, interpretable, outcome.
METHODOLOGY
Data sets
Wikipedia articles
Two ‘languages’ from Wikipedia were used to train a model of textual complexity: Simple English and regular English. These two languages are intended to be distinctive in their level of complexity as authors are instructed to use easy words and shorter sentences, but not to include less information. Only ar-ticles that occurred in both languages were selected, allowing for a pair-wise comparison, and which were neither a stub (i.e., incomplete) nor a special, redirect, or disambiguation page. Based on the Simple English creation date the oldest 10,000 pairs, a total of 20,000 articles, were used for classification purposes. The underlying assumption being that more ma-tured articles better reflect the intended writing style. As these articles address a wide range of topics they were deemed espe-cially relevant for constructing a model of general information complexity which is not biased towards a certain domain.
The following pre-processing steps were performed on the Wikipedia data set. The data consisted of two dumps from August 3, 2011, containing all articles encoded as wiki-text for both languages. Using JWPL [35], both dumps were imported into a MySQL database and subsequently parsed to plain text. All templates and links to files and images were removed.
Coursera videos, transcripts and click streams
The data used in our study comes from five MOOCs (see Table 2). These courses were organized by Leiden University be-tween 2014 and 2015. The MOOC videos differ substantially
in the topics being discussed, such as environmental issues, political affairs, linguistics, and tax law. The most common production style used throughout the videos is the ’talking head’ setup. In certain videos this was supplemented or mixed with additional graphics or text. As is typical for MOOCs, the videos can be considered the core educational content of the MOOCs.
Of the five MOOCs, the data of a total of 104 videos were analyzed. The original transcripts, originally uploaded by the administrators of the respective courses, were extracted for each video. The transcript of each video was analyzed to de-termine its complexity. Function words such as ”[SILENCE]” were removed and the transcripts were split per paragraph before analysis. We define a paragraph within a video based on the locations of the in-video questions. The complexity analysis was performed on the paragraphs, in order to make any local difficulties more apparent in the analyses and reduce the influence of confounding effects that can occur over a longer time period.
Click-stream data from students interacting with the selected courses was examined as proxy of student behavior. To this end, users not registered as students (for example, course administrators) were excluded from the data. Click-stream actions were attributed to video paragraphs using pp from Table 1. The total amount of watching episodes before further filtering was 1,556,256.
We filtered for only those students who finished watching a video paragraph. Given the fact that we want to measure dwelling time, this approach allows us to examine user ses-sions for which we can accurately compute the time spent on a task. Whether a student reached the end of a section was determined based on an auto-generated pause action at the time of an in-video question. Because a student often skips the final seconds of the video, preventing a pause-action from being generated, we look at any action in the last ten seconds of a video to estimate whether a student finished the final paragraph. Furthermore, only those sessions were included in which students did not change the play rate of the video. We chose to do this such as to prevent any complicating factors to the analysis, given its influence on both information rate and dwelling rate and time. After filtering the resulting data set contained 471,179 unique user sessions with any of the videos.
Feature computation
the number of syllables per word was measured using the Fathom toolkit. For featurefam2the Google Books N-Gram corpus was used as model representative for common English. The word counts were summed for each lower-cased word over the years starting from the year 2000. For featuredlt the Stanford Parser was used to parse sentence dependencies. For the SWE features (chaandwor) entropy was based on n-grams of lengthn=1. . .3 and windows of sizew=15 for words andw=50 for characters. For featureworin particular, the Snowball stemmer was used to reduce words to their root form. Stemming reduces simple syntactical variance and, in turn, gives more significance to the semantic meaning of a word.
We used the R statistical language to compute all features re-lating to clickstream behaviour. We further used thermongodb andRmySQLpackages to query data, and thedata.table,rjson, stringrandparallelpackages to clean and process the data.
Statistical methods
All statistical analyses were implemented using R [12].
Classifier.A Logistic Regression Model (LRM) was trained
on the paragraphs from each of the pre-selected 10,000 articles per Wikipedia language. To decrease the importance of the particular data set used and increase the importance of the individual features, an LRM was chosen as a simple, linear classifier.
As a first pre-processing step, features containing more than 10% of missing values were removed, after which any obser-vations containing missing values were removed. The data was balanced to assure it contained an equal number of simple and normal paragraphs. To select the best possible subset of features, both forward and backward stepwise search through the feature set was applied. As tuning parameterk=log10(n) was set, where nis the number of observations, specifying a penalty for the number of variables included in a model. To validate the classification performance the classifier was trained on 80% and tested on 20% of the data set.
Graphical fit.To illustrate the relation between an
indepen-dent and a depenindepen-dent variable, in Figure 2 a smoothing tech-nique was used. This techtech-nique fits a polynomial surface determined by the independent variable based on local fitting. At a point x a fit is made using all other points weighted by their distance from x1. Standard parameters were used for the weights (i.e.,(1− distance
maximumdistance 3
)3). We set the span parame-ter to use all the data points when deparame-termining the fit. This is a strong smoother that was necessary to reduce noise, in par-ticular with dwelling time. To indicate a goodness-of-fit, the 95% confidence intervals were included in the figures as well. The graphs were based on a random selection of 2,000 data points to keep its computation efficient, yet not overestimate the statistical confidence (intervals).
Polynomial model.We used a simple 2-level linear regression
model to evaluate the evidence for our hypotheses. The model was fitted using a least-squares estimation. We report theR2as
1Seehttp://stat.ethz.ch/R-manual/R-patched/library/stats/
html/loess.html
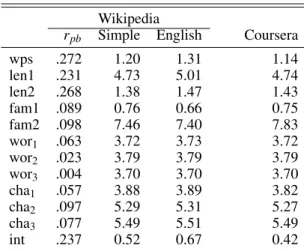
Table 3. Summary statistics
Wikipedia
rpb Simple English Coursera
wps .272 1.20 1.31 1.14
len1 .231 4.73 5.01 4.74
len2 .268 1.38 1.47 1.43
fam1 .089 0.76 0.66 0.75
fam2 .098 7.46 7.40 7.83
wor1 .063 3.72 3.73 3.72
wor2 .023 3.79 3.79 3.79
wor3 .004 3.70 3.70 3.70
cha1 .057 3.88 3.89 3.82
cha2 .097 5.29 5.31 5.27
cha3 .077 5.49 5.51 5.49
int .237 0.52 0.67 0.42
Note.rpbdenotes the point-biserial correlation coefficient for distinguishing between Simple and English Wikipedia.
well as the standard error, the latter of which can be compared to the range of the dependent variable to give an evaluation of the model.
RESULTS
Video Complexity
Table 3 gives the summary statistics for each feature on both the Wikipedia and Coursera data sets. The table shows that the features give similar results on both data sets, indicating the possibility of applying the Wikipedia data set features to analyze Coursera transcripts.
Using each of the features from Table 3 as input, a LRM was trained with stepwise feature selection. The model is able to predict whether a paragraph was either Simple English or English with 68.03% accuracy. The resulting regression equation is:
complexity=−11.64+2.54×wps+3.22×len2
+1.18×cha1−0.23×fam2+3.40×cha3 −4.16×wor3−0.27×fam1+0.26×int −0.53×wor0
(4) All predictors are significant at ap< .001 probability. Whilst these features can distinguish well between articles (with 90.87% accuracy, see [33]), the problem of distinguishing be-tween paragraphs seems substantially more challenging with an accuracy of 68.03%. Even though the performance on this data set is fairly low, the model is based on few, yet meaning-ful features to support the aim of using the resulting model for explaining student behavior.
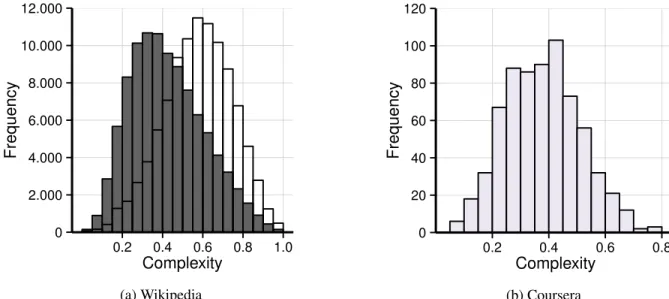
0 2.000 4.000 6.000 8.000 10.000 12.000
0.2 0.4 0.6 0.8 1.0
Complexity
Frequency
(a) Wikipedia
0 20 40 60 80 100 120
0.2 0.4 0.6 0.8
Complexity
Frequency
(b) Coursera Figure 1. Histograms of complexity analysis.
transcripts in the same way as it can be for the Wikipedia para-graphs. However, one notable difference is the overall lower level of complexity for the Coursera transcripts in comparison to English Wikipedia.
Dwelling Time
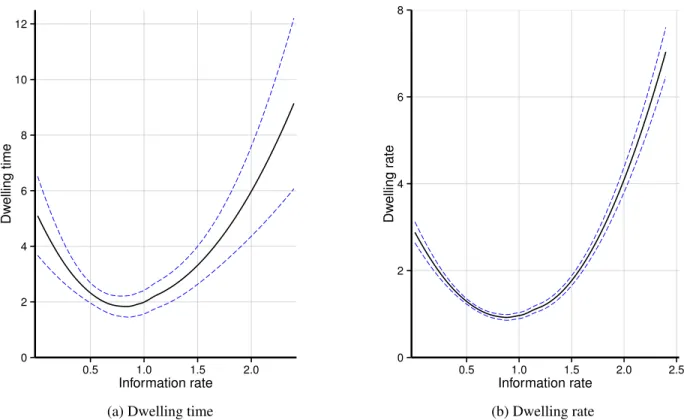
Figure 2 compares information rate with how long and how much students watch a video paragraph for those students who finished watching a paragraph. The graphs are based on a fit line, suppressing details yet highlighting an overall trend. A similar trend is apparent for both graphs, showing an increased student dwelling at the lower as well as at the higher ranges of information rate. This trend suggests a confirmation of our hypotheses.
Remarkable differences are, for dwelling time, a sharper in-crease at both a low and high information rate and in general substantially more variation. These differences can be ex-pected from dwelling time in comparison to dwelling rate, as the dwelling time includes time that students did not spend on watching the video but instead on activities such as finding more information.
The trends described in Figure 2 are explained using two linear regression models. The resulting models confirm the trend for dwelling rate, explainingR2=22.44% of variance (SE=1.32, F(2,451679) =65330, p< .001). Yet, the models do not confirm the trend for dwelling time, explaining onlyR2=
1.43% of variance (SE=10.67,F(2,451679) =3268, p< .001). This difference can be expected given the naturally higher variance in dwelling time. For the confirmed model of dwelling rate, the resulting model equation is:
dwelling rate=3.20−5.37×information rate
+3.02×information rate2 (5)
All parameters are significant atp< .001.
DISCUSSION
Understanding how students interact with videos and what causes this behavior is of great importance to improve future MOOCs. Our work consists of two contributions towards this goal. Firstly, we demonstrated a formalization of information rate and dwelling in educational videos. Secondly, we showed how a student’s dwelling rate is a function of information rate. The relationship between information rate and dwelling rate follows a polynomial pattern, such that high dwelling times are typical for videos having either low and high rates of information. A similar trend was found for the relation between information rate and dwelling time. These findings are remarkable, as it is typically assumed that high dwelling rates and times would only be associated with high rates of information.
The value of both contributions is confirmed by two regression models. For information rate, a LRM gave 68.03% accu-racy on distinguishing Simple English from regular English in our ground truth, on an 80%/20% train/test split of 20,000 Wikipedia paragraphs. Although this accuracy is not as high as desired, it does indicate the model is successful. In particular, the accuracy confirms the model’s value on a ground truth that is challenging due to the short length of the paragraphs. For dwelling rate, the polynomial regression model gave an explained variance of 22.44% by information rate. This is a particular high value, especially since it explains actual student behavior on a real-world data set and at scale.
Video Complexity
0 2 4 6 8 10 12
0.5 1.0 1.5 2.0
Information rate
Dw
elling time
(a) Dwelling time
0 2 4 6 8
0.5 1.0 1.5 2.0 2.5
Information rate
Dw
elling r
ate
(b) Dwelling rate
Figure 2. Fit-line with confidence intervals showing the relation between information rate and either relative dwelling time (a) or rate (b).
This study calls attention to several novel aspects of video tran-scripts which may commonly be ignored when considering information complexity. Other than straightforward charac-teristics such as sentence and word length, complexity is also based on lexical familiarity, character and word density, and distances between related words. The advantage of these metrics is that they are not based on assumptions or purely data-driven correlations but on a long tradition of experimen-tal research in the field of psycholinguistics. Although our proposed definitions and formalizations need to be enhanced, they provide a strong foundation to conceptualize and opera-tionalize video information complexity in a theoretical sound way.
As the current paper is focused on universal aspects of human information processing, the algorithms used were based on generic text corpora and language characteristics. As such, certain course- or domain-specific aspects might have been left out. Although videos from five different courses were analyzed, the observations may be limited to online courses with a specific type of content or a particular pedagogical approach.
Dwelling time and rate
The empirical and theoretical soundness of information com-plexity measures allow us to attach meaning to dwelling time and rate and, accordingly, confirm our hypotheses. Namely, that student dwelling increases, although not to a great extent, with a low information rate. This is as expected: a lower in-formation rate can make it difficult for students to keep focus, which in turn necessitates them to re-watch parts of the video
where they lost focus. Moreover, student dwelling increases with a high information rate. This is also as expected: a higher information rate can make it difficult for students to under-stand the content, making it necessary to re-watch parts of the video.
These findings are unique in showing a fairly complex rela-tion on a large scale with data from actual student behavior. However, this also means that the data includes high variances and large extremes, an effect which is exacerbated by the use of a fit line which extends the discovered trends into the outer ranges. The variance is particularly high for dwelling time. In comparison to dwelling rate, dwelling time includes the time spend on activities other than watching the video. This will have a stronger effect of concentration difficulties and accord-ingly will show more variance. High variance is typical for complex material, as the effects of many instructional design aspects become more salient with rising complexity.
influ-ences a student’s understanding, engagement, and learning requires further research.
Towards sense-making
To a large extent, dwelling rate is predicted by the informa-tion rate. In and of itself, dwelling rate is not directly inter-pretable and as such cannot function as a proxy measure of (perceived) difficulty nor of other related constructs. That is, a high dwelling rate is typical for videos both with a low or high information rate, thus troubling any inference which does not account for information rate. For example, [32] and [10] assume that dwelling rate equals user engagement, yet we have shown that the interpretation of dwelling rate is not straight-forward. In a similar vein, earlier work has even demonstrated that interest is negatively correlated with reading time, such that engaged users will typically spend less time watching or reading and not more [31].
Our findings highlight the importance of using well-established definitions from experimental research in order to go beyond black-box predictions. This is a particular salient conclusion when compared to more ambiguous measures such as granular click-stream data [1, 2]. Any interpretation of a proxy of behavior becomes plausible once controlling for related variables - such as video complexity - that are theoreti-cally expected to explain it. To allow for sense-making, it is critical to select well-supported metrics with known theoretical relations.
Towards optimal video complexity
Two of the practical implications of the gained insights and presented computational model will be highlighted.
Video guidelines
The insights gained on the importance of information rate cast doubts on straightforward guidelines for “good videos”, such as a desired maximum length of a video. For example, the popular ‘6 minutes’ rule proposed by [10] is based on corre-lational data of dwelling time. Our contributions suggest that correlations between length and desired behavior or learning outcomes might be influenced by another factor, as the role of video length can be overshadowed by information rate. In other words, it might not be the length of a video, but the complexity that causes people to quit watching a video.
Instead of presenting guidelines on “good videos”, we provide MOOC video design teams with several key concepts to con-sider when designing educational videos. As we have shown, information rate is a substantial predictor of student watching behavior. By extension, this provides us the ability to influ-ence behavior through manipulation of the video information rate. When designing MOOC videos, attention should be paid to carefully apply these insights to reach the desired level of information complexity.
Actionable learning analytics
The algorithms and resulting computational model discussed in this paper can be used as a diagnostic tool to evaluate the complexity of videos. Although there is not yet enough evidence to make specific recommendations for making better videos, it does provide MOOC teachers with feedback on
their videos and directions for improvement. The discussed individual textual aspects of information complexity as well as the temporal aspect can be manipulated, or an ideal level can be decided on before a video is being produced. Note that more research is needed to further verify the effects of manipulating video information complexity and to establish specific guidelines.
The formalized definitions of dwelling time and information rate open possibilities for more adaptive learning environ-ments. When combined with measures of prior knowledge and learning results, these insights will help us to present users with automatically adapted videos according to their needs. In terms of actionable learning analytics, the formalized aspects of video complexity lend themselves for video selection and retrieval considerations. Based on the learning goal for a video and the desired student watching behavior, we can aim for a specific level of information complexity.
CONCLUSIONS
The information rate of a MOOC video is a substantial pre-dictor of dwelling time and rate. However, the relationship between these two variables is complex, as high dwelling is typical for videos with both high and low rates of information. This signifies the importance of information rate, and opens up the possibility of information rate to be taken into account when studying or trying to influence student video watching behavior. With our contributions we have provided a founda-tion to further expand research in this area, allowing for further sense-making and to solidify actionable learner analytics.
REFERENCES
1. Alan Baddeley. 2003. Working memory: looking back and looking forward.Nature reviews neuroscience4, 10 (2003), 829–839.
2. Rebekah Benjamin. 2012. Reconstructing Readability: Recent Developments and Recommendations in the Analysis of Text Difficulty.Educational Psychology Review24, 1 (2012), 63–88. Issue 1.
3. Derek O Bruff, Douglas H Fisher, Kathryn E McEwen, and Blaine E Smith. 2013. Wrapping a MOOC: Student perceptions of an experiment in blended learning.MERLOT Journal of Online Learning and Teaching9, 2 (2013), 187–199.
4. Marc Brysbaert, Denis Drieghe, and FranÃ˘goise Vitu. 2005.Word skipping: Implications for theories of eye movement control in reading.Oxford University Press, Chapter 6, 1–29.
5. Jeanne S. Chall and Edgar Dale. 1995.T1 - Readability Revisited: The New Dale-Chall Readability Formula. PB - Brookline Books, Cambridge, Mass.
6. Kevyn Collins-Thompson, Paul N. Bennett, Ryen W. White, Sebastian de la Chica, and David Sontag. 2011. Personalizing web search results by reading level. InProceedings of the 20th ACM International Conference on Information and Knowledge Management (CIKM ’11), Bettina Berendt, Arjen de Vries, Wenfei Fan, Craig Macdonald, Iadh Ounis, and Ian Ruthven (Eds.). ACM, New York, NY, USA, 403–412.
7. Edward Fry. 2002. Readability versus leveling.Reading Teacher56, 3 (2002), 286.
9. Paul Ginns. 2006. Integrating information: A meta-analysis of the spatial contiguity and temporal contiguity effects.Learning and Instruction16, 6 (2006), 511–525.
10. Philip J. Guo, Juho Kim, and Rob Rubin. 2014. How Video Production Affects Student Engagement: An Empirical Study of MOOC Videos. InProceedings of the First ACM Conference on Learning @ Scale Conference (L@S ’14). ACM, New York, NY, USA, 41–50.
11. Glyn Humphreys, Lindsay Evett, and David Taylor. 1982. Automatic phonological priming in visual word recognition.
Memory & Cognition10 (1982), 576–590. Issue 6.
12. Ross Ihaka and Robert Gentleman. 1996. R: A Language for Data Analysis and Graphics.Journal of Computational and Graphical Statistics5, 3 (1996), 299–314.
13. Albrecht Inhoff and Keith Rayner. 1986. Parafoveal word processing during eye fixations in reading: Effects of word frequency.Attention, Perception, & Psychophysics40, 6 (1986), 431–439. Issue 6.
14. T. Florian Jaeger and Harry Tily. 2011. On language utility: processing complexity and communicative efficiency.Wiley Interdisciplinary Reviews: Cognitive Science2, 3 (2011), 323–335.
15. M.A. Just and P.A. Carpenter. 1980. A theory of reading: From eye fixations to comprehension.Psychological Review87 (1980), 329–354.
16. Judy Kay, Peter Reimann, Elliot Diebold, and Bob Kummerfeld. 2013. MOOCs: So Many Learners, So Much Potential ...IEEE Intelligent Systems28, 3 (2013), 70–77.
17. Hanan Khalil and Martin Ebner. 2014. MOOCs Completion Rates and Possible Methods to Improve Retention - A Literature Review. InProceedings of EdMedia: World Conference on Educational Media and Technology 2014, Jarmo Viteli and Marianna Leikomaa (Eds.). Association for the Advancement of Computing in Education (AACE), Tampere, Finland, 1305–1313.
18. Juho Kim, Philip J. Guo, Daniel T. Seaton, Piotr Mitros, Krzysztof Z. Gajos, and Robert C. Miller. 2014. Understanding In-video Dropouts and Interaction Peaks Inonline Lecture Videos. In
Proceedings of the First ACM Conference on Learning @ Scale Conference (L@S ’14). ACM, New York, NY, USA, 31–40.
19. René F Kizilcec, Kathryn Papadopoulos, and Lalida Sritanyaratana. 2014. Showing face in video instruction: effects on information retention, visual attention, and affect. InProceedings of the SIGCHI Conference on Human Factors in Computing Systems. ACM, 2095–2102.
20. Vitomir Kovanovi´c, Dragan Gaševi´c, Shane Dawson, Sre´cko Joksimovi´c, Ryan S. Baker, and Marek Hatala. 2015. Penetrating the Black Box of Time-on-task Estimation. InProceedings of the Fifth International Conference on Learning Analytics And Knowledge (LAK ’15). ACM, New York, NY, USA, 184–193.
21. Kerry Ledoux, C. Christine Camblin, Tamara Y. Swaab, and Peter C. Gordon. 2006. Reading Words in Discourse: The Modulation of Lexical Priming Effects by Message-Level Context.Behavioral and Cognitive Neuroscience Reviews5, 3 (2006), 107–127.
22. Richard L. Lewis, Shravan Vasishth, and Julie A. Van Dyke. 2006. Computational principles of working memory in sentence comprehension.Trends in Cognitive Sciences10, 10 (2006), 447 – 454.
23. Nan Li, Łukasz Kidzi´nski, Patrick Jermann, and Pierre Dillenbourg. 2015. MOOC Video Interaction Patterns: What Do They Tell Us? In
Design for Teaching and Learning in a Networked World, Gránne Conole, Tomaž Klobuˇcar, Christoph Rensing, Johannes Konert, and Élise Lavoué (Eds.). Lecture Notes in Computer Science, Vol. 9307. Springer International Publishing, 197–210.
24. Bertha A. Lively and Sidney L. Pressey. 1923. A Method for Measuring the “Vocabulary Burden” of Textbooks.Educational Administration and Supervision9, 7 (1923), 389–398.
25. Anoush Margaryan, Manuela Bianco, and Allison Littlejohn. 2015. Instructional quality of Massive Open Online Courses (MOOCs).
Computers & Education80 (2015), 77 – 83.
26. Richard E Mayer and Roxana Moreno. 2003. Nine ways to reduce cognitive load in multimedia learning.Educational psychologist38, 1 (2003), 43–52.
27. Roxana Moreno and Richard E Mayer. 1999. Cognitive principles of multimedia learning: The role of modality and contiguity.Journal of educational psychology91, 2 (1999), 358.
28. Justin Reich. 2015. Rebooting MOOC Research.Science347, 6217 (2015), 34–35.
29. Erik D. Reichle, Alexander Pollatsek, Donald L. Fisher, and Keith Rayner. 1998. Toward a model of eye movement control in reading.
Psychological Review105, 1 (1998), 125–157.
30. Claude E. Shannon. 1948. A Mathematical Theory of
Communication.Bell System Technical Journal27, 7, 10 (Jul, Oct 1948), 379–423, 625–656.
31. Larry L Shirey and Ralph E Reynolds. 1988. Effect of interest on attention and learning.Journal of Educational Psychology80, 2 (1988), 159.
32. Tanmay Sinha, Patrick Jermann, Nan Li, and Pierre Dillenbourg. 2014. Your click decides your fate: Inferring Information Processing and Attrition Behavior from MOOC Video Clickstream Interactions. InEmpirical Methods in Natural Language Processing Workshop on Modeling Large Scale Social Interaction in Massively Open Online Courses. Doha, Qatar.
33. Frans Van der Sluis, Egon L. Van den Broek, Richard J. Glassey, Elisabeth M. A. G. van Dijk, and Franciska M. G. de Jong. 2014. When Complexity becomes Interesting.Journal of the American Society for Information Science and Technology65, 7 (2014), 1478–1500.
34. Tim Vor der Brück, Sven Hartrumpf, and Hermann Helbig. 2008. A Readability Checker with Supervised Learning Using Deep Indicators.Informatica32, 4 (2008), 429–435.