Relapse or reinfection: Classification of malaria infection using
transition likelihoods
Feng-Chang Lin
1Quefeng Li
1Jessica T. Lin
21Department of Biostatistics, University of North Carolina, Chapel Hill, North Carolina
2Institute of Global Health and Infectious Diseases, University of North Carolina, Chapel Hill, North Carolina
Correspondence
Feng-Chang Lin, Department of Biostatistics, University of North Carolina, Chapel Hill, NC 27599.
Email: [email protected]
Funding information
National Center for Advancing Transla-tional Sciences, Grant/Award Number: UL1TR002489; National Institute of Allergy and Infectious Diseases (NIAID), Grant/Award Number: K08AI110651
Abstract
In patients withPlasmodium vivaxmalaria treated with effective blood-stage therapy,
the recurrent illness may occur due to relapse from latent liver-stage infection or rein-fection from a new mosquito bite. Classification of the recurrent inrein-fection as either relapse or reinfection is critical when evaluating the efficacy of an anti-relapse treat-ment. Although one can use whether a shared genetic variant exists between baseline and recurrence genotypes to classify the outcome, little has been suggested to use both sharing and nonsharing variants to improve the classification accuracy. In this paper, we develop a novel classification criterion that utilizes transition likelihoods to distin-guish relapse from reinfection. When tested in extensive simulation experiments with known outcomes, our classifier has superior operating characteristics. A real data set
from 78 CambodianP. vivaxmalaria patients was analyzed to demonstrate the
prac-tical use of our proposed method.
K E Y W O R D S
allelic variant, amplicon deep sequencing, malaria relapse, penalized maximum likelihood estimation, Plas-modium vivax
1
INTRODUCTION
The classification of infections from more than one potential
cause is critical in malaria research. TakingPlasmodium
fal-ciparum, for example, the most prevalent malaria species in Sub-Saharan Africa, may recur due to relapse from treatment failure or due to reinfection from new mosquito bites. The true anti-malarial treatment efficacy cannot be determined without knowing whether the recurrent infection is due to treatment failure or new infection in an area of high malaria
transmis-sion (Kwieket al., 2007; Danielset al., 2008; Julianoet al.,
2010).Plasmodium vivax, the leading cause of malaria
out-side Africa, may similarly recur due to treatment failure or reinfection. However, in many endemic areas such as South-east Asian and Oceania, it often recurs due to relapse of hyp-nozoites reactivating from the liver, as most anti-malarials are
not active against these latent liver stages of P. vivax(Lin
et al., 2015; Becket al., 2016; Pearsonet al., 2016). Indeed,
without knowing the cause of recurrent infection, determin-ing treatment efficacy, relapse rate, and disease epidemiology is challenging.
Given the high degree of genetic diversity and polyclonal
nature ofP. vivaxinfections in many parts of the world, where
many clones (genetically distinct strains) exist within a human host, a targeted amplicon deep sequencing approach provides an opportunity for a higher precision of classification (Lin et al., 2015). As part of a malaria cohort study conducted
from 2010 to 2011 (Lon et al., 2014), patients in
Cambo-dia found to haveP. vivaxwere followed after treatment with
from reinfection based on variant overlap between the two sequencing results within individuals.
Naively, one may classify the recurrent infection as relapse if any variant in the recurrent infection is shared with the
initial infection (Nyachieoet al., 2005; Kobbeet al., 2006).
However, without considering the prevalence of the variant, false positive misclassification likely occurs if some variants
are frequently observed in the population (Juliano et al.,
2009). Kwieket al.(2007) treated the recurrent infection as
indeterminate if the initial and recurrent infections shared only one variant with a prevalence of more than 10%. However, this approach is somewhat ad hoc because the 10% prevalence cutoff may not be generally applied to other areas, and sharing only one variant may be rare in regions of high transmission where the parasite population is diverse, and a high number of variants is routinely detected in an individual (Julianoet al., 2010). Instead, Linet al.(2015) calculated the reinfection probability as the product of all reinfection proba-bilities from all shared variants and classified the recurrence as reinfection if the probability is more than 10%. Specifically, they calculated the reinfection probability based on a binomial probability model (BPM) that equals to∏𝑗{1 − (1 −𝑦𝑗)𝑥},
where 𝑦𝑗 is the prevalence of a shared variant and 𝑥 is
the number of variants observed in the recurrent infection. As one can see, the probability model considers only the possibility of shared variants occurred in the recurrence. A nonshared variant may also occur at random in the recurrent infection, regardless whether the recurrence is relapse or rein-fection. This is likely due to reactivation of latent parasites acquired from other, historical infections preceding those
captured by genotyping (Chenet al., 2007; Imwong et al.,
2007).
The presence or absence of variants in the initial and recur-rence sequencings can naturally be described by a transition model. However, the estimation of transition probabilities is complicated by an unknown mixture of two models, one from relapse and one from reinfection. Here in this paper, we pro-pose an estimation procedure that can estimate the transition probabilities under unknown causes of infections. The method is first established on a statistical model that can describe the probability of relapse in the recurrent infection. Then, through comparison of two transition likelihoods, our novel classifi-cation criterion utilizing the transition information can sig-nificantly improve a classifier that uses only initial sequenc-ing information.
The rest of the paper is organized as follows. In Section 2, we develop a statistical model for the probability of observing a recurrent infection in the follow-up period, which sums over probabilities of relapse and reinfection. A likelihood-based estimation method is utilized, with a computing solution for high-dimensional data when the number of allelic variants exceeds the number of subjects. Our novel classification cri-terion is discussed in Section 3. Simulation studies in
Sec-tion 4 for both low- and high-dimensionality scenarios show the consistency and high accuracy of our classifier. A
com-parison to the existing BPM method (Linet al., 2015) shows
the superiority of our approach. We apply our method to the P. vivaxinfection data and present part of the classification results in Section 5. Assumptions and possible generalizations of our approach are discussed in Section 6.
2
STATISTICAL MODEL
AND ESTIMATION
2.1
Notation
For subject 𝑖, let 𝑿𝑖= (𝑋𝑖1,…, 𝑋𝑖𝐽)′ and 𝒁𝑖=
(𝑍𝑖1,…, 𝑍𝑖𝐽)′denote a𝐽-dimensional vector of sequencing
outcomes in the initial and recurrent infections, respectively.
Let 𝑌𝑖 be the binary indicators with 𝑌𝑖= 1 indicating the
recurrence and 0 otherwise. In this study, we aim to classify
the recurrent infection, 𝑌𝑖 = 1, into two latent classes,
namely, relapse𝑅𝑖 = 1or reinfection𝑁𝑖= 1, assuming that
two types of infections cannot occur simultaneously. We also assume that a third possible class, treatment failure, is unlikely in the setting of highly efficacious therapy. Note
that the sequencing outcomes 𝒁𝑖 in the recurrent infection
can only be observed when 𝑌𝑖 = 1, and can be different
from 𝑿𝑖 even when the recurrent infection is relapse. If a
subject does not have a recurrent infection, that is,𝑌𝑖= 0, the
information on 𝒁𝑖 is not available. Through the paper, the
number of subjects from the baseline with initial sequencing
is denoted by 𝑛, and the number of subjects who have
recurrent infections with follow-up sequencing is denoted by
𝑚=∑𝑛𝑖=1𝑌𝑖.
2.2
Statistical model
Suppose that𝑃(𝑋𝑖𝑗= 1) =𝑝𝑗for𝑖= 1,…, 𝑛, where𝑋𝑖𝑗 = 1
indicates the presence of variant𝑗in the sequencing outcome
of subject𝑖, and𝑋𝑖𝑗 = 0otherwise. Given a realization of the initial sequencing outcome𝒙𝑖= (𝑥𝑖1,…, 𝑥𝑖𝐽)′, the indicator
for relapse, denoted by 𝑅𝑖, is assumed to follow a logistic
model
log { 𝜋
𝑖(𝜃) 1 −𝜋𝑖(𝜃)
}
=𝛼+𝒙′
𝑖𝜷, (1)
where 𝜋𝑖(𝜃) =𝑃(𝑅𝑖= 1|𝑿𝑖=𝒙𝑖), 𝜽= (𝛼,𝜷′)′, and 𝜷=
(𝛽1,…, 𝛽𝐽)′with𝛽𝑗 = 0indicating the𝑗th variant is not
asso-ciated with the relapse.
However, the relapse indicator 𝑅𝑖 cannot be observed.
What can be observed is the recurrence indicator𝑌𝑖, which
the probability of acquiring an reinfection is constant and independent of the baseline variants𝑿𝑖, that is,
𝑃(𝑁𝑖= 1|𝑅𝑖 = 0,𝑿𝑖) =𝑃(𝑁𝑖 = 1|𝑅𝑖 = 0) =𝜇,
and that both infections cannot occur simultaneously, that is,
𝑃(𝑁𝑖 = 1|𝑅𝑖 = 1,𝑿𝑖) = 0.
One can write
𝑃(𝑌𝑖= 1|𝑿𝑖)
=𝑃(𝑁𝑖= 1, 𝑅𝑖= 0|𝑿𝑖) +𝑃(𝑁𝑖 = 0, 𝑅𝑖= 1|𝑿𝑖)
=𝑃(𝑁𝑖= 1|𝑅𝑖= 0,𝑿𝑖)𝑃(𝑅𝑖= 0|𝑿𝑖)
+𝑃(𝑁𝑖= 0|𝑅𝑖= 1,𝑿𝑖)𝑃(𝑅𝑖= 1|𝑿𝑖)
=𝜇{1 −𝜋𝑖(𝜽)} +𝜋𝑖(𝜽), (2)
where 𝜋𝑖(𝜽) = exp(𝛼+𝒙𝑖′𝜷)∕{1 + exp(𝛼+𝒙′𝑖𝜷)} as defined in model (1).
Note that assuming constant infection rate is reasonable because subjects who live in the same area shall be bite by mosquitoes completely at random. The reinfection rate may depend on risk factors. If so, we may build a regression model relating the reinfection rate to those risk factors. Our approach still applies after such adjustment.
2.3
Estimation method
For the binary outcome 𝑌𝑖, one can estimate the unknown
parameters minimizing the negative log-likelihood function.
However, the reinfection probability𝜇 and baseline relapse
rate 𝛼 may not be estimable simultaneously because both
parameters are part of the baseline recurrences. To avoid such identifiability problem, we assume the reinfection rate is known or can be estimated via external information. Given
𝜇, the parameter𝜽can be estimated via minimizing the
nega-tive log-likelihood function
𝓁(𝜽) =𝑛−1
𝑛 ∑
𝑖=1
[𝑦𝑖log𝑝𝑖(𝜽) + (1 −𝑦𝑖) log{1 −𝑝𝑖(𝜽)}],
where 𝑦𝑖 is a realization of 𝑌𝑖 and𝑝𝑖(𝜽) =𝜇{1 −𝜋𝑖(𝜽)} +
𝜋𝑖(𝜽). Under regularity conditions for maximum likelihood
estimators, one can show that̂𝜽 is a consistent estimator of
𝜽and𝑛1∕2(̂𝜽−𝜽)converges in distribution to a normal vari-able with mean 0 and variance that is the inverse of Fisher information matrix.
In our data where the number of variants is larger than the number of patients, we penalize the likelihood function with
an𝐿1-penalty (Tibshirani, 1996) to enable variable selection
and avoid ill-posed minimization problem when𝐽 >𝑛. In par-ticular, we solve the following optimization problem
̂
𝜽= argmin
𝜽 −𝓁(𝜽) +𝜆
𝐽 ∑
𝑗=1
|𝛽𝑗|, (3)
where𝜆 is a tuning parameter whose optimal value will be
determined by cross-validation. There are some other choices of penalty functions, such as elastic net penalty (Zou and Hastie, 2005), adaptive Lasso (Zou, 2006), or folded-concave penalty (Fan and Lv, 2011). From numerical studies, we found that the performance of our method is not sensitive to the choice of penalty functions. The main purpose of penalization is to regulate the optimization problem with high-dimensional covariates and select baseline variants that associate with recurrence.
2.4
Computation
We develop a coordinate gradient descent algorithm (Fried-man et al., 2010) to solve the optimization problem (3). Let𝜽̃= (̃𝛼, ̃𝜷′)′be the current value of𝜽and𝜗̃𝑖 =̃𝛼+𝒙′𝑖̃𝜷. Let 𝑓(𝜗𝑖) =𝑦𝑖log𝑝(𝜗𝑖) + (1 −𝑦𝑖) log{1 −𝑝(𝜗𝑖)} with 𝜗𝑖 =
𝛼+𝒙′
𝑖𝜷, and let𝑓′(𝜗𝑖)and𝑓′′(𝜗𝑖)denote the first and
sec-ond derivatives of the function𝑓 with respect to𝜗𝑖,
respec-tively. A local quadratic approximation to −𝓁(𝜽) can be
written as
𝓁𝑄(𝜽;̃𝜽)
=𝑛−1∑𝑛
𝑖=1
{ − 1
2𝑓′′(̃𝜗𝑖)(𝜗𝑖−𝜗̃𝑖)2−𝑓′(̃𝜗𝑖)(𝜗𝑖−𝜗̃𝑖) }
+𝑐1(̃𝜽)
= (2𝑛)−1 𝑛 ∑
𝑖=1
−𝑓′′(̃𝜗𝑖) {
𝜗𝑖−̃𝜗𝑖+ 𝑓′(̃𝜗𝑖)
𝑓′′(̃𝜗
𝑖) }2
+𝑐2(̃𝜽)
= (2𝑛)−1∑𝑛
𝑖=1
̃ 𝑤𝑖(̃𝜗∗
𝑖 −𝛼−𝒙′𝑖𝜷)2+𝑐2(̃𝜽),
where ̃𝜗∗𝑖 =̃𝜗𝑖−𝑓′(̃𝜗𝑖)∕𝑓′′(̃𝜗𝑖), 𝑤̃𝑖= −𝑓′′(̃𝜗𝑖), and 𝑐1(̃𝜽) and𝑐2(̃𝜽)are functions depending only oñ𝜽. We then
min-imize𝓁𝑄(𝜽;̃𝜽) +𝜆∑𝐽𝑗=1|𝛽𝑗|, which becomes a regularized weighted least squares problem:
̃
𝜽new= argmin
𝜽 (2𝑛)
−1∑𝑛
𝑖=1
̃ 𝑤𝑖(̃𝜗∗
𝑖 −𝛼−𝒙′𝑖𝜷)2+𝜆 𝐽 ∑
𝑗=1
|𝛽𝑗|.
(4)
Such a problem can be solved by a standard coordinate
gradi-ent descgradi-ent algorithm (Friedmanet al., 2010), which is
The remaining tasks are to derive𝑓′(𝜗𝑖) and𝑓′′(𝜗𝑖). By the definition of 𝑝(𝜗𝑖), one has 𝑝′(𝜗𝑖) = (1 −𝜇)𝜋𝑖(𝜽){1 −
𝜋𝑖(𝜽)}, and 𝑝′′(𝜗𝑖) = (1 −𝜇)𝜋𝑖(𝜽){1 −𝜋𝑖(𝜽)}{1 − 2𝜋𝑖(𝜽)}. Then, one can write𝑓′(𝜗𝑖)as
𝑓′(𝜗𝑖) = 𝑦𝑖
𝑝(𝜗𝑖)𝑝′(𝜗𝑖) − 1 −𝑦𝑖
1 −𝑝(𝜗𝑖)𝑝′(𝜗𝑖)
= 𝑝′(𝜗𝑖)
𝑝(𝜗𝑖){1 −𝑝(𝜗𝑖)}{𝑦𝑖−𝑝(𝜗𝑖)}. (5)
Since
log𝑓′(𝜗
𝑖) = log𝑝′(𝜗𝑖) + log{𝑦𝑖−𝑝(𝜗𝑖)} − log𝑝(𝜗𝑖) − log{1 −𝑝(𝜗𝑖)},
taking derivatives on both sides gives
𝑓′′(𝜗
𝑖)
𝑓′(𝜗
𝑖) = 𝜕
𝜕𝜗𝑖 log𝑓′(𝜗𝑖) = 𝑝′′(𝜗
𝑖)
𝑝′(𝜗
𝑖)
− {
1
𝑦𝑖−𝑝(𝜗𝑖)+ 1𝑝(𝜗𝑖)− 1 1 −𝑝(𝜗𝑖)
}
𝑝′(𝜗
𝑖). (6)
Straightforwardly, the product of (5) and (6) gives𝑓′′(𝜗𝑖). We summarize the algorithm as follows:
Step 1: Initialize𝜽at̃𝜽= (̃𝛼, ̃𝜷′)′. Step 2: Solve
̃
𝜽new = argmin
𝜽 (2𝑛)
−1 ∑
𝑖∶𝑤̃𝑖>0
̃
𝑤𝑖(̃𝜗∗𝑖 −𝛼−𝒙′𝑖𝜷)2
+𝜆
𝐽 ∑
𝑗=1
|𝛽𝑗|,
where ̃𝜗∗𝑖 =̃𝜗𝑖−𝑓′(̃𝜗𝑖)∕𝑓′′(̃𝜗𝑖), ̃𝜗𝑖=̃𝛼+𝒙′𝑖𝜷̃, and
̃
𝑤𝑖= −𝑓′′(̃𝜗
𝑖).
Step 3: Update 𝜗̃𝑖, ̃𝜗∗𝑖, and 𝑤̃𝑖 by letting ̃𝜗new𝑖 =̃𝛼new+ 𝒙′
𝑖̃𝜷 new
, ̃𝜗∗𝑖new= ̃𝜗new𝑖 −𝑓′(̃𝜗new𝑖 )∕𝑓′′(̃𝜗new𝑖 ), and
̃ 𝑤new
𝑖 = −𝑓′′(̃𝜗new𝑖 ).
Step 4: Iterate between steps 2 and 3 until convergence, that is, the𝐿2-norm||̃𝜽
new
−̃𝜽||2≤𝜖, where𝜖is a
user-defined stopping threshold. We choose𝜖= 0.001.
Remark that, when 𝜇>0, the function −𝑓(𝜗𝑖) is not a convex function. Therefore, solving our proposed target func-tion (3) is a challenging nonconvex optimizafunc-tion problem. To ensure stable computation of the gradient descent algorithm,
we drop negative weight𝑤̃𝑖 when solving the intermediate
weighted least squares function (4) in Step 2 above. Similar to other nonconvex optimization problems, the gradient descent algorithm converges to a local minimum of the objective func-tion. In the simulation studies, we find that such local minima
admit good variable selection and classification performance; see Section 4.
3
CLASSIFICATION
We aim to classify recurrent infection (𝑌𝑖= 1) to either
relapse (𝑅𝑖 = 1) or reinfection (𝑁𝑖 = 1). Two classifiers are studied. The first one utilizes the initial sequencing informa-tion and logistic regression model (1) to calculate the initial probability estimation of the recurrence being relapse. The second one updates the initial probability estimation using transition likelihoods under relapse and reinfection. Through comparison between two transition likelihoods, the second classifier is anticipated to perform better than the first one because more information is used.
3.1
Based on baseline information
Let 𝜉𝑖 denote the probability of being relapse given that a
recurrent infection has occurred. One can show that, based on the recurrence probability in formula (2),
𝜉𝑖(0)=𝑃(𝑅𝑖= 1|𝑌𝑖= 1,𝑿𝑖)
=𝑃(𝑁𝑖 = 0|𝑅𝑖 = 1,𝑿𝑖)𝑃(𝑅𝑖= 1|𝑿𝑖)
𝑃(𝑌𝑖 = 1|𝑿𝑖)
= 𝜋𝑖(𝜽)
𝜇{1 −𝜋𝑖(𝜽)} +𝜋𝑖(𝜽),
which can be estimated by
̂𝜉(0)
𝑖 =
𝜋𝑖(̂𝜽)
𝜇{1 −𝜋𝑖(̂𝜽)} +𝜋𝑖(̂𝜽).
This estimator gives a possible classification criterion via ranking ̂𝜉𝑖(0). Acknowledging the interpretation of probabil-ity, one may claim the recurrent case is(100 ×̂𝜉𝑖(0))-percent likely to be relapse. However, one may ask for a clear cut to identify the relapse. Barring this in mind, one can classify a recurrent infection to be relapse if ̂𝜉(0)𝑖 >0.5, which means
𝜋𝑖(̂𝜽)>𝜇{1 −𝜋𝑖(̂𝜽)}or equivalently,𝑃(𝑁𝑖 = 0, 𝑅𝑖= 1|𝑌𝑖=
1,𝑿𝑖)>𝑃(𝑁𝑖= 1, 𝑅𝑖 = 0|𝑌𝑖 = 1,𝑿𝑖). The cutoff could be chosen to optimize the operating characteristics if the true infection type is available. Without the gold standard in this study, we simply use 0.5 as the cutoff to choose the winner.
3.2
Updated by transition likelihoods
sequencing. Recall that𝒁𝑖= (𝑍𝑖1,…, 𝑍𝑖𝐽)′is a random vari-able for the recurrence sequencing outcomes. Assuming the recurrent infection is a relapse, one can write𝑍𝑖𝑗as
𝑍𝑖𝑗=𝑋𝑖𝑗𝛿𝑖𝑗+ (1 −𝑋𝑖𝑗)(1 −𝛿∗
𝑖𝑗),
where 𝛿𝑖𝑗 and 𝛿∗𝑖𝑗 are two binary indicators that represent
repeated presence and absence of variant 𝑗 in the
recur-rence sequencing, with probability𝑞𝑗 =𝑃(𝛿𝑖𝑗= 1)and𝑞∗𝑗 =
𝑃(𝛿∗
𝑖𝑗= 1), respectively. Specifically, we assume that
vari-ant𝑗 has probability𝑞𝑗 =𝑃(𝑍𝑖𝑗= 1|𝑋𝑖𝑗= 1, 𝑅𝑖 = 1)to be observed again in the recurrence sequencing if the variant is observed in the initial sequencing, while the variant has proba-bility𝑞𝑗∗=𝑃(𝑍𝑖𝑗= 0|𝑋𝑖𝑗 = 0, 𝑅𝑖= 1)to remain unobserved in the recurrence sequencing if the variant is absent at the baseline. This mechanism can be considered as a transition model from the baseline sequencing to the follow-up sequenc-ing outcomes, where𝑞𝑗 and𝑞𝑗∗are transition probabilities in a two-state transition model. If the recurrence is indeed a new infection, we assume𝒁𝑖is independent of𝑿𝑖, and follows the same distribution as𝑿𝑖.
When 𝑿𝑖 and 𝒁𝑖 are observed, parameters 𝑝𝑗, 𝑞𝑗, and
𝑞∗
𝑗,𝑗= 1,…, 𝐽, can be estimated as follows. The
probabil-ity𝑝𝑗can be consistently estimated by the sample mean̂𝑝𝑗 =
𝑛−1∑𝑛
𝑖=1𝑥𝑖𝑗, where𝑥𝑖𝑗is a realization of𝑋𝑖𝑗. Different from
the baseline variants, the distribution of𝑍𝑖𝑗 is a mixture of
two distributions, depending on whether the recurrent case is relapse or reinfection. Assuming the variants are mutually independent, we have
𝑃(𝑍𝑖𝑗 = 1|𝑅𝑖 = 1, 𝑌𝑖= 1,𝑿𝑖 =𝒙𝑖)
=𝑥𝑖𝑗𝑞𝑗 + (1 −𝑥𝑖𝑗)(1 −𝑞𝑗∗) =𝜂(𝑥𝑖𝑗),
𝑃(𝒁𝑖 =𝒛𝑖|𝑅𝑖 = 1, 𝑌𝑖= 1,𝑿𝑖=𝒙𝑖)
=∏𝐽 𝑗=1
𝜂(𝑥𝑖𝑗)𝑧𝑖𝑗{1 −𝜂(𝑥𝑖𝑗)}1−𝑧𝑖𝑗,
and
𝑃(𝒁𝑖 =𝒛𝑖|𝑅𝑖 = 0, 𝑌𝑖= 1,𝑿𝑖 =𝒙𝑖) =∏𝐽 𝑗=1
𝑝𝑧𝑖𝑗
𝑗 (1 −𝑝𝑗)1−𝑧𝑖𝑗.
Let𝜙𝑅𝑖 (𝑞, 𝑞∗) =𝑃(𝒁𝑖=𝒛𝑖|𝑅𝑖 = 1, 𝑌𝑖= 1,𝑿𝑖 =𝒙𝑖), where
𝑞= (𝑞1,…, 𝑞𝐽)′ and 𝑞∗= (𝑞∗1,…, 𝑞∗𝐽)′, and let 𝜙𝑁𝑖 (𝑝) =
𝑃(𝒁𝑖=𝒛𝑖|𝑅𝑖= 0, 𝑌𝑖 = 1,𝑿𝑖=𝒙𝑖), where𝑝= (𝑝1,…, 𝑝𝐽)′.
The mixture distribution of𝒁𝑖can be written as
𝑃(𝒁𝑖 =𝒛𝑖|𝑌𝑖 = 1,𝑿𝑖=𝒙𝑖)
=
1
∑
𝑟=0
𝑃(𝒁𝑖=𝒛𝑖, 𝑅𝑖=𝑟|𝑌𝑖= 1,𝑿𝑖=𝒙𝑖)
=
1
∑
𝑟=0
𝑃(𝒁𝑖 =𝒛𝑖|𝑅𝑖 =𝑟, 𝑌𝑖 = 1,𝑿𝑖=𝒙𝑖)
×𝑃(𝑅𝑖=𝑟|𝑌𝑖 = 1,𝑿𝑖=𝒙𝑖)
=𝜙𝑁
𝑖 (𝑝)(1 −𝜉(0)𝑖 ) +𝜙𝑅𝑖 (𝑞, 𝑞∗)𝜉𝑖(0).
To obtain the maximum likelihood estimators for𝑞and𝑞∗, we
maximize the profiled log-likelihood function
𝓁(𝑞, 𝑞∗) =∑𝑚
𝑖=1
log{𝜙𝑁
𝑖 (̂𝑝)(1 −̂𝜉(0)𝑖 ) +𝜙𝑖𝑅(𝑞, 𝑞∗)̂𝜉𝑖(0)}, (7)
where 𝜙𝑁𝑖 (̂𝑝) =∏𝐽𝑗=1̂𝑝𝑗𝑧𝑖𝑗(1 −̂𝑝𝑗)1−𝑧𝑖𝑗, and ̂𝜉(0)
𝑖 is the
esti-mated probability of relapse based on the baseline sequenc-ing information.
Based on the transition model for the follow-up sequenc-ing outcomes, one can derive the probability of relapse given
the follow-up sequencing realization𝒁𝑖=𝒛𝑖. One can show
that,
𝜉(1)𝑖 =𝑃(𝑅𝑖= 1|𝑌𝑖= 1,𝑿𝑖 =𝒙𝑖,𝒁𝑖 =𝒛𝑖)
=
𝑃(𝒁𝑖 =𝒛𝑖|𝑅𝑖 = 1, 𝑌𝑖= 1,𝑿𝑖 =𝒙𝑖) ×𝑃(𝑅𝑖= 1|𝑌𝑖= 1,𝑿𝑖 =𝒙𝑖) ∑1
𝑟=0𝑃(𝒁𝑖=𝒛𝑖|𝑅𝑖 =𝑟, 𝑌𝑖 = 1,𝑿𝑖=𝒙𝑖) ×𝑃(𝑅𝑖 =𝑟|𝑌𝑖= 1,𝑿𝑖 =𝒙𝑖)
= 𝜙𝑅𝑖 (𝑞, 𝑞
∗)𝜉(0)
𝑖
𝜙𝑁
𝑖 (𝑝)(1 −𝜉𝑖(0)) +𝜙𝑅𝑖 (𝑞, 𝑞∗)𝜉(0)𝑖
,
which can be consistently estimated by
̂𝜉(1)
𝑖 =
𝜙𝑅
𝑖 (̂𝑞, ̂𝑞∗)̂𝜉𝑖(0)
𝜙𝑁
𝑖 (̂𝑝)(1 −̂𝜉𝑖(0)) +𝜙𝑅𝑖 (̂𝑞, ̂𝑞∗)̂𝜉𝑖(0)
,
where
𝜙𝑅𝑖 (̂𝑞, ̂𝑞∗) = 𝐽 ∏
𝑗=1
̂𝜂(𝑥𝑖𝑗)𝑧𝑖𝑗{1 −̂𝜂(𝑥𝑖𝑗)}1−𝑧𝑖𝑗,
and
̂𝜂(𝑥𝑖𝑗) =𝑥𝑖𝑗̂𝑞𝑗+ (1 −𝑥𝑖𝑗)(1 −̂𝑞∗
𝑗),
where ̂𝑞𝑗 and̂𝑞∗𝑗 are maximum likelihood estimators solving
(7).
The estimator provides another classifier as one may claim the recurrent case is(100 ×̂𝜉𝑖(1))-percent likely to be relapse and classify the recurrence as relapse if ̂𝜉𝑖(1)>0.5. In fact,
̂𝜉(1)
𝑖 can be considered as the probability that updateŝ𝜉𝑖(0)by a
specifically, the estimated odds of relapse given the follow-up information can be written as
̂
Odds(1)𝑖 = ̂𝜉
(1)
𝑖 1 −̂𝜉𝑖(1) =
𝜙𝑅
𝑖 (̂𝑞, ̂𝑞∗)̂𝜉(0)𝑖
𝜙𝑁
𝑖 (̂𝑝)(1 −̂𝜉𝑖(0))
= 𝜙𝑅𝑖 (̂𝑞, ̂𝑞
∗)
𝜙𝑁 𝑖 (̂𝑝)
̂
Odds(0)𝑖 ,
which updates the estimated odds from the baseline informa-tion by multiplying the ratio of two transiinforma-tion likelihoods. If
𝜙𝑅
𝑖 (̂𝑞, ̂𝑞∗)>𝜙𝑁𝑖 (̂𝑝), the realization of𝒁𝑖 more likely came
from relapse. Hence, the odds of the recurrent infection being relapse would increase from the one that uses only base-line information.
Note that as𝒁𝑖is only available from𝑚subjects who have
recurrent infections, the parameters𝑞and𝑞∗cannot be solved
by the likelihood function (7) when the combined dimensions
of𝑞and𝑞∗is larger than the number of subjects𝑚. To avoid
this, we assume the transition probabilities are the same for each variant, that is,𝑞1=𝑞2=⋯=𝑞𝐽 and𝑞1∗=𝑞∗2=⋯=
𝑞∗
𝐽, such that there are only two scalar parameters𝑞and𝑞∗in
(7). A possible generalization that relaxes this assumption is discussed in Section 6.
4
SIMULATION EXPERIMENTS
In this section, we demonstrate our method via simulation
experiments with various combinations of reinfection rate𝜇,
sample size𝑛, and number of variants 𝐽. First, we explore
a low-dimension setting when there are only 10 variants in
both sequencings. The baseline sequencing outcomes 𝑋𝑖𝑗,
𝑗= 1,…,10, are assumed to follow a Bernoulli distribution
with success probability 𝑝𝑗 = 0.5 exp{−(𝑗− 1)∕10}, which
mimics the distribution of variants in our real data. Two transi-tion probabilities,𝑞𝑗and̃𝑞𝑗, are set to be 0.95. The probability of acquiring a new infection is set to be𝜇= 0.05,0.12,0.25, from low to high reinfection rates. We explore two scenarios under which the association between the presence of the vari-ant and relapse is different. In the first scenario, we assume that the relapse is associated with three most prevalent vari-ants 𝑋𝑖1, 𝑋𝑖2, 𝑋𝑖3. In the second scenario, we assume the
relapse is associated with three rarest variants𝑋𝑖8, 𝑋𝑖9, 𝑋𝑖10.
In each scenario, we set the intercept𝛼= −2 in the relapse
model (1) and coefficients𝛽𝑗= 0.405if the variant𝑗is
asso-ciated with the relapse and𝛽𝑗 = 0otherwise. The sample size
is set to be𝑛= 100,200,400,800. We simulate 1000
repeti-tions for each combination of𝜇and𝑛 in each scenario. We
report the bias of the coefficient estimates to demonstrate the consistency of our proposed estimator for the regression coefficients. We also report operating characteristics such as sensitivity (sens), specificity (spec), and overall accuracy (acc) of the classifiers 𝐼(̂𝜉(0)>0.5) and 𝐼(̂𝜉(1)>0.5). We
also compare our method to the BPM used in Lin et al.
(2015).
T A B L E 1 Bias of regression coefficient estimation under scenario 1
𝝁 𝒏 𝜷𝟏 𝜷𝟐 𝜷𝟑 𝜷𝟒 𝜷𝟓
0.05 100 1.129 1.243 1.181 −0.142 −0.276
200 0.114 0.044 0.093 −0.048 −0.081
400 0.026 0.014 0.041 −0.003 0.012
800 0.012 0.005 0.021 −0.004 0.007
0.12 100 3.899 3.774 3.837 −3.748 −0.519
200 0.742 0.379 0.424 −0.050 −0.341
400 0.028 0.030 0.045 −0.004 −0.010
800 0.008 0.005 0.030 −0.014 0.001
0.25 100 5.816 4.482 4.579 −0.814 −2.132
200 3.066 2.573 2.478 −0.985 −0.544
400 0.271 0.092 0.079 0.120 −0.039
800 0.014 0.028 0.029 0.001 0.007
𝝁 𝒏 𝜷𝟔 𝜷𝟕 𝜷𝟖 𝜷𝟗 𝜷𝟏𝟎
0.05 100 −0.756 −1.409 −1.295 −0.863 −0.754
200 −0.089 −0.135 −0.197 −0.135 −0.153
400 −0.022 −0.032 −0.028 −0.026 −0.043
800 −0.003 −0.015 −0.012 −0.010 −0.023
0.12 100 −3.657 −1.947 −1.914 −1.718 −5.552
200 −0.860 −0.973 −0.214 −2.913 −0.650
400 −0.049 −0.053 0.004 −0.015 −0.062
800 −0.018 −0.023 0.001 −0.001 −0.013
0.25 100 −4.738 −4.455 −3.278 −5.488 −4.870
200 −1.155 −2.339 −3.635 −2.956 −1.537
400 −0.143 −0.263 −0.225 −0.612 −0.210
800 −0.016 −0.010 −0.072 −0.037 −0.020
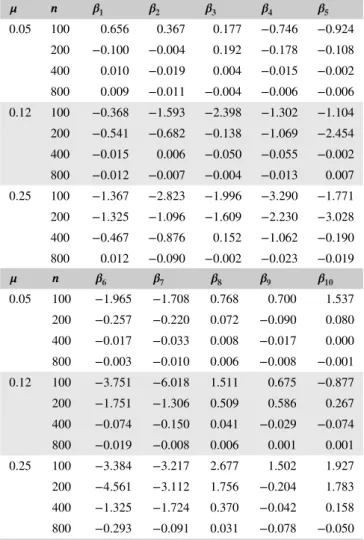
Tables 1 and 2 show the simulation results under the sce-narios 1 and 2, respectively. One can see that our estimator
is consistent. When the sample size𝑛increases, the bias
con-verges toward 0. It is worth noting that our estimator performs equally well in those two scenarios when either common or rare variants are associated with the relapse. Table 3 shows the operating characteristics of three classifiers under differ-ent reinfection rates. One can see that using𝐼(̂𝜉(0)>0.5)as the classifier can be overly aggressive under a low reinfec-tion rate. Most of the recurrences are claimed as relapse and result in high sensitivity but low specificity, especially when the sample size is large. On the other hand, using𝐼(̂𝜉(1)>0.5) as the classifier performs well, reaching a high degree of accu-racy in both sensitivity and specificity. The reinfection rate is a significant factor for the classification accuracy of our classi-fiers. Under a high reinfection rate, the overall accuracy of the classifier 𝐼(̂𝜉(0)>0.5) is low. Correctly classifying relapse becomes more difficult for the classifier usinĝ𝜉(0). The same problem occurs to𝐼(̂𝜉(1)>0.5)when the sample size is small. However, when the sample size increases, the accuracy of
T A B L E 2 Bias of regression coefficient estimation under scenario 2
𝝁 𝒏 𝜷𝟏 𝜷𝟐 𝜷𝟑 𝜷𝟒 𝜷𝟓
0.05 100 0.656 0.367 0.177 −0.746 −0.924
200 −0.100 −0.004 0.192 −0.178 −0.108
400 0.010 −0.019 0.004 −0.015 −0.002
800 0.009 −0.011 −0.004 −0.006 −0.006
0.12 100 −0.368 −1.593 −2.398 −1.302 −1.104
200 −0.541 −0.682 −0.138 −1.069 −2.454
400 −0.015 0.006 −0.050 −0.055 −0.002
800 −0.012 −0.007 −0.004 −0.013 0.007
0.25 100 −1.367 −2.823 −1.996 −3.290 −1.771
200 −1.325 −1.096 −1.609 −2.230 −3.028
400 −0.467 −0.876 0.152 −1.062 −0.190
800 0.012 −0.090 −0.002 −0.023 −0.019
𝝁 𝒏 𝜷𝟔 𝜷𝟕 𝜷𝟖 𝜷𝟗 𝜷𝟏𝟎
0.05 100 −1.965 −1.708 0.768 0.700 1.537
200 −0.257 −0.220 0.072 −0.090 0.080
400 −0.017 −0.033 0.008 −0.017 0.000
800 −0.003 −0.010 0.006 −0.008 −0.001
0.12 100 −3.751 −6.018 1.511 0.675 −0.877
200 −1.751 −1.306 0.509 0.586 0.267
400 −0.074 −0.150 0.041 −0.029 −0.074
800 −0.019 −0.008 0.006 0.001 0.001
0.25 100 −3.384 −3.217 2.677 1.502 1.927
200 −4.561 −3.112 1.756 −0.204 1.783
400 −1.325 −1.724 0.370 −0.042 0.158
800 −0.293 −0.091 0.031 −0.078 −0.050
common or rare variants scenario. In comparison to the BPM
method (Linet al., 2015), one can see that the BPM’s
perfor-mance remains unchanged under different reinfection rates. The method generally performs better than our classifier when the sample size is small. However, when the sample size is large or when the reinfection rate is low, our classifier per-forms much better than the BPM method. Note that the cutoff probability used in the BPM can be arbitrary and may depend on the prevalence of the shared variant, which is unknown in practice. It is not clear how to select the best cutoff for their
method. We used 10% as suggested in Linet al.(2015).
In addition, we performed a simulation study when the number of variants exceeds the sample size. We simulate base-line and follow-up sequencing outcomes from the same dis-tribution as in the low-dimensional case. We consider two combinations of𝑛and𝐽 for(𝑛, 𝐽) = (100,200)and(𝑛, 𝐽) =
(200,400)and three reinfection rates for𝜇= 0.05,0.12,0.25. We also consider two scenarios of how the variants associate with relapse. In scenario 3, the relapse is associated with five
most prevalent variants through model (1), where𝛼= −1and
𝜷= (0.2,0.2,0.2,0.2,0.2,0,…,0)′. In scenario 4, the relapse
is associated with five relatively rare variants, where𝛼= −1
and𝜷 = (0,…,0,0.2,0.2,0.2,0.2,0.2,0,…,0)′ with the 10 most prevalent variants not associated with relapse. Aver-age sensitivity (sens), specificity (spec), and overall accuracy (acc) of the two classifiers are reported in Table 4 for each scenario. We also report average bias (Bias), which is defined by(1∕𝐽)∑𝐽𝑗=1|𝛽̂𝑗−𝛽𝑗|, number of true positives (TP), and number of true negatives (TN) to evaluate the variable selec-tion performance of our method.
Table 4 shows that our method still works well when𝐽 is
much larger than𝑛. The performance of the classifier𝐼(̂𝜉𝑖(1)>
0.5) is much better than that of the classifier 𝐼(̂𝜉𝑖(0)>0.5). When the reinfection rate is relatively high, both classifiers suffer lower accuracy under this more difficult situation. The performance of the classifier𝐼(̂𝜉𝑖(1)>0.5), however, remains acceptable. Moreover, our method identifies most of the vari-ants that are associated with the relapse, that is, its TP propor-tion is high, regardless of whether they are prevalent or rare, while controlling the selection of true negatives at a satisfac-tory level.
5
REAL DATA ANALYSIS
Given the high degree of genetic diversity and polyclonal
nature of P. vivax infections in Cambodia, many clones
or strains exist within a human host. A targeted amplicon deep sequencing approach was chosen to genotype initial
and recurrent isolates from P. vivax patients enrolled in a
malaria cohort and treatment study conducted in northern
Cambodia from 2010 to 2011 (Lonet al., 2014; Lin et al.,
2015). Subjects found to haveP. vivaxmalaria were treated
with dihydroartemisinin-piperaquine (DP), then followed for recurrence with weekly blood smears for six weeks and with
a monthly blood smear after that. Of 78P. vivax-infected
sub-jects followed for a median of 115 days, 23 individuals, or approximately one third of the cohort, developed a recurrent infection. These recurrences likely represent relapse or rein-fection, because treatment failure with DP is unlikely. Dur-ing the follow-up, six subjects suffered second recurrences, and one subject suffered a third recurrent infection. Hence, a total of 30 recurrent infections were available for the follow-up genotype analysis. In combination with 78 subjects at the baseline, there are 108 isolates available for the genotype anal-ysis. To avoid the bias due to length of follow-up, we only use
78 baseline sequencings (𝑛= 78) to estimate the parameters
in relapse model (1), with 23 positive responses (∑𝑛𝑖=1𝑌𝑖 =
23). However, in order to utilize as much information as
pos-sible, we include those 7 second or third recurrences in the estimation of transition probabilities𝑞and𝑞∗, using their most recent sequencing as the baseline sequencing. This results in 30 pairs of baseline and recurrence sequencings in the
T A B L E 3 Operating characteristics of proposed classifiers under low-dimensional scenarios BPM 𝑰(̂𝝃(𝟎)
𝒊 >𝟎.𝟓) 𝑰(̂𝝃𝒊(𝟏)>𝟎.𝟓)
Scenario 𝝁 𝒏 sens spec acc sens spec acc sens spec acc
1 0.05 100 89.1 83.3 88.2 89.6 12.0 76.5 93.2 82.4 91.2
200 89.2 83.7 88.3 97.0 3.8 81.8 98.4 87.2 96.5
400 89.3 84.2 88.5 99.5 0.7 83.4 98.8 87.8 97.0
800 89.4 84.0 88.5 100.0 0.0 83.7 98.9 88.3 97.2
0.12 100 88.9 84.4 87.5 64.7 38.2 56.1 73.0 79.5 75.0
200 89.1 84.2 87.5 78.4 25.3 60.9 93.2 91.2 92.5
400 89.2 84.2 87.6 87.0 16.8 63.9 97.4 92.0 95.6
800 89.3 84.1 87.6 92.2 11.5 65.7 97.6 92.3 95.9
0.25 100 89.1 84.4 86.7 44.3 58.5 51.6 50.8 72.8 61.9
200 89.4 84.3 86.8 46.1 57.6 52.0 71.1 90.1 80.8
400 89.3 84.4 86.9 50.9 55.1 53.1 92.0 94.4 93.2
800 89.4 84.3 86.8 53.0 55.3 54.2 95.7 94.7 95.2
2 0.05 100 89.2 85.1 88.3 81.4 19.8 68.5 85.8 79.5 84.3
200 89.3 84.9 88.4 92.3 8.3 74.9 96.7 88.4 94.9
400 89.4 84.5 88.4 98.2 2.0 78.5 98.4 88.8 96.4
800 89.5 84.2 88.5 99.8 0.2 79.3 98.5 89.5 96.6
0.12 100 89.1 84.5 87.2 55.3 48.0 52.4 61.9 74.4 66.6
200 89.2 83.9 87.1 63.3 39.3 53.7 83.9 90.0 86.3
400 89.5 83.9 87.3 73.8 29.7 56.4 96.2 93.0 94.9
800 89.6 84.0 87.4 80.2 23.6 57.8 97.0 93.4 95.6
0.25 100 89.3 84.1 86.3 41.1 62.5 53.6 44.6 70.5 59.5
200 89.6 84.1 86.4 35.6 67.5 54.1 54.7 87.3 73.6
400 89.8 84.2 86.5 35.9 67.7 54.3 80.8 94.6 88.7
800 89.7 84.2 86.5 33.7 71.7 55.6 94.0 95.5 94.9
T A B L E 4 Average bias of coefficient estimation, variable selection, and operating characteristics of our proposed classifier under high-dimensional scenarios
Scenario 3 𝑰(̂𝝃(𝟎)
𝒊 >𝟎.𝟓) 𝑰(̂𝝃𝒊(𝟏)>𝟎.𝟓)
𝝁 (𝒏, 𝑱) Bias TP TN sens spec acc sens spec acc
0.05 (100,200) 0.11 5 146 100 0 92.0 100 80.6 98.3
(200,400) 0.03 4 332 100 0 92.2 99.0 97.0 98.8
0.12 (100,200) 0.07 5 157 99.0 1.3 82.3 100 69.1 94.6
(200,400) 0.02 5 353 99.8 0.1 83.2 99.0 85.1 96.7
0.25 (100,200) 0.09 5 156 89.1 11.9 65.9 100 75.2 92.6
(200,400) 0.04 5 351 82.4 17.5 63.7 89.9 85.8 88.9
Scenario 4 𝑰(̂𝝃(𝟎)
𝒊 >𝟎.𝟓) 𝑰(̂𝝃𝒊(𝟏)>𝟎.𝟓)
𝝁 (𝒏, 𝑱) Bias TP TN sens spec acc sens spec acc
0.05 (100,200) 0.01 5 194 100 0 91.9 100 50 95.2
(200,400) 0.01 5 395 100 0 93.6 100 80 98.2
0.12 (100,200) 0.07 5 157 90.9 0 76.9 97.6 57.1 91.1
(200,400) 0.02 5 354 97.4 0 83.5 97.7 88.9 96.7
0.25 (100,200) 0.05 5 174 70.5 27.5 59.2 86.7 74.3 80.9
Targeted deep sequencing was performed on DNA extracted from filter paper blood spots collected by finger prick. A nested polymerase chain reaction (PCR) assay was used to amplify a 117-base pair variable portion of theP. vivax merozoite surface protein 1 (pvmsp1) gene based on previ-ous work showing great nucleotide diversity across this region
(Parobeket al., 2014). Samples were amplified in duplicate
and individually tagged, then pooled and sequenced on the
Ion Torrent platform from Life Technologies. The Pvmsp1
sequence variants were determined by SeekDeep, a bioin-formatics pipeline that uses a clustering method to construct the most likely haplotypes within a patient while removing false haplotypes due to PCR or sequencing error (Hathaway et al., 2018). For each subject,pvmsp1haplotypes that were
present in two independent duplicate PCR samples at≤0.5%
frequency were counted as unique variants. Consensus hap-lotypes were each assigned a unique population identifier based on their prevalence in the cohort, namely, CAM.00 to
CAM.66 with CAM.00 being the most prevalentpvsmp1
vari-ant encountered. In total, 67 unique pvmsp1 variants were
detected across 108 isolates. Nine common variants appeared in at least 10% of individuals, while two-thirds of variants appeared in only one isolate. In-host genetic diversity was also high, as 90% of initial infections contained multiple variants, displaying an average of 3.6 co-circulating variants.
We used the penalized likelihood model with an 𝐿1
-penalty, as shown in (3), with 5% reinfection rate. We report variants in the initial and recurrence sequencing, their esti-mated coefficients𝜷̂in model (1), prevalence of the variants, two classification probability estimates, and classification
results based on ̂𝜉𝑖(1) and BPM method. Variants with a
nonzero estimated coefficient are considered to be associated with relapse. Using the profiled likelihood function (7), the maximum likelihood estimates for the transition probability arê𝑞= 0.387and̂𝑞∗= 0.987.
Table 5 shows part of the classification results. A com-plete list of the classification results is shown in the Sup-porting Information. First, one can see that the recurrence is likely classified as reinfection if variants in the recurrence are prevalent and not observed in the initial sequencing. Taking
151→151R pair, for example, the nonsharing variant CAM.00
that appeared in the recurrence sequencing is the most preva-lent variant in the sample, suggesting that the recurrence is likely reinfection. Second, the high transition probability
̂𝑞∗= 0.987 suggests that an unobserved variant in the
ini-tial sequencing likely remains unobserved in the recurrence sequencing if the recurrence is a relapse. This explains why
152→152R pair is classified as reinfection. The appearance
of prevalent variants CAM.05 and CAM.07 in the recurrence sequencing significantly lowers the classification probability from𝜉𝑖(0)to𝜉𝑖(1).
Some recurrence pairs tend to have more diverse and abun-dant minority variants. Many variants tend to be
nonshar-ing due to this abundance. For example, both 80→80R pair
and 125→125R pair have multiple variants in the recurrence
sequencing that did not appear in the initial sequencing, result-ing in a low value of𝜉𝑖(1)and reinfection as the classification result. It is worth noting that, nonsharing variants in the ini-tial sequencing have little impact on𝜉(1)𝑖 . Taking 36→36R, for example, the pair is still classified as relapse even when seven initial variants were not observed in the recurrence sequenc-ing. The classification probability𝜉𝑖(1)only slightly decreases
from𝜉(0)𝑖 . This tendency can be explained by a low value of
transition probability estimatê𝑞= 0.387. If̂𝑞is small, it is not unusual to see a variant in the initial sequencing not observed in the recurrence sequencing if the infection is a relapse pair
like 36→36R. In contrast, even though the 80R→80RR pair
has five sharing variants in the initial sequencing, the clas-sification probability 𝜉𝑖(1) decreases significantly from 𝜉𝑖(0) because one nonsharing variant in the recurrence sequencing, CAM.04, is prevalent.
When comparing our method to the BPM, disparity occurs when prevalent variants appeared only in the
recur-rence sequencing. As discussed earlier, the 152→152R and
80R→80RR pairs are classified as reinfection by our method
because nonsharing variants appeared in recurrence sequenc-ing are prevalent. The BPM method classifies them as relapse because more than one prevalent variant overlapped in both
sequencings, such as CAM.00 and CAM.01 in the 152→152R
pair, and CAM.00, CAM.02, and CAM.06 in the 80R→80RR
pair. Contrarily, the BPM method likely classifies a recurrent infection to reinfection if there is only one sharing variant
that is prevalent, such as CAM.00 in the 96→96R pair. Our
method otherwise classifies the pair as relapse because there are not enough nonsharing variants appeared in the recur-rence sequencing. In summary, the classification result of
80→80R pair demonstrates the flaw of BPM. When
multi-ple prevalent nonsharing variants (such as CAM.01, CAM.02, and CAM.03) appears in the recurrence, it is more likely the recurrence is reinfection, not relapse. A method like BPM considering only shared variants ignores this possibility and likely misclassifies the case.
Note that, from a statistical point of view, the analysis is sensitive to the selection of background reinfection rate. If the reinfection rate is misidentified, the maximum likelihood esti-mator of the coefficients in model (1) may not be consistent, as well as the classification probabilitŷ𝜉(0)𝑖 calculated from these estimators. The classification probabilitŷ𝜉(1)𝑖 may not be con-sistent as well because it is established on the initial classifi-cation probabilitŷ𝜉(0)𝑖 . In this data analysis, the classification result based on̂𝜉𝑖(1)is quite robust when the reinfection rates is less than 10%. Meanwhile, an in vivo study on the dynamics of P. vivaxinfection suggests that up to 96% of theP. vivax infec-tion is due to relapse in individuals living in the endemic areas
T A B L E 5 Classification results for recurrence pairs using our method and binomial probability model
Initial Recurrence Variant Proposed BPM
Recurrence Pair Variants 𝜷̂ ̂𝝃(𝟎)
𝒊 Variants Prevalence ̂𝝃𝒊(𝟏) Class Class
36→36R CAM.00 1.833 0.960 CAM.01 0.269 0.870 Relapse Relapse
CAM.01 0.469 CAM.02 0.410
CAM.02 0.892 CAM.07 0.192
CAM.03 0 CAM.17 0.064
CAM.04 3.519
CAM.05 −1.085
CAM.06 −1.416
CAM.07 1.750
CAM.09 0
CAM.11 0
80→80R CAM.00 1.833 0.992 CAM.00 0.590 0.000 Reinfection Relapse
CAM.04 3.519 CAM.01 0.269
CAM.05 −1.085 CAM.02 0.410
CAM.08 0.395 CAM.03 0.295
CAM.09 0 CAM.05 0.231
CAM.24 2.954 CAM.06 0.231
CAM.27 0 CAM.07 0.192
CAM.08 0.154
CAM.12 0.064
CAM.41 0.013
80R→80RR CAM.00 1.833 0.673 CAM.00 0.590 0.340 Reinfection Relapse
CAM.01 0.469 CAM.02 0.410
CAM.02 0.892 CAM.04 0.346
CAM.03 0 CAM.06 0.231
CAM.05 −1.085 CAM.08 0.154
CAM.06 −1.416 CAM.12 0.064
CAM.07 1.750 CAM.59 0.013
CAM.08 0.395
CAM.12 0.677
CAM.41 0
96→96R CAM.00 1.833 0.979 CAM.00 0.590 0.992 Relapse Reinfection
CAM.02 0.892 CAM.30 0.013
CAM.04 3.519
CAM.08 0.395
125→125R CAM.02 0.892 0.130 CAM.00 0.590 0.000 Reinfection Reinfection
CAM.01 0.269
CAM.02 0.410
CAM.04 0.346
CAM.09 0.077
CAM.13 0.013
CAM.14 0.026
CAM.38 0.013
CAM.45 0.013
T A B L E 5 (Continued)
Initial Recurrence Variant Proposed BPM
Recurrence Pair Variants 𝜷̂ ̂𝝃(𝟎)
𝒊 Variants Prevalence ̂𝝃(𝟏)𝒊 Class Class
151→151R CAM.03 0 0.030 CAM.00 0.590 0.005 Reinfection Reinfection
CAM.05 −1.085 CAM.08 0.154
CAM.08 0.395 CAM.14 0.026
152→152R CAM.00 1.833 0.379 CAM.00 0.590 0.018 Reinfection Relapse
CAM.01 0.469 CAM.01 0.269
CAM.05 0.231
CAM.07 0.192
Asia and geographically adjacent to Thailand. Assuming 5% reinfection rate in this area is reasonable. Interestingly, from the complete list of our classification result in the Supporting Information, 23 individuals had recurrent infections among 78 subjects at the baseline. Among those 23 subjects, 10 subjects are classified as reinfections by our algorithm. The reinfection rate𝜇=𝑃(𝑁𝑖= 1|𝑅𝑖= 0)may be estimated at 10/(78-13)= 15%, which is higher than the literature suggests.
6
DISCUSSION
In this paper, we propose a novel classification method that is model-based and utilizes transition likelihoods to classify
recurrentP. vivaxinfections as either relapse or reinfection.
Previous work used only shared variants to calculate the rein-fection probability. Here, we show that nonshared variants are also informative. Both simulation studies and real data anal-ysis support the feasibility and practical use of our classi-fier. Some assumptions and generalizations of our method are worth of discussion.
First, we assume that the reinfection rate𝜇 is known or
can be correctly specified. Model misspecification on𝜇can
be problematic for both regression coefficient estimation and classification probability calculation when an incorrect value is used. Through simulation experiments listed in our Supporting Information, one can see the impact of the mis-specification is apparent when the sample size is small. When the sample size is large, however, the bias in the coefficient estimation diminishes, and the performance of our classifier improves. Our approach is robust to the misspecification of
𝜇 when the sample size is large. As one can imagine, bias
more likely occurs to the estimation of intercept𝛼 because
both𝜇 and 𝛼 represent some sense of baseline occurrence
rates. Underestimation of 𝜇 shall lead to overestimation of
𝛼, and overestimation of 𝜇 shall lead to underestimation
of 𝛼 to balance the overall baseline occurrence rate. Such
tendency in bias can be seen in our simulation results in the Supporting Information. Meanwhile, although misspecifica-tion on𝜇leads to biased estimation of𝜉(0)𝑖 , the classification
performance of̂𝜉𝑖(1)utilizing transition likelihoods is mildly affected when the reinfection rate is underestimated. Even when the reinfection rate is overestimated, the accuracy of the classifier𝐼(̂𝜉(1)𝑖 >0.5)can still reach a satisfactory level.
Second, we assume the occurrence of the variants is inde-pendent. This assumption can be checked in our real data. Using Fisher’s exact tests for presence/absence of any two
of 13 most frequent variants, the minimum𝑝-value is 0.0048
and only 10 out 78 pairs have 𝑃-value smaller than 0.05.
After Benjamini-Hochberg adjustment for multiple
compar-isons, none of the𝑃-values is smaller than 0.05. The
inde-pendence assumption is not significantly violated in our case. Finally, we assume the transition probabilities are equal for all variants, that is, 𝑞1=⋯=𝑞𝐽 and 𝑞1∗=⋯=𝑞𝐽∗. This assumption can be relaxed using external information to model the transition probabilities. Specifically, one can
assume the probability follow a logistic modellog{𝑞𝑗∕(1 −
𝑞𝑗)} =𝑊′
𝑗𝛾 and log{𝑞𝑗∗∕(1 −𝑞𝑗∗)} =𝑊𝑗′𝛾∗, where 𝑊𝑗 is a
column vector of external covariates, and𝛾 and𝛾∗are
col-umn vectors of regression coefficients. In our case, reading frequency of the variant may be the covariate that is asso-ciated with the transition of the variants. It is worth noting that we assume the transition starts from a new infection to either relapse or reinfection. However, in our real data, there are seven second or third recurrent infections. Although in the real data analysis we treated the most recent infection as the initial infection, the recurrent infection may depend on multiple previous events in this case. The modeling is much more complicated, considering the status of previous infec-tions is unknown except for the baseline infection. It is not clear whether a relapse infection could be associated with the transition probability of the variants. One possible approach is to include the relapse indicator,𝑅𝑖, in the logistic model for
𝑞𝑗 and𝑞𝑗∗, as part of covariates𝑊𝑗. However, because𝑅𝑖 is
not observable, it is not clear how𝛾and𝛾∗can be estimated.
We leave it for future research.
reinfection. In our case, the cause of the event is unknown in all of the events, so the challenge remains as how one can derive the classification probability using a hazard model and transition likelihoods to classify the recurrent infections incorporating the time to infection.
ACKNOWLEDGMENTS
The authors wish to thank editor, associate editor, and reviewers for their careful review and constructive com-ments. This work is partially supported by National Insti-tutes of Health, through grant award number UL1TR002489 and K08AI110651.
DATA AVAILABILITY STATEMENT
The malaria infection data used in the real data analysis are also included in the supporting information and available for public use.
ORCID
Feng-Chang Lin https://orcid.org/0000-0002-2638-1775
Quefeng Li https://orcid.org/0000-0003-0707-2763
Jessica T. Lin https://orcid.org/0000-0002-4516-723X
R E F E R E N C E S
Adekunle, A.I., Pinkevych, M., McGready, R., Luxemburger, C., White, L.J., Nosten, F., Deborah, C. and Davenport, M.P. (2015) Modeling
the dynamics ofPlasmodium vivaxinfection and hypnozoite
reacti-vationin vivo.PLoS Neglected Tropical Diseases, 9, e0003595.
Beck, H.-P., Wampfler, R., Carter, N., Koh, G., Osorio, L., Rueangweer-ayut, R., Krudsood, S., Lacerda, M.V., Llanos-Cuentas, A., Duparc, S., Rubio, J.P. and Green, J.A. (2016) Estimation of the antirelapse
efficacy of tafenoquine, using plasmodium vivax genotyping. The
Journal of Infectious Diseases, 213, 794–799.
Chen, N., Auliff, A.M., Rieckmann, K.H., Gatton, M.L. and Cheng, Q.
(2007) Relapses ofPlasmodium vivaxinfection result from clonal
hypnozoites activated at predetermined intervals. The Journal of
Infectious Diseases, 195 (7), 934–41.
Daniels, R., Volkman, S.K., Milner, D.A., Mahesh, N., Neafsey, D.E., Park, D.J., Rosen, D., Angelino, E., Sabeti, P.C., Wirth, D.F. and
Wie-gand, R.C. (2008) A general SNP-based molecular barcode for
Plas-modium falciparumidentification and tracking.Malaria Journal, 7, 223.
Fan, J. and Lv, J. (2011) Nonconcave penalized likelihood with
NP-dimensionality. IEEE Transactions on Information Theory, 57,
5467–5484.
Friedman, J., Hastie, T. and Tibshirani, R. (2010) Regularization paths
for generalized linear models via coordinate descent.Journal of
Sta-tistical Software, 33, 1–22.
Hathaway, N.J., Parobek, C.M., Juliano, J.J. and Bailey, J.A. (2018) SeekDeep: single-base resolution de novo clustering for amplicon
deep sequencing.Nucleic Acids Research, 46, e21.
Imwong, M., Snounou, G., Pukrittayakamee, S., Tanomsing, N., Kim, J.R., Nandy, A., Guthmann, J.P., Nosten, F., Carlton, J., Looa-reesuwan, S., Nair, S., Sudimack, D., Day, N.P., Anderson, T.J. and
White, N.J. (2007) Relapses ofPlasmodium vivaxinfection usually
result from activation of heterologous hypnozoites.The Journal of
Infectious Diseases, 195, 927–933.
Juliano, J.J., Ariey, F., Sem, R., Tangpukdee, N., Krudsood, S., Olson, C. LooareesuwanS. Rogers, W.O., Wongsrichanalai, C. and
Mesh-nick S.R., (2009) Misclassification of drug failure inPlasmodium
falciparumclinical trials in Southeast Asia.The Journal of Infectious Diseases, 200, 624–628.
Juliano, J.J., Porter, K., Mwapasa, V., Sem, R., Rogers, W.O., Ariey, F., Wongsrichanalai, C., Read, A. and Meshnick, S.R. (2010) Expos-ing malaria in-host diversity and estimatExpos-ing population diversity by
capture-recapture using massively parallel pyrosequencing.
Proceed-ings of the National Academy of Sciences, 107, 20138–20143. Kobbe, R., Neuhoff, R., Marks, F., Adjei, S., Langefeld, I., von Reden, C.
AdjeiO. Meyer, C.G. and May, J. (2006) Seasonal variation and high
multiplicity of first Plasmodium falciparuminfections in children
from a holoendemic area in Ghana, West Africa.Tropical Medicine
& International Health, 11, 613–619.
Kwiek, J.J., Alker, A.P., Wenink, E.C., Chaponda, M., Kalilani, L.V. and Meshnick, S.R. (2007) Estimating true antimalarial efficacy by
het-eroduplex tracking assay in patients with complexPlasmodium
falci-paruminfections.Antimicrobial Agents and Chemotherapy, 51, 521– 527.
Lin, J.T., Hathaway, N.J., Saunders, D.L., Lon, C., Balasubramanian, S., Kharabora, O. GosiP. Sriwichai, S., Kartchner, L., Chuor, C.M., Satharath, P., Lanteri, C., Bailey, J.A. and Juliano, J.J. (2015) Using
amplicon deep sequencing to detect genetic signatures of
Plasmod-ium vivaxrelapse. The Journal of Infectious Diseases, 212, 999– 1008.
Lon, C., Manning, J.E., Vanachayangkul, P., So, M., Sea, D., Se, Y., Gosi, P., Lanteri, C., Chaorattanakawee, S., Sriwichai, S., Soklyda, C., Kuntawunginn, W., Buathong, N., Nou, S., Walsh, D.S., Tyner, S.D., Juliano, J.J., Lin, J., Spring, M., Bethell, D., Kaewkungwal, J., Tang, D., Chuor, C.M., Satharath, P. and Saunders, D. (2014) Efficacy of two versus three-day regimens of dihydroartemisinin-piperaquine for uncomplicated malaria in military personnel in northern Cambodia:
an open-label randomized trial.PLoS ONE, 9, 1–13.
Nyachieo, A., Van Overmeir, C., Laurent, T., Dujardin, J.-C. and
D’Alessandro, U. (2005) Plasmodium falciparum genotyping by
microsatellites as a method to distinguish between recrudescent and
new infections. The American Journal of Tropical Medicine and
Hygiene, 73, 210–213.
Parobek, C.M., Bailey, J.A., Hathaway, N.J., Socheat, D., Rogers, W.O. and Juliano, J.J. (2014) Differing patterns of selection and
geospa-tial genetic diversity within two leadingPlasmodium vivaxcandidate
vaccine antigens.PLoS Neglected Tropical Diseases, 8, 1–17.
Pearson, R.D., Amato, R., Auburn, S., Miotto, O., Almagro-Garcia, J., Amaratunga, C. SuonS. Mao, S., Noviyanti, R., Trimarsanto, H., Marfurt, J., Anstey, N.M., William, T., Boni, M.F., Dolecek, C., Hien, T.T., White, N.J., Michon, P., Siba, P., Tavul, L., Harrison, G., Barry, A., Mueller, I., Ferreira, M.U., Karunaweera, N., Randrianarivelo-josia, M., Gao, Q., Hubbart, C., Hart, L., Jeffery, B., Drury, E., Mead, D., Kekre, M., Campino, S., Manske, M., Cornelius, V.J., MacInnis, B., Rockett, K.A., Miles, A., Rayner, J.C., Fairhurst, R.M., Nosten, F., Price, R.N. and Kwiatkowski, D.P. (2016) Genomic analysis of local
variation and recent evolution inPlasmodium vivax.Nature Genetics,
48, 959–964C.
Tibshirani, R. (1996) Regression shrinkage and selection via the Lasso.
Zou, H. (2006) The adaptive lasso and its oracle properties.Journal of the American Statistical Association, 101, 1418–1429.
Zou, H. and Hastie, T. (2005) Regularization and variable selection via
the elastic net.Journal of the Royal Statistical Society, Series B, 67,
301–320.
SUPPORTING INFORMATION
Web Appendices, Tables, and Figures referenced in Sections 5 and 6 are available with this paper at the Biometrics website on Wiley Online Library. The program codes for the real data analysis are also available at the website.
How to cite this article: Lin F-C, Li Q, Lin JT. Relapse or reinfection: Classification of malaria
infection using transition likelihoods.Biometrics.