Race Differences in Initial Presentation, Early Treatment, and 1-year
Outcomes of Pediatric Crohn
’
s Disease: Results from the
ImproveCareNow Network
Jennifer L. Dotson, MD, MPH,*
,†Michele Cho, MD,
‡Josh Bricker, PhD,
†Michael D. Kappelman, MD, MPH,
§Deena J. Chisolm, PhD,
†Gitit Tomer, MD,
kand Wallace V. Crandall, MD,* for the ImproveCareNow
Pediatric IBD Learning Health System
Background:Racially disparate care has been shown to contribute to suboptimal health care outcomes for minorities. Using the ImproveCareNow network, we investigated differences in management and outcomes of pediatric patients with Crohn’s disease at diagnosis and 1-year postdiagnosis.
Methods:ImproveCareNow is a learning health network for pediatric inflammatory bowel disease. It contains prospective, longitudinal data from outpatient encounters. This retrospective study included all patients with Crohn’s disease#21 years, September 2006 to October 2014, with thefirst recorded encounter#90 days from date of diagnosis and an encounter 1 year660 days. We examined the effect of race on remission rate and treatment at diagnosis and 1 year from diagnosis usingt-tests, Wilcoxon rank-sum tests,x2statistic, and Fisher’s exact tests, where appropriate, followed by
univariate regression models.
Results:Nine hundred seventy-six patients (Black¼118 (12%), White¼858 (88%), mean age¼13 years, 63% male) from 39 sites were included. Black children had a higher percentage of Medicaid insurance (44% versus 11%,P,0.001). At diagnosis, Black children had more active disease according to physician global assessment (P¼0.027), but not by short Pediatric Crohn’s Disease Activity Index (P¼0.67). Race differences in treatment were not identified. Black children had lower hematocrit (34.8 versus 36.7,P,0.001) and albumin levels (3.6 versus 3.9,P¼0.001). At 1 year, Black children had more active disease according to physician global assessment (P¼0.016), but not by short Pediatric Crohn’s Disease Activity Index (P¼0.06).
Conclusions:Black children with Crohn’s disease may have more severe disease than White children based on physician global assessment. Neither disease phenotype differences at diagnosis nor treatment differences at 1-year follow-up were identified.
(Inflamm Bowel Dis 2017;23:767–774)
Key Words:inflammatory bowel disease, Crohn’s disease, pediatric, disparities, race
S
ignificant racial, ethnic, and socioeconomic disparities in access to health care and quality of care have been found throughout the United States in a variety of conditions with little improvement in disparities being reported in the past decade.1–4 Disparities have been shown to contribute to inefficiencies inhealth care delivery systems, as well as suboptimal health care outcomes for minorities and low-income groups.5–7 For some minority groups, access to medical care may be decreased, and different patterns of health care–seeking behavior may also play a role.7,8
Supplemental digital content is available for this article. Direct URL citations appear in the printed text and are provided in the HTML and PDF versions of this article on the journal’s Web site (www.ibdjournal.org).
Received for publication September 30, 2016; Accepted January 6, 2017.
From the *Division of Pediatric Gastroenterology, Hepatology and Nutrition, Nationwide Children’s Hospital, Columbus, Ohio;†The Center for Innovation in Pediatric Practice, The Research Institute, Nationwide Children’s Hospital, Columbus, Ohio;‡Pediatric Gastroenterology, Hepatology and Nutrition, Center for Children’s Digestive Health, Advocate Children’s Hospital, Chicago, Illinois;§Division of Gastroenterology and Hepatology, Department of Pediatrics, University of North Carolina at Chapel Hill,
Chapel Hill, North Carolina; andkDivision of Pediatric Gastroenterology and Nutrition, The Children’s Hospital at Montefiore, Bronx, Albert Einstein College of Medicine, Bronx, New York.
J. L. Dotson was supported by the NASPGHAN Foundation/Crohn’s and Colitis Foundation of America Young Investigator Development Award. The study sponsors had no role in the study design or in the collection, analysis, and interpretation of data; in the writing of the manuscript; or in the decision to submit the manuscript for publication. The remaining authors have no conflict of interest to disclose.
Address correspondence to: Jennifer L. Dotson, MD, MPH, Nationwide Children’s Hospital, 700 Children’s Drive, Columbus, OH 43205 (e-mail: [email protected]).
Copyright © 2017 Crohn’s & Colitis Foundation DOI 10.1097/MIB.0000000000001046
Published online 20 February 2017.
Racial, ethnic, and socioeconomic disparities have been reported in adult inflammatory bowel disease (IBD) populations in rates of surgery and hospitalization. A recent study using a nationally representative population found that non-Hispanic Blacks experi-enced disproportionately higher rates of IBD-related hospitalizations and mortality, relative to the prevalence of IBD.9 There is some evidence for racial disparities in the medical management of adult IBD, with Flaser et al10reporting that Black patients with IBD were half as likely as Whites to receive infliximab, and 43% less likely to be treated with 6-mercaptopurine/azathioprine.
Disparities have also been suggested in pediatric IBD, including the utilization of parenteral nutrition in children hospitalized for protein-calorie malnutrition,11 hospitalization and surgery rates for children with Crohn’s disease (CD),12and postoperative complications for children with ulcerative colitis.13 However, other studies have shown minimal differences.14 Sim-ilarly, studies looking at differences in disease severity and rates of perianal disease are conflicting.6,15,16 Eidelwein et al17 sug-gested that there are differences between Black and White chil-dren with IBD in disease phenotype and family history, but little is known about the role of biological differences in the medical management and outcomes of children with IBD.
Identifying health care disparities is an essential step in allowing practitioners to improve outcomes and health care delivery. Using data from the ImproveCareNow (ICN) network, we aimed to address gaps in the literature on health care disparities in pediatric patients with CD. The ICN registry is poised to address some of these gaps as it contains prospective, detailed, longitudinal demographic, disease, and treatment data collected during outpatient encounters for a large number of pediatric patients with CD across a wide geographical range. Of particular relevance to this study, ICN includes information about disease severity and payor type, which has also been linked to disparities in access and quality of care in the treatment of IBD.18 The primary purpose of this study was to investigate the topic of race disparities in the pediatric IBD population, specifically between Black and White pediatric patients with IBD. The main objectives of our study were to determine (1) if the medical management of Black children with CD differs from White children at diagnosis and 1-year postdiagnosis; and (2) if Black children are less likely to be in corticosteroid-free remission than White children at 1-year postdiagnosis. Our hypotheses were (1) Black children with CD will have a more severe, extensive disease presentation at diagnosis and 1-year follow-up compared with White children, and (2) Black children will have lower rates of steroid-free remission and continuous remission compared with White children.
METHODS
Data Source and Study Design
We performed a retrospective cohort study of pediatric patients with CD who were enrolled in ICN. ICN is a learning health network of pediatric gastroenterology practices established
in 2007 to improve the health and health care of children and adolescents with IBD. The ICN registry contains demographic, disease, and treatment data collected prospectively and longitu-dinally during outpatient encounters. Patients are diagnosed and managed according to the usual practice of the primary gastro-enterologist, and quality improvement methodologies are applied within centers.
Study Population
ICN registry data were extracted for all visits between September 2006 and October 2014 for all patients with CD. Patients were included if they were managed at an ICN center within the defined study period, had a diagnosis of CD, were enrolled in the ICN registry within 90 days of CD diagnosis, were of Black or White race (as recorded by each individual center without predetermined network-wide criteria; biracial and multira-cial subjects were excluded given a limited sample size), had gender recorded, and had at least 1-year follow-up. Other than insurance status, there were no other socioeconomic variables within the database for analysis. Our final study population consisted of individuals who had data at both diagnosis and 1-year postdiagnosis.
Data were recorded and analyses performed for the encounter closest to date of diagnosis (if within 90 days of diagnosis) and at the encounter closest to 1-year postdiagnosis (within 60 days). We counted all visits during thefirst year to assess frequency of follow-up. Data elements for this study included basic demographics, payor type, disease duration, disease extent as defined by Paris classification,19 laboratory studies (hematocrit, erythrocyte sedimentation rate (ESR), and albumin), medications (5-aminosalicylates, corticosteroid, 6-mercaptopurine/azathioprine, methotrexate, anti–tumor necrosis
FIGURE 1. Studyflowchart.
factor a, antibiotics, and enteral nutrition), nutrition and growth status (assigned by the provider as satisfactory, at risk, or in failure according to standardized criteria), body mass index and percentile, growth status, physician global assessment (PGA, pro-vider assigns to remission, mild, moderate, or severe category), and short Pediatric Crohn’s Disease Activity Index (sPCDAI).20
Exposures and Outcomes
The primary predictor in this study was race (Black, White), and the primary outcomes were remission rate (by PGA) and medical management, at diagnosis and at the 1-year follow-up visit.
Patient insurance payor status was a secondary predictor. Secondary outcomes included remission rate by sPCDAI, growth and nutritional status, laboratory results (hematocrit, ESR, and albumin), disease course (number of visits in remission during the first year) and extent, at diagnosis and the 1-year follow-up visit. Annual visit frequency was also assessed. Fecal calprotectin was not routinely collected and, therefore, could not be evaluated. C-reactive protein was routinely collected; however, because of varying methodology and normal ranges across participating centers, as well as the possibility that Black and White children used different laboratories, these data could not be evaluated.
For ethnicity, which was asked differently in 2 different data collection forms, subjects were excluded when they specif-ically endorsed “Hispanic or Latino.” For a small subset of
subjects (17 Black and 60 White) with anomalous height scores (i.e., scores that deviated significantly from a smoothed height trajectory), body mass index scores were recomputed using inter-polated height scores from surrounding visits.
Statistical Analyses
We used t-tests or Wilcoxon rank-sum (nonparametric) tests, as appropriate, to compare age at diagnosis, disease dura-tion, length of enrollment in the study, education levels, and laboratory study results between Black and White children. Cat-egorical variables for health insurance status, nutritional and growth status, medication usage, Paris classifications, and PGA and sPCDAI categories were compared using the x2statistic or Fisher’s exact test, as appropriate. The Wilcoxon rank-sum test was used to evaluate race difference for nonnormally distributed variables. When race differences were identified, we conducted univariate regression models with race as a predictor, as well as separate univariate models with payor status as a predictor. Sub-ject’s age at the visit was included as a covariate when this vari-able demonstrated significance in a preliminary univariate regression model with age as the only predictor. This was fol-lowed by univariate regression with race stratified by payor status to investigate potential effect modification. We also performed a bivariate interaction model to formally test for effect modifi ca-tion based on the significance of the interaction term (data not shown).
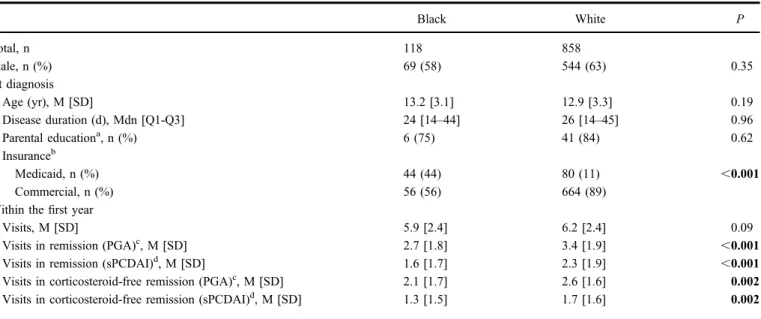
TABLE 1.
Demographic Characteristics by Race at Diagnosis and Remission Status Within the First Year
Black White P
Total, n 118 858
Male, n (%) 69 (58) 544 (63) 0.35
At diagnosis
Age (yr), M [SD] 13.2 [3.1] 12.9 [3.3] 0.19
Disease duration (d), Mdn [Q1-Q3] 24 [14–44] 26 [14–45] 0.96
Parental educationa, n (%) 6 (75) 41 (84) 0.62
Insuranceb
Medicaid, n (%) 44 (44) 80 (11) ,0.001
Commercial, n (%) 56 (56) 664 (89)
Within thefirst year
Visits, M [SD] 5.9 [2.4] 6.2 [2.4] 0.09
Visits in remission (PGA)c, M [SD] 2.7 [1.8] 3.4 [1.9] ,0.001
Visits in remission (sPCDAI)d, M [SD] 1.6 [1.7] 2.3 [1.9] ,0.001
Visits in corticosteroid-free remission (PGA)c, M [SD] 2.1 [1.7] 2.6 [1.6] 0.002
Visits in corticosteroid-free remission (sPCDAI)d, M [SD] 1.3 [1.5] 1.7 [1.6] 0.002
Column percentages are presented by race and based on available data. BoldedPvalues represent significantfindings.
a
Parental education refers to number and percentage of subjects with at least 1 parent with some college education; only 6% of all subjects responded.
b
Three Black and 12 White subjects with both Medicaid and commercial insurance were excluded from this analysis, as well as those who did not respond or were unaware of their insurance type.
c
Remission status according to PGA.
d
Remission status according to sPCDAI (sPCDAI,15¼remission). M, mean; Mdn, median.
Post hoc subanalyses were performed. A survival analysis using Kaplan–Meier curves and Cox proportional hazard model were used to compare time to onset for the use of biological medication according to race. We also evaluated whether Black children were more at risk for nonresponse to a biologic. Using the Fisher’s exact test, we compared the discontinuation of a biologic among those subjects who initiated a biologic within thefirst year since diagnosis by race. We defined biological dis-continuation by having two subsequent visits where a biologic was not listed as a medication.
AP-value of,0.05 was considered statistically significant, unless otherwise noted. All statistical analyses were performed
using R 3.0.1 (R Foundation for Statistical Computing, 2013). This study was approved by the Nationwide Children’s Hospital Institutional Review Board.
RESULTS
Demographics
Figure 1 depicts the study flowchart which resulted in the final patient cohort. Approximately, the same proportion of Black and White children were excluded for lacking a visit at 1-year follow-up within the 60-day window (Black¼82.6%,
TABLE 2.
Disease Behavior and Extent at Diagnosis and 1-year Follow-up
At Diagnosis 1-year Follow-upa
Black, n (%) White, n (%) P Black, n (%) White, n (%) P
Nutritional status
Satisfactory 82 (73) 617 (76) 93 (83) 720 (85)
At risk 21 (19) 146 (18) 15 (13) 102 (12)
In failure 9 (8) 52 (6) 0.77 4 (4) 23 (3) 0.68
BMI, Mdn [IQR] 17.9 [15.9–20.6] 17.8 [16.1–20.1] 0.77 19.3 [17.4–21.7] 19.3 [17.0–21.9] 0.50 BMI %ile, Mdn [IQR] 35.7 [17.3–71.5] 42.8 [19.6–69.2] 0.72 56.8 [29.5–78.3] 53.6 [27.3–79.4] 0.58 Growth status
Satisfactory 87 (80) 672 (83) 0.09 88 (81) 721 (90) 0.002
At risk 11 (10) 101 (12) 12 (11) 61 (8)
In failure 11 (10) 41 (5) 8 (7) 16 (2)
Paris classification
L1: distal 1/2 ileum6limited cecal 4 (10) 64 (19) 0.24 9 (14) 99 (20) 0.32
L2: colonic 10 (24) 59 (18) 15 (23) 85 (17)
L3: ileocolonic 27 (66) 210 (63) 41 (63) 319 (63)
L4a: upper disease proximal to the ligament of Treitz 17 (45) 155 (52) 0.53 26 (46) 205 (46) 1.00 L4b: upper disease distal to the ligament of Treitz 2 (6) 19 (8) 1.00 1 (2) 42 (11) 0.045
L4a and 4b 4 (11) 35 (13) 1.00 6 (10) 56 (12) 0.81
Behavior
B1: nonstricturing, nonpenetrating 95 (85) 736 (89) 0.24 86 (85) 677 (87) 0.69
B2: stricturing 6 (5) 40 (5) 1.00 10 (10) 47 (6) 0.21
B3: penetrating 8 (7) 40 (5) 0.42 4 (4) 32 (4) 1.00
B2B3: penetrating and stricturing 3 (3) 10 (1) 0.20 1 (1) 21 (3) 0.50
Perianal 22 (20) 151 (19) 0.88 29 (25) 176 (21) 0.40
PGA
In remission 32 (29) 287 (35) 0.027 71 (63) 633 (75) 0.016
Mild 40 (37) 354 (43) 29 (26) 162 (19)
Moderate-severe 37 (34) 184 (22) 12 (11) 47 (6)
sPCDAI
Inactive 34 (47) 300 (52) 0.67 46 (65) 454 (73) 0.060
Mild 19 (26) 134 (23) 12 (17) 110 (18)
Moderate-severe 20 (27) 141 (25) 13 (18) 58 (9)
BoldedPvalues represent significantfindings.
a
One-year follow-up refers to visit closest to 365 days (660 days) from diagnosis for each variable—except perianal which refers to all visits up to and including the 1-year follow-up. BMI, body mass index; IQR, interquartile range; Mdn, median.
White ¼ 83.1%). Our final study population included 976 pediatric patients with CD from 39 centers, which was com-posed of 63% males (n ¼613), with a mean age of 13 years (Table 1). There were no significant race differences for sex or age at diagnosis. A higher percentage of Black patients had Medicaid as their primary payor and a higher percentage of White children were using commercial insurance (P, 0.001, Table 1).
Primary Outcomes
Remission Rate/Disease Activity
By PGA classification, Black children were less likely to be in remission (Black children 29%, White children 35%) and more likely to have moderate-to-severe disease activity (Black children 34%, White children 22%) at diagnosis (P ¼ 0.027). Similar
results were seen at 1-year follow-up (P¼0.016). (Table 2 and Figure 2).
Medical Management
There were no significant differences in medications recorded at the time of diagnosis, 1-year follow-up visit, or from all visits collectively within thefirst year (Table 3).
Secondary Outcomes
Remission Rate/Disease Activity by sPCDAI
In contrast to the PGA noted previously, there were no significant race differences in remission rate/disease activity at baseline or at 1 year (Table 2 and Figure 2).
Growth and Nutrition Status
There were no race differences in nutritional status at baseline or at 1-year follow-up. White children had higher rates of satisfactory growth and lower rates of growth failure at 1-year follow-up (P¼0.002, Table 2).
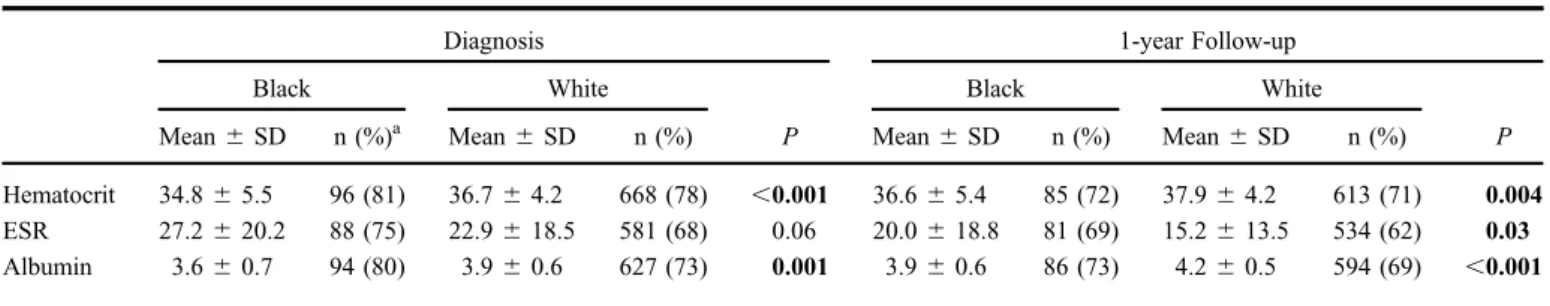
Laboratory Evaluation
At both diagnosis and 1-year follow-up, Black children had statistically lower hematocrit and albumin levels compared with White children, and a higher ESR at 1 year, each with small-to-medium effect sizes based on Cohen’s d (Table 4).
Disease Course and Extent
There was no difference in the mean number of visits within the first year by race (Black children 5.9 visits, White children 6.2 visits,P¼0.09). However, Black children had fewer visits in remission (P, 0.001) or corticosteroid-free remission (P¼ 0.002) within the first year based on PGA and sPCDAI (Table 1). There were no differences in disease behavior (includ-ing perianal disease). L4b (upper disease distal to the ligament of Treitz) was more common in White children (P¼0.045, Table 2). FIGURE 2. Disease Severity at diagnosis and 1-year follow-up
ac-cording to race. Disease severity defined according to PGA and sPCDAI.
TABLE 3.
Medications
aby Race at Diagnosis, 1 Year, and Time From Diagnosis to 1 Year
Diagnosis 1 Year Diagnosis to 1 Year
Black, n (%) White, n (%) P Black, n (%) White, n (%) P Black, n (%) White, n (%) P
5-ASA 38 (32) 305 (36) 0.54 38 (32) 276 (32) 1.00 51 (43) 390 (45) 0.72 Corticosteroid 69 (58) 521 (61) 0.71 8 (7) 87 (10) 0.32 85 (72) 612 (71) 0.96 6-MP/AZA 38 (32) 293 (34) 0.75 56 (47) 376 (44) 0.52 73 (62) 515 (60) 0.78 Methotrexate 3 (3) 28 (4) 1.00 7 (7) 84 (11) 0.26 8 (8) 103 (15) 0.12 Anti-TNFa 13 (12) 88 (11) 0.94 37 (35) 255 (33) 0.69 39 (41) 289 (42) 0.99 Antibiotics 18 (17) 104 (14) 0.43 8 (8) 52 (7) 0.88 30 (32) 222 (32) 1.00 Enteral nutrition 3 (3) 18 (3) 0.73 0 (0) 9 (1) 0.61 3 (3) 36 (4) 0.62
a
Medications at diagnosis include medications prescribed within 90 days of diagnosis; diagnosis to 1 year refers to having at least 1 visit within that time frame.
5-ASA, 5-aminosalicylates; 6-MP, 6-mercaptopurine; Anti–tumor necrosis factor (TNF)a, infliximab, adalimumab, certolizumab; antibiotics, ciprofloxacin, metronidazole, rifaximin; AZA, azathioprine.
Univariate Regression Models for
Signi
fi
cant Outcomes
Univariate logistic regression demonstrated that Black children were less likely to have at least 1 visit in remission or corticosteroid-free remission within thefirst year (based on both PGA and sPCDAI), have satisfactory growth at 1 year, and be in remission at 1 year based on PGA (Table 5).
Regression models predicting laboratory measures from race indicate lower hematocrit and albumin levels for Black children compared with White children at both diagnosis and 1-year follow-up. Children with public insurance were less likely to have at least 1 visit in remission within thefirst year (based on PGA) and had lower albumin levels at 1-year follow-up compared with those with private insurance.
When stratifying by payor status, among those with public insurance, a lower proportion of Black children had visits in remission and visits in corticosteroid-free remission (based on PGA and sPCDAI), and Black children were less likely to be in remission at 1 year based on PGA. Across all measures, no effect modification of race based on payor status was identified—as indicated by nonsignificant interaction terms in bivariate interac-tion models across all measures (see Appendix 1, Supplemental Digital Content 1, http://links.lww.com/IBD/B460).
Subanalysis
There was no difference in the time to initiation of first biological medication according to race (odds ratio¼1.04 [95% CI, 0.74–1.45]) (Fig. 3). There was no difference in the proportion of biological discontinuation according to race (number discon-tinued: Black children¼0, White children¼20, Fisher’s exact test:P¼0.15).
DISCUSSION
In pediatric patients with CD, the literature on disease severity or treatment discrepancies is sparse. In our study of pediatric patients with CD within the ICN registry, we found no treatment differences between the Black and White cohorts, which is similar to the results
of a survey of an adult cohort of patients with IBD, where no difference in medication by race was noted.7 This is in contrast to a retrospective review from a single, tertiary care center that found that Black children were more likely to be prescribed corticosteroids and infliximab,17as well as our earlier work in a hospitalized cohort, in which we found that more Black patients received biological agents and corticosteroids compared with White patients during the hospitalization.14The differences in this study and our previous work are not necessarily contradictory given the different study cohorts (inpatient versus outpatient). For example, Black patients may have been more acutely ill at the time of initiating medications, necessitating an admission in which they received infliximab or corticosteroids, whereas White patients had lesser disease severity and were started on infliximab in the outpatient setting.
Despite no obvious differences in treatment during thefirst year, Black patients were less likely to be in remission by PGA at both baseline (6% difference) and at 1 year (12% difference) and more likely to have moderate-to-severe disease by PGA at both baseline (12% difference) and at 1 year (5%). Furthermore, although there were no differences in remission rate/disease activity at either time point by sPCDAI, there was a trend toward a significant difference at 1 year (P¼0.06). Given that the data were less complete for sPCDAI than those for PGA, failure to detect a difference in disease activity by sPCDAI at 1 year may have been related to power.
It is not particularly surprising to have found some discrepancy between PGA and sPCDAI. Although sPCDAI is comprised of several specific items used to generate an activity score, PGA is determined using all the data available to the provider, including (for good or bad) subtle clinical impressions that may not be accounted for by the sPCDAI. Both are subjective measures, and neither is sufficient to accurately predict endo-scopic remission. In addition, the amount of missing data differed between the 2 groups as previously noted.
Given the discrepancy in findings between the PGA and sPCDAI results, it seems reasonable to examine the secondary outcome measures to help determine whether or not Black patients experience more active disease in the first year from diagnosis.
TABLE 4.
Laboratory Studies by Race at Diagnosis and 1-year Follow-up
Diagnosis 1-year Follow-up
Black White
P
Black White
P
Mean6SD n (%)a Mean6SD n (%) Mean6SD n (%) Mean6SD n (%)
Hematocrit 34.865.5 96 (81) 36.764.2 668 (78) ,0.001 36.665.4 85 (72) 37.964.2 613 (71) 0.004
ESR 27.2620.2 88 (75) 22.9618.5 581 (68) 0.06 20.0618.8 81 (69) 15.2613.5 534 (62) 0.03
Albumin 3.660.7 94 (80) 3.960.6 627 (73) 0.001 3.960.6 86 (73) 4.260.5 594 (69) ,0.001 BoldedPvalues represent significantfindings. Cohen’s d for significant results: Hematocrit at diagnosis¼0.39; Hematocrit at 1 year¼0.27; Albumin at diagnosis¼0.46; Albumin at 1 year¼0.54.
a
Percentage of subjects with a particular laboratory for each race group.
Black patients had fewer visits in remission during the first year from diagnosis, despite a similar number of overall visits. In addition, Black patients were more likely to be assessed as having growth delay, and had statistically significant, if not clinically important, increases in ESR and decreases in albumin and hematocrit. This is consistent with findings by White et al in children with CD, and at least 1 preliminary investigation done by Straus et al in adults with CD showing Black patients had a higher rate of anemia compared with White patients.7,21These effects were found to be unrelated to payor status. Taken collectively, our data suggest that Black patients may have an increase in disease activity during the first year of diagnosis, despite similar treatment and
number of follow-up visits. The reasons for this are unclear but may suggest that CD is more severe in Black children, and/or they respond less well or less quickly to existing medication options.
There are several limitations of our study. Data are captured at outpatient clinic encounters only, so there are limited data with respect to interval events, procedures, surgeries, and hospitalizations. The results may not apply to patients with ulcerative colitis or to those who were excluded from the study population. Furthermore, a significant proportion of subjects were excluded from the final sample because they did not have visits at both diagnosis and within the 1-year follow-up window. Most of those excluded were not enrolled in the ICN registry within 90 days of IBD diagnosis. Factors
TABLE 5.
Univariate Regression Models for Signi
fi
cant Outcomes
Univariate: Race and Payor
Race Payor
b SEb ORa b SEb OR
Visits in remission, PGA ($1 versus 0) 21.13b 0.33 0.32 [0.17 to20.62] 20.80c 0.37 0.45 [0.22–0.93] Visits in corticosteroid-free remission, PGA ($1 versus 0)d 20.79e 0.27 0.45 [0.27 to20.76] 20.42 0.29 0.66 [0.38–1.15] Visits in remission, sPCDAI ($1 versus 0) 20.78b 0.20 0.46 [0.31 to20.68] 20.43 0.23 0.65 [0.42–1.02]
Visits in corticosteroid-free remission, sPCDAI ($1 versus 0)d 20.65e 0.20 0.52 [0.35 to20.77] 20.26 0.21 0.77 [0.51–1.17]
Growth at 1 year (satisfactory versus not) 20.76e 0.28 0.47 [0.27 to20.81] 20.06 0.33 0.94 [0.49–1.80]
PGA at dx (in remission versus not) 20.25 0.22 0.78 [0.50 to21.21] 20.31 0.22 0.73 [0.48–1.12] PGA at 1 year (in remission versus not) 20.56e 0.21 0.57 [0.38 to20.87] 20.31 0.21 0.73 [0.48–1.11]
Hematocrit at dxd 21.89b 0.47 20.29 0.45
Hematocrit at 1 yeard 21.34e 0.49 20.29 0.47
Albumin at dx 20.24b 0.07 20.04 0.07
Albumin at 1 yeard 20.32b 0.06 20.16e 0.05
Univariate: Race Stratified by Payor Status
Public Payor Commercial Payor
b SEb OR b SEb OR
Visits in remission, PGA ($1 versus 0) 21.15c 0.48c 0.32 [0.12 to20.81] 21.28 0.66 0.28 [0.08–1.01] Visits in corticosteroid-free remission, PGA ($1 versus 0)d 20.87c 0.36 0.42 [0.21 to20.86] 20.71 0.51 0.49 [0.18–1.35] Visits in remission, sPCDAI ($1 versus 0) 21.08b 0.29 0.34 [0.19 to20.60] 20.47 0.42 0.62 [0.27–1.42] Visits in corticosteroid-free remission, sPCDAI ($1 versus 0)d 20.91e 0.28 0.40 [0.23 to20.70] 20.35 0.40 0.71 [0.32–1.54] Growth at 1 year (satisfactory versus not) 20.43 0.43 0.65 [0.28 to21.51] 21.88e 0.70 0.15 [0.04–0.60]
PGA at dx (in remission versus not) 20.09 0.30 0.91 [0.50 to21.65] 20.49 0.45 0.61 [0.25–1.47] PGA at 1 year (in remission versus not) 20.60c 0.30 0.55 [0.30 to20.99] 20.32 0.41 0.73 [0.33–1.61]
Hematocrit at dxd 21.72e 0.64 22.08e 0.78
Hematocrit at 1 yeard 21.19 0.66 21.21 1.00
Albumin at dx 20.26e 0.09 20.27c 0.12
Albumin at 1 yeard 20.21e 0.07 20.42b 0.12
Reference groups: White race and commercial payor status. Remission status according to PGA and sPCDAI.
a
Odds ratios (ORs) (exponentiated beta values) are presented for logistic regression on categorical outcomes only.
b
P,0.001.
c
P,0.05.
d
Age was a covariate.
e
P,0.01. dx, diagnosis.
that may explain such long delays to thefirst visit include (1) patients who were new to an ICN center but not newly diagnosed with CD, and (2) that most patients at a center were there for a long period before the center joining and recruiting subjects for the registry. As ICN attempts to standardize care to some degree, there may be more racial variation in the real world than within the ICN community. We were unable to adjust for income and, thus, cannot separate the effects of race from the effects of income or socioeconomic status. The results of this study cannot be generalized to other racial or ethnic minority groups. PGA is commonly used to assess clinical remission. Although endoscopic remission or potentially even fecal calprotectin would be a more rigorous endpoint, there are no sufficient data to use that as an outcome metric in this study. The key strengths of this study are that it is a large, regionally diverse, multicenter study; the data are prospectively and longitudinally collected, and it represents our day-to-day outpatient experience (as opposed to results from administrative data sets, etc.).
In summary, this study identified several racial and few socioeconomic disparities in pediatric patients with CD, including differences in 1-year remission rate, despite similar treatment. The significance of and reasons for these disparities require further investigation. Multicenter, prospective studies would be helpful in clarifying the role of socioeconomic, genetic, psychosocial, and other factors that could contribute to thesefindings.
ACKNOWLEDGMENTS
The authors thank the gastroenterologists and their patients who made this study possible. For a complete list of current ICN
Centers, please refer to https://improvecarenow.org/about/where-we-serve.
REFERENCES
1. Morgan PL, Staff J, Hillemeier MM, et al. Racial and ethnic disparities in ADHD diagnosis from kindergarten to eighth grade.Pediatrics. 2013;132: 85–93.
2. Bristow RE, Powell MA, Al-Hammadi N, et al. Disparities in ovarian cancer care quality and survival according to race and socioeconomic status.J Natl Cancer Inst.2013;105:823–832.
3. Services USDoHaH.National Healthcare Disparities Report 2012. Rock-ville, MD: Agency for Healthcare Research and Quality; 2013. 13–0003. 4. Beck AF, Huang B, Simmons JM, et al. Role of financial and social
hardships in asthma racial disparities.Pediatrics. 2014;133:431–439. 5. Basu D, Lopez I, Kulkarni A, et al. Impact of race and ethnicity on
inflammatory bowel disease.Am J Gastroenterol.2005;100:2254–2261. 6. Nguyen GC, Torres EA, Regueiro M, et al. Inflammatory bowel disease
characteristics among African Americans, Hispanics, and non-Hispanic Whites: characterization of a large North American cohort.Am J Gastroenterol.2006; 101:1012–1023.
7. Straus WL, Eisen GM, Sandler RS, et al. Crohn’s disease: does race matter? The Mid-Atlantic Crohn’s Disease Study Group.Am J Gastro-enterol.2000;95:479–483.
8. Smedley BD, Stith AY, Nelson AR.Unequal Treatment: Confronting Racial, Ethnic Disparities In Health Care (full printed version). Washington, DC: National Academies Press; 2003.
9. Nguyen GC, Chong CA, Chong RY. National estimates of the burden of inflammatory bowel disease among racial and ethnic groups in the United States.J Crohns Colitis.2013;8:288–295.
10. Flasar MH, Johnson T, Roghmann MC, et al. Disparities in the use of immunomodulators and biologics for the treatment of inflammatory bowel disease: a retrospective cohort study.Inflamm Bowel Dis.2008;14:13–19. 11. Nguyen GC, Munsell M, Brant SR, et al. Racial and geographic disparities in the use of parenteral nutrition among inflammatory bowel disease inpatients diagnosed with malnutrition in the United States. JPEN J Parenter Enteral Nutr.2009;33:563–568.
12. Benchimol EI, To T, Griffiths AM, et al. Outcomes of pediatric infl am-matory bowel disease: socioeconomic status disparity in a universal-access healthcare system.J. Pediatr.2011;158:960–967. e961–964. 13. Kelley-Quon LI, Tseng CH, Jen HC, et al. Postoperative complications
and health care use in children undergoing surgery for ulcerative colitis. J Pediatr Surg.2012;47:2063–2070.
14. Dotson J, Kappelman MD, Chisolm DJ, et al. Racial disparities in read-mission, complications, and procedures in children with Crohn’s disease. Inflamm Bowel Dis.2015;21:801–808.
15. Alli-Akintade L, Pruthvi P, Hadi N, et al. Race andfistulizing perianal Crohn’s disease.J Clin Gastroenterol.2015;49:e21–e23.
16. Mahid SS, Mulhall AM, Gholson RD, et al. Inflammatory bowel disease and African Americans: a systematic review.Inflamm Bowel Dis.2008; 14:960–967.
17. Eidelwein AP, Thompson R, Fiorino K, et al. Disease presentation and clinical course in black and white children with inflammatory bowel disease. J Pediatr Gastroenterol Nutr.2007;44:555–560.
18. Sewell JL, Velayos FS. Systematic review: the role of race and socioeco-nomic factors on IBD healthcare delivery and effectiveness. Inflamm Bowel Dis.2013;19:627–643.
19. Levine A, Griffiths A, Markowitz J, et al. Pediatric modification of the Montreal classification for inflammatory bowel disease: the Paris classifi -cation.Inflamm Bowel Dis.2011;17:1314–1321.
20. Kappelman MD, Crandall WV, Colletti RB, et al. Short pediatric Crohn’s disease activity index for quality improvement and observational research. Inflamm Bowel Dis.2011;17:112–117.
21. White JM, O’Connor S, Winter HS, et al. Inflammatory bowel disease in African American children compared with other racial/ethnic groups in a multicenter registry.Clin Gastroenterol Hepatol.2008;6:1361–1369. FIGURE 3. Time to initiation offirst biological medication according to
race (race odds ratio¼1.04 [95% CI, 0.74–1.45]).


![FIGURE 3. Time to initiation of first biological medication according to race (race odds ratio ¼ 1.04 [95% CI, 0.74–1.45]).](https://thumb-us.123doks.com/thumbv2/123dok_us/8302895.2198994/8.890.61.432.111.445/figure-time-initiation-first-biological-medication-according-ratio.webp)
