http://www.jscdss.com
Vol.1 No.1 December 2014: 39-44 Article history:
Accepted 16 December 2014 Published online 16 December 2014
Journal of Soft Computing and Decision
Support Systems
Forecasting Value of Pollutant Index in Surabaya River Using
Fuzzy Radial Basis Function Neural Network
Nisa Ayunda a,*, Mohammad Isa Irawan a, Nieke Karnaningroem b
a Institut Teknologi Sepuluh Nopember, Faculty of Mathematics and Natural Science Department of Mathematics, Jalan Raya ITS, Surabaya, Indonesia b Institut Teknologi Sepuluh Nopember, Department of Environmental Engineering, Jalan Raya ITS, Surabaya, Indonesia
* Corresponding author email address: [email protected]
Abstract
Water resources quality for people in around Surabaya River is an important thing that can be laid aside so it need a management and monitoring system for water quality of Surabaya River. One form of monitoring system for Surabaya River water quality is trend analysis of the system, so it can be used to identify the water system and forecast the next condition. Radial basis function neural network model can be used to analyze the tendency of the water system is based on time series data of the pollutant index value. Taking into account the possibility of parallax error in the measurement, the limited data, and different data characteristics, application of fuzzy theory is imposed on the model. Application of fuzzy theory is also based on its ability for measure the uncertainty by the lower and upper bound. Fuzzy radial basis function neural network model formed expected to give results close to the actual value of forecasting on the testing step of simulation models. Forecasting results obtained pollution index values can also be used as a reference in the management and monitoring system of Surabaya River.
Keywords: Fuzzy radial basis function, Pollutant index, Surabaya river
1. Introduction
One of the most important energy source in the world is water. Water from Surabaya River used for various purposes such as irrigation, drinking water, industrial water and flushing. In accordance with the designation, according to the Decree of the East Java Governor No. 413 on 1997, Surabaya River which is one source of drinking water is expected to meet the quality standards of water quality in B class. Therefore, the set method of evaluating the quality of water system with water quality pollution index stipulated in the Decree of the Environment Minister No. 115 on 2003 on guidelines for the determination of water quality status. In chapter 2 on the decree, the determination of the water quality status can be done by Pollution Index (IP) methods. Pollution index value in the time series can be analyzed to identify the water system. Masduqi and Apriliani (2008) has researched to estimate the quality of water in Surabaya River for a time, but how the behavior of the system can not be analyzed so it’s difficult to be used when rapid changes in river conditions occur.
Artificial neural network modeling is one of study about systems engineering that can be used to analyze the mechanisms, patterns, behaviors and tendencies system (Arifin and Irawan, 2009). Neural network is widely used in time series data as a function of time . The goal is to forecasting value in the future (Bishop, 1995). Suppose
there is a single variable . One approach is to generate a sequence of discrete values and so on. Taken such that there are as input to the network of value as the target for the network output. Riggs (1987) stated that one way of forecasting is the method of time series which uses historical data (past time data), for example, the data values of water quality parameters today, to make the forecast values of water quality parameters in the future. The purpose of this method is to identify the patterns of historical data and then extrapolate this pattern into the future. In a method of identifying patterns of past data is done by creating an artificial neural network is trained to be able to mimic the pattern of data. Selection of algorithms and corresponding parameters and determining how much the data required in the learning process is very important to determine the accuracy of generated forecasting.
Radial basis function neural network first introduced into the literature on neural networks by Broomhead and Lowe (1998). Qiao et al. (2011) also offer a design algorithm model of radial basis function neural network to model parameters COD in the wastewater treatment process. The results showed that the pattern of COD in the disposal of the wastewater treatment can be predicted with acceptable accuracy using data SS, pH, oil and NH3-N as
model of radial basis function neural network is expected to yield estimates have acceptable accuracy.
Radial basis function neural network is a neural network model with multiple units in the hidden layer, the activation function is radial basis function and a linear function in the output layer. In relation to the number of training data required in the model of radial basis function neural network and water quality data are limited, the application of fuzzy theory in the radial basis function neural network model used in this study. In addition, the application of fuzzy theory is used as unsupervised learning also to cope with the possibility of parallax error in the measurement.
Theory of fuzzy logic techniques have been successfully applied by Lee et al. (1997) and Dahiya et al. (2007) in modeling of water quality parameters. Fuzzy is an adjective that describes something that is not clear, doubt, imprecise, vague, and so forth. The concept of fuzzy sets offer a method that can handle uncertainty in which there is no clear boundary between the condition with other conditions. The ability of fuzzy sets is to express gradual transition from membership becomes not membership in a set, and the opposite (Kusumadewi et al., 2004).
Therefore, this study discusses the algorithms in neural network models Fuzzy Radial Basis Function and know how forecasting Pollution Index values using fuzzy neural network model of Radial Basis Function (FRBF). In forecasting results Pollution Index values can be seen the level of success in developing a model of forecasting the results of a real problem with using one of the artificial neural network model. This study is also expected as a manifestation of the role of soft computing in mathematics scholar for environmental management.
2. Research Methods
This study is one form of neural network applications in the management and monitoring of water quality in Surabaya. This study begins with data collection is done by contacting the relevant agencies with the aim of getting the best data objects. From the collection of data on several relevant agencies, the value of data taken several water quality parameters in time series which has the largest amount of data and also has short periodic.
2.1 Pollution Index Method
The object of this research is time series data pollution index value of Surabaya River. Pollution index value is the value of the evaluation results of the value of water quality parameters in each measurement time using the pollution index. The steps of determining the value of the index of pollution with pollution index method is as follows :
If stated concentrations of water quality parameters listed in the Water Quality Standard ( ), and stated concentrations of water quality parameters ( ) obtained from the analysis perpercontoh water at a river location, then the is for allotment Pollution Index ( ) which is a function . value is determined by:
1. Calculate the value for each parameter in each sample.
2. If the value , use the value ( ) with ( )
is the outcome measurement value; If the value , use the value ( )
. The formula: ( ) ( ) , with is a constant value which usually defined by 5.
3. Determine the average value and the maximum value of the overall , that namely ( ) and ( ) , with the formula :
√( ) ( ) (1)
with = maximum value ; = average value
Pollution index values obtained by the methods of classical pollution index is a number. While the expected input values in the model of this research is fuzzy numbers. Therefore the IP classification is also stipulated in the Decree of the Minister of Environment No. 115 of 2003 is used as a determinant of the lower bound and an upper bound to represent the pollution index value into fuzzy numbers. Here is the pollution index value classification :
Table 1
Classification of IP According to the Decree of the Minister of Environment No. 115 on 2003
value Pollution Status Good Condition
Easy Contamining
Medium Contamining
Hard Contamining
2.2 Fuzzy Radial Basis Function Neural Network
The main objective of this research is to develop forecasting models and the introduction of pollution index of Surabaya River with the application of artificial neural network that it is a neural network model of Fuzzy Radial Basis Function (FRBF) to Surabaya River. The basic concept of fuzzy radial basis function neural network model is the application of fuzzy theory to the basic model of Radial Basis Function (RBF) neural networks. The move is intended to develop the quality of the forecasting of the limited data and overcome the parallax error in the measurement. Fuzzy neural network model Radial Basis Function is unsupervised models - and- supervised learning (Chi and Hsu, 2001). The learning algorithm can be divided into two stages : stage unsupervised learning and supervised learning phase. The process of unsupervised learning algorithm can be described as follows.
̃[ ]( )
( ̃ [ ]( ) ̃ [ ]( ) ̃ [ ]( ))
(2)
With
̃ [ ]( ) ( ̃ [ ] ( ) ̃ [ ] ( )) (3)
and is the number of input neurons and is the number of hidden neurons.
Step 2. Input the fuzzy vector
̃[ ]( ) ( ̃ [ ]( ) ̃[ ]( ) ̃ [ ]( ))
(4)
With
̃[ ]( ) ( ̃[ ] ( ) ̃[ ] ( ))
(5)
represents the fuzzy intervals of the ’th input neuron at time .
Step 3. Calculate the fuzzy distance between the input vector and each neuron on the hidden layer
̃[ ]( ) ‖ ̃⃗[ ]( ) ̃⃗[ ]( )‖
∑ ( ̃⃗[ ]( ) ̃⃗ [ ]( ))
(6)
with ̃ [ ]( ) is the fuzzy interval between the ’th neuron of the input layer and ’th neuron of the hidden layer.
Step 4. Use the center of gravity method to defuzzify the fuzzy distance.
[ ]( ) ∑ ̃[ ]( ) ̃( ̃[ ]( ))
∑ ̃( ̃[ ]( ))
(7)
Step 5. Find out the winner neuron with the minimum distance on the hidden layer
[ ]( ) { [ ]( )} (8)
Step 6. Update the fuzzy value of the winner neuron
̃ [ ]( ) ̃ [ ]( )
( ) ( ̃ [ ]( ) ̃ [ ]( ))
(9)
with ( ) represents the learning rate at time .
Step 7. Reduce the learning rate and repeat steps 2-6 until the number of learning cycles reaches the predetermined value.
( ) ( ) ( ) (10)
with ( ) is the reduction rate of the learning rate at time .
In addition, the supervised learning process can be expressed as the following steps :
Step 1. Compute the output value of the hidden neurons
( ) ( ( )
) (11)
with is standard deviation of the ’th hidden neuron is the Euclidean distance between the input vector and the ’th center.
Step 2. Compute the output value of the output neurons
( ) ∑ ( ) ( )
(12)
Step 3. Compute the error between the desired and actual responses.
( ) ( )
(13)
Step 4. Adjust the connection weights among the hidden neurons and output neurons
( ) ( ) ( ) ( ) (14)
Step 5. Repeat Step 1 through Step 4 on the supervised learning until the number of training cycles or the allowable error is reached.
3. Experiments and Results
Table 2
Example of Value Pollution Index.
Parameter ( )
DO 4,7 4 1,175 1,350
BOD 7,6 3 2,533 3,018
COD 15,8 25 0,632 0,632
Average 1,667
Max 3,018
2,438
Classification of water pollution index value based on the Decree of the Minister of Environment No. 115 of 2003 on guidelines for the determination of water quality status is used as the determination of fuzzy membership function for each value of the pollution index.
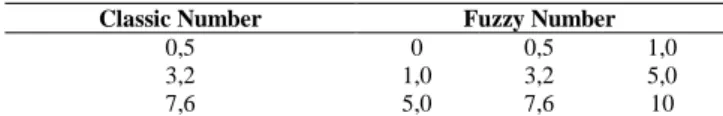
Representation of the membership functions used in this study is the representation of the triangle curve. Representation of the triangle curve is a simple form of fuzzy numbers being able to include a number of classic persekitaran by observing the lower bound and an upper bound of the number. The lower limit in each of the ranges in the classification status of water is used as a lower bound for each value of the pollution index. While the upper limit on each of the ranges in the classification status of waters used as an upper bound for each value of the pollution index. Having regard to the lower bound and an upper bound for any form of pollution index value fuzzy numbers for each value of the pollution index as shown in Table 3. The process of transforming the classical numbers pollution index values into fuzzy numbers pollution index value is called the fuzzification process. Fuzzification process is the first step in unsupervised learning phase FRBF model which is expected to improve the quality of forecasting results from the limited data and overcome the parallax error in the measurement.
Table 3
Sample of Fuzzification Pollution Index Value Results.
Classic Number Fuzzy Number
0,5 0 0,5 1,0
3,2 1,0 3,2 5,0
7,6 5,0 7,6 10
Fuzzy numbers for each value of the pollution index is used as an input in determining the distance between each neuron in the input layer to each neuron in the hidden layer. Determination of the distance represented by fuzzy α-cut interval in the ’th neuron on the input layer and the ’th neuron on the hidden layer.
The shortest distance is then didefuzzifikasi using COG (Center of Gravity). COG method is basically a heavy point search method for a triangular curve representation for fuzzy numbers. For example, fuzzy numbers [ ] can didefuzzifikasi be ( ) as a classic numbers.
[ ]( ) ∑ ̃[ ]( ) ̃( ̃[ ]( ))
∑ ̃( ̃[ ]( ))
( ) ( ) ( )
Distances from the selected one of the distance to the minimum value as selected neurons (center) in the hidden layer to be updated. Then the distances are used to calculate the output on hidden neurons and output neurons. Furthermore, the error between the calculated value and the actual value is generated. These steps are repeated until it reaches a predetermined minimum error. Looping and calculation process is simulated in Matlab 2013a so that the resulting pollution index value at the next time.
The data used in this research is the pollution index value data 2008 to 2013 with data collection every 2 weeks. The data used in the training process of the neural network is the data in 2008 and 2012, amounting to 122. While the data of 2013 is used for testing the neural network. The results of the testing process that is described in the form of a graph is as follows.
Fig 1. Graph Pollution Index Value Results Forecasting with neural networks FRBF.
In the chart above, it is seen that the neural network model Fuzzy Radial Basis Function able to predict the value of the pollution index approaches the true value to the results of forecasting to 8’th iteration. But in forecasting the 7’th, the actual value is too high is not able to be approached by the value of the pollution index forecasting results. Comparison of the results of forecasting the actual value with the value of MSE (Mean Square Error) can be seen in Table 4.
Table 4
Comparison with Actual Results Forecasting and MSE.
Data 1 2 3 4 5 6 7 8
Forecasting Value 4.27 4.06 3.05 4.11 3.02 4.17 2.98 6.00 Actual Value 4.27 4.06 4.85 4.33 4.11 5.08 15 7.99 MSE 0 0 0.35 0.01 0.13 0.09 16.05 0.44
According Irawan (2013), the percentage of accuracy ( ) can be evaluated by dividing the same or close to ( ) for all the results obtained ( ) by the following equation.
4. Conclusion
The purpose of this study is to know how to work and the ability of neural network models Fuzzy Radial Basis Function in predicting the value of the pollution index in Surabaya. The workings of the model is divided into two stages, namely unsupervised learning which adopts fuzzy theory and application of supervised learning on Radial Basis Function neural network model. Ability Fuzzy Radial Basis Function models in forecasting pollution index has proven accuracy of the results and can be applied to other problems due to the forecasting results for this research issue has small error value and the value of the forecasting approach the actual value. However, there was an outlier data or data that suddenly surged not been able to be approached by forecasting the results of the pollution index value at the time. Therefore, more research needs to be done in tackling these data outliers.
Acknowledges
Preparation of this article can not be separated from the support of anyone in Institut Teknologi Sepuluh Nopember Surabaya who have helped for the completeness of this article. The author also would appreciate to Direktorat Pendidikan Tinggi Indonesia as benefactor of this research. Moreover, thanks to the Perum. Jasa Tirta Malang as data provider for this research.
References
Arifin Z. dan M.I. Irawan. (2009). Adaptive Sensitivity Sensitivity-based Linear Learning Method Algorithms for Data Classification. Proceeding of 5th International Conference of Mathematics, Statistics and Their Aplications, Juni 9 -11. Bukit Tinggi – West Sumatra Indonesia.
Bishop, C. M.. (1995). Neural Networks for Pattern Recognition. United States: Oxford University Press Inc.
Broomhead, D., Lowe, D. (1988). Multivariable functional interpolation and adaptive networks. Complex Syst. 2 (6), 321– 355.
Chi, Sheng-Chai dan Li-Chang Hsu. (2001). A Fuzzy Radial Basis Function Neural Network for Predicting Multiple Quality Characteristics of Plasma Arc Welding. IEEE. Taiwan.
Dahiya, S., Singh, B., Gaur, S., Garg, V.K., Kushwaha, H.S. (2007). Analysis of groundwater quality using fuzzy synthetic evaluation. J. Hazard. Mater. 147,938–946.
Irawan, M.I., Syaharuddin, Daryono B.U., Alvida M.U. (2013). Intelligent Irrigation Water Requirement System Based on Artificial Neural Networks and Profit Optimization for Planting Time Decision Making of Crops in Lombok Island. Journal of Theoritical and Applied Information Technology Vol.58 No.3, 1992-8645.
Kusumadewi, Sri dan Hari Purnomo. (2004). Aplikasi Logika Fuzzy untuk Mendukung Keputusan, Yogyakarta: Graha Ilmu.
Lee, H.K., Oh, K.D., Park, D.H., Jung, J.H., Yoon, S.J., (1997). Fuzzy expert system to determine stream water quality classification from ecological information. Water Sci. Technol. 36 (12), 199–206.
Masduqi, A dan E. Apriliani. (2008). Estimation of Surabaya River Water Quality Using Kalman Filter Algorithm. IPTEK. The Journal for Technology and Science, Vol. 19, No. 3, August 2008
Riggs, James L. (1987). Production System – Planning, Analysis and Control. Singapore: John Wiley & Sons.
Qiao, J., Chen, Q., Han, H., (2011). The chemical oxygen demand modelling based on a dynamic structure neural network. Waste water-evaluation and management. Prof. Fernando Sebastián García Einschlag. 93–114, ISBN 978-953-307-233-3 pp.
Author Biographies
Nisa Ayunda, a master student of Mathematics Faculty at Institut Teknologi Sepuluh Nopember (ITS) Surabaya. Currently undergoing final semester in the Department of Mathematics. The author has conducted research “Model Jaringan Syaraf Fuzzy Radial Basis Function untuk Peramalan Nilai BOD pada Kali Surabaya” and proceeding that paper at Faculty of Mathematics and Natural Science, Universitas Negeri Semarang, 8 November 2014.
Mohammad Isa Irawan, Professor of Mathematics and Computer Sciences from Institut Teknologi Sepuluh Nopember (ITS) Surabaya. The author published articles areas of interest Artificial Intelligence, Bioinformatics, and Decision Support System. Citation indices since 2009 until now and several paper were published already indexed Scopus. Among the paper that have been published in 2013 is “Intelligent Irrigation Water Requirement System Based on Artificial Neural Networks and Profit Optimization for Planting Time Desicion Making of Crops in Lombok Island”, Journal of The Theoretical and Applied Information Technology 31st December 2013. Vol. 58 No.3. The ohter published is “ The Implentation of Multi-Attribute Approach in Decision Making foe Defense Sea Region Models”, Journal of The Theoretical & Apllied Information Technology, Volume 53, 2013. And “Implementation of Nondominated Sorting Genetic Algorithm-II (NSGA-II) for Multiobjective Optimization Problems on Distribution of Indonesian Navy Warship”, Journal of Theoretical & Apllied Information Technology 64 (1), 2014. And “The Implemtation of Binary Genetic Algorithm (BGA) for Optimizing the Task of Indonesian Navy Ship Patrols Related to the Security of Indonesian Seas”, Journal of Theoretical & Apllied Information Technology 67 (1), 2014