Quantify and Examined Of Video Distribution Sites For
Appreciative Links
Devaki Sravani
#1,Anantha Rao .G
#2#1Student of M.Tech (CSE) and Department of Computer Since Engineering,
#2 Department of Computer Science
Dr.Samuel George Institute of Engineering & Technology,
Markapur.
ABSTRACT:
Videos are an integral part of current information technologies and the snare. The demand for efficient retrieval rises with the increasing number of videos, which is equally true for video annotation techniques as matadata is the primary source of most retrieval systems. - Recently, many video distribution sites provide external links so that their video or audio contents can be embedded into external snare sites. Online social networks (OSNs) have become popular desti- nations for connecting friends and distribution information. Recent statistics suggest that OSN users regularly share con-tents from video sites, and a significant amount of requests of the video sites are indeed from them nowadays. These behaviors have substantially changed the workload of on line video services.In this paper, we provide a comprehensive quantify study and examined source on these external links to answer these two questions. With the traces together from two major video distribution sites, YouTube and Youku of China, we show that the external links have various impacts on the popularity of the video distribution sites. The social video proposed system provides information that is directed and personalized for the user overriding the content rather than the point of view of the user posting the content. The tradeoff in our case being that users have to sacrifice privacy and have to trust the recommendation system provider with their private data.
1 Introduction:
Traditionally, users have discovered videos on the Web by browsing or searching [5]. Recently, word-of-mouth has emerged as a popular way of discovering the videos, partic ularly on social network sites such as Facebook and Twit ter [11]. On these sites, users discover video contents by
following their friends’ shares. Such word-of-mouth based content discovery has become a major driver of
the OSN-based spreading mechanism can result in the observed distribution. For popularity evolution, we observe that the requests for the new published videos generally experience two or three days latency to reach the peak value, and then change dynamically with a series of unpredictable bursts (while in YouTube, videos reach the global peak immediately, and then the accesses generally decrease overtime, except possibly on some special days).
2. RELATED WORK
To our best knowledge, our work is the first one on characterizing the patterns of video requests from OSNs, by measurement and model. There are some pioneer data-driven analysis of information spreading in OSNs. Cha et al. [12] conducted a large-scale measurement study on Flickr network, one of the most popular photo sharing social
net-works. They found that even popular photos spread slowly through the network. By contrast, we found that the videos in an OSN spread much faster. Rorigues et al. [9] studied the propagation of URL links posted in Twitter, using large data gathered from Twitter. They presented the distribution of height, width, and size of propagation trees and found that Twitter yields propagation trees that are wider than they are deep. They did not separate the video linksfrom their dataset to give them an individual analysis. Scellato et al. [6] pointed that given the increasing size of Twitter and other OSNs, they may generate millions of accesses to YouTube, accounting for a consistent fraction of the total number of daily requests. Instead of studying the video popularity characteristics, they focused on the geographic property of social cascades of videos by tracking social cascades of YouTube links over Twitter. There are also plenty of works on the user access patterns from video sharing sites (e.g., YouTube) either by crawling the webpages or tracing traffic from a set of network routers/switches. Cha et al. [9] presented an in-depth study of the static popularity distribution, and dynamic popularity evolution of videos in two large-scale VSSes, YouTube and Daum. They found that the video popularity in YouTubeshows a power-law waist with a long truncated tail for huge unpopular videos. Cheng et al. [10] also studied the distribution and evolution of videos in YouTube, and found similar results. They further presented other statistics of YouTube video files such the length, bitrate, and size. More recently, Figueiredo et al. [4] made an in-depth analysis on
dataset. Besides those works that focused on the global nature of YouTube traffic by crawling YouTube webpages, and there are some complementary works by collecting YouTube traffic from lo cal networks. Gill et al. [7] characterized the YouTube traffic collected at the University of Calgary campus network, com paring its properties with those previously reported for Web and streaming media workloads. They analyzed daily and weekly patterns as well as several videos characteristics such as duration, bitrate, age, ratings, and category. Another similar study [8] by Zink et al. also analyzed network traces for YouTube traffic at a campus network to understand the benefits of alternative content distribution strategies. Our work focuses on the distinguished features for videos shared in the RenRen OSN especially regarding video popularity distribution and evolution. And we demonstrate the wordof-mouth based social sharing can dramatically affect the pattern of user requests for videos.
3. CHARACTERISTICS OF THE EXTERNAL LINKS
3.1 An Overview of External Links
We first show the impact of the external views on the videos in Fig. 2. We classify the videos according to their ages, i.e., the total duration since they have been uploaded to the VOD sites. Note that YouTube provides the upload date for each video, whereas Youku provides a rougher estimation of how many days or months or years a video has been uploaded. For example, the videos uploaded 13months or 14
To explain the situation more clearly, we show the specific number of the total views of the videos and the total views from external links as a function of the video ages. In Fig.2 (b) we show the total views, averaged per video, for different video age groups (this includes both views from internal links and external links). Clearly,YouTube attracts much more views than Youku. The total views increase steadily for both YouTube and Youku as the video ages increase. In Fig.2 (c), we show the total views from external links (averaged per video). We see that for YouTube, the total external views are comparatively stable among all video ages groups. The external views are concentrated by the first few months. This is likely because for the external links which referee the video, their exposure will also reduce when time passes and the exposure of their posts is superseded by more recent posts, making the views to the external linked videos drops very fast. As such, there is very moderate accumulation of the external views. For Youku, the total external view increases with the time and the discrepancy of views in external view groups is not that dramatic.
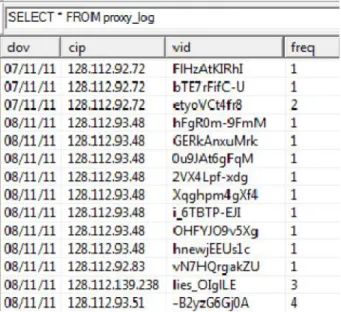
This component parses the proxy server logs and extracts the VID from YouTube video requests made by the clients. It scans through the entire log file line
by line and checks for URLs with “youtube” in their
hostname. The component uses the urlparse Python library to parse the URL into its subcomponents: scheme, path, params, query, port etc. We are only
interested in the query component of the URL from
which we extract the parameter ‘v’ which contains
the value of VID. We also extract the date of viewing and client IP address from the logs for each such request. The system then calculates the frequency of this VID request across all HTTP requests for that day. After parsing the entire log file for the day, it stores all the VID requests into the proxy_log (see Figure 3) table of the database.
Figure 2. This figure shows a snippet from the proxy_log table of the recommendation system database.
PROPOSED SCHEME:
In this paper, we are interested in these external links. Compared with past studies on the interaction between users and videos within the video sharing sites, we are the first to concentrate on external links to videos of these sites. We have the following contributions in this paper: 1) we proposed to study the external links of the video sharing sites and we tried to quantify its impact. We believe this adds to the knowledge base, and could be useful for future comparison; 2) we showed that the impact from external links is non-trivial and we also found substantial differences on the impact of the external links on YouTube and Youku; 3) we conducted measurements on both external links and some important internal links and we studied their correlations; 4) we published the data sets of external
links we collected from YouTube and Youku for possible follow-up studies.
ADVANTAGES
5. MODEL ANALYSIS
Our measurement has shown distinctive popularity distribution pattern for video sharing in OSNs. To further testify whether the OSN-based spreading mechanism is the underlying reason for these features, we develop a simple yet effective model to make some preliminary analysis. However, the proxy server logs show that server usage was very low. Out of the 15 volunteers who agreed to use the proxy server, 5 volunteers watched less than 3 videos using the proxy server. The responses of these volunteers were not collected for the survey. The overall usage of the proxy server by the volunteers was very low in general. Out of the 10 volunteers whose survey response was recorded, 6 volunteers watched less than 11 videos using the proxy server. This means that watch history size of user was thus not large enough for content/collaborative filtering-based recommendations. The low volunteer group size was also not beneficial. As a result, most of the recommendations made by the recommendation algorithm were favorite category-based recommendations. Figure 6 and 7 show the response pie chart for the survey conducted across 10 volunteers. Almost all of the volunteers said they actively watched YouTube videos with the major source of these videos being videos posted by friends on social networking websites. Since, we cannot track these video accesses through the proxy server logs, our watch history size was further reduced. 80% the users responded that they used the proxy server only sometimes or rarely while watching YouTube videos. The reason for this can be concern for privacy and lack of incentive to use the proxy server. Another reason can be that the volunteers forgot to use the browser connected to the proxy server while watching the YouTube videos.
6 CONCLUSION:
In this paper we presented an extensive data-driven analysis on video sharing in the RenRen OSN. Our measurement showed that videos exhibit different popularity distribution pattern compared with that in VSSes. Particularly, it shows much more popularity skewness in the OSN. we studied in detail an important aspect of video sharing sites: the external links. The external links provide a unique way for the VOD sites to penetrate into other websites. We observed that the external links can play a non-trivial
quite different impact on YouTube and Youku. We studied the external links for different video categories. We also discussed the correlations of the external links and the internal related.video links. We showed that the number of internal related videolinks have less impact on the external links than the total views of the video. We believe that our work can provide the foundation for the VOD sites to make more targeted advertisement, customized user development, etc. We further developed a model to simulate the video spreading process in OSNs, and validated that the OSN-based spreading mechanism is the fundamental reason under such new video popularity distribution. We also made some preliminary measurement on the video popularity evolution in OSNs and revealed some distinctive features, such as the randomness,unpredictability, and multiple peaks.
REFERENCES
[1] R. Zhou, S. Khemmarat, and L. Gao, “The impact of youtube recommendation system on video views,”
inProc. of IMC 2010, Melbourne, November 1-3 2010.
[2] M. Cha, H. Kwak, P. Rodriguez, Y.-Y. Ahn,
andS. Moon, “I tube, you tube, everybody
tubes:analyzing the world’s largest user generated contentvideo system,” in Proc. of ACM IMC, San
Diego,California, USA, October 24-26 2007, pp. 1–
14.
[3] R. Crane and D. Sornette, “Viral, quality, and
junk videos on YouTube: Separating content from noise in an information-rich environment,” in Proc.
of AAAI symposium on Social Information Processing, Menlo Park, California, CA, March 26-28 2008.
[4] P. Gill, M. Arlitt, Z. Li, and A. Mahanti,
“YouTube traffic characterization: A view from the
edge,” inProc. of ACM IMC, 2007.
[5] A. Fuxman, P. Tsaparas, K. Achan, and R.
Agrawal, “Using the Wisdom of the Crowds for Keyword Generation", In Proc. ACM WWW’08, Beijing, China,April 21 - 25, 2008.
[6] S. Goel, R. Muhamad, and D. Watts, “Social Search in “Small-World”Experiments”, In Proc.
October 24-26, 2007.
[8] J. Kunegis, A. Lommatzsch, and C. Bauckhage,
“The Slashdot Zoo: Mining aSocial Network with Negative Edges”, In Proc. ACM WWW’09, Madrid, Spain,April 20-24, 2009.
[9] K. Lai and D. Wang “A Measurement Study of External Links of YouTube”, In Proc. IEEE
Globecom’09, Hawaii, USA, November 30
-December 4th, 2009.
[10] K. Lai and D. Wang “The Implication of
External links on Video Sharing Sites: Measurement
and Analysis”, Technical Report, Department of Computing, TheHong Kong Polytechnic University, Jan, 2010.
[11] Haitao Li, Haiyang Wang, Jiangchuan Liu Video Sharing in Online Social Networks: Measurement and Analysis 2013.
AUTHORS:
DEVAKI SRAVANI is a student of Computer Science Engineering from Dr. Samuel George Institute of Engineering & Technology, Presently pursuing M.Tech (CSE) from this college. He received B.Tech from JNTUK in the year Of 2012.
Anantha Rao .G is a Associate Professor of Dr.Samuel George Institute of Engineering & Technology ,MARKAPUR.He received M.Tech in Software Engineering from JNTU Kakinada University..He gained 6years Experience on Teaching . He is a good
Researcher in Image Processing, Algorithms’,
![thokth fo ofo ky;]xokfy;j](data:image/gif;base64,R0lGODlhAQABAIAAAP///wAAACH5BAEAAAAALAAAAAABAAEAAAICRAEAOw==)