KTH TECHNICAL REPORT TRITA-EE 1653-5146 2012:021; URN:NBN:SE:KTH:DIVA-93680; SUBMITTED FOR PUBLICATION. 1
Dynamic Resource Allocation with
Management Objectives—
Implementation for an OpenStack Cloud
Fetahi Wuhib, Rolf Stadler and Hans Lindgren
ACCESS Linnaeus Center, KTH Royal Institute of Technology
{fetahi,stadler,hanlind}@kth.se
May 23, 2012
Abstract—We report on design, implementation and evaluation of a resource management system that builds upon OpenStack, an open-source cloud platform for private and public clouds that is rapidly gaining acceptance in industry. Our implementation supports an Infrastructure-as-a-Service (IaaS) cloud and cur-rently provides allocation for computational resources in support of interactive as well as computationally intensive applications. The design supports an extensible set of management objectives between which the system can switch at runtime. We demonstrate through examples how management objectives related to load-balancing, energy efficiency and service differentiation can be mapped onto the controllers of the resource allocation subsystem, which attempts to achieve an activated management objective at all times. The design is extensible in the sense that addi-tional objectives can be introduced by providing instantiations for generic functions in the controllers. Our implementation monitors the fulfillment of the relevant management metrics in real time. Testbed evaluation demonstrates the effectiveness of our approach in a dynamic environment. It further illustrates the trade-off between closely meeting a specific management objective and the associated cost of VM live-migration.
Index Terms—Cloud management, performance management, management objective, dynamic resource management, Open-Stack
I. INTRODUCTION
The paper reports on design, implementation and evalua-tion of a resource management system that builds upon the OpenStack cloud platform. The focus is on managing an
Infrastructure-as-a-Service (IaaS) cloud, which makes ICT infrastructure available to customers in a virtualized way, including computation in form of virtual machines (VMs), storage in form of virtual disks, for instance, and networking in form of virtual switches, for example. IaaS cloud services are offered by an increasing number of providers, whereby Amazon and RackSpace are probably the most well-known. IaaS cloud environments have proved suitable for running interactive applications, such as websites and social networks, analytics frameworks like MapReduce or media streaming services, such as audio or video on-demand services.
The IaaS service model has two principal stakeholders: the
IaaS providerwho owns and operates the cloud infrastructure and the customers who run their applications on the cloud. (If an IaaS customer, runs a web site, for instance, it has its own customer base that consumes cloud resources through the site.) Customers typically have service level agreements
(SLAs) with the provider, which specify how their applications are executed and which cloud resources are available to them. The termprivate cloudis used for a cloud where the provider and its customers belong to the same organization. Otherwise the termpublic cloud is used.
The IaaS provider defines strategies according to which resources for computation, storage and networking of the cloud infrastructure are allocated to the customers’ applications. Such strategies are expressed as management objectives, and the goal of this paper is to devise capabilities that enforce system-level management objectives on an IaaS cloud. There exists a large variety of possible management objectives, depending on the type of customers that are served, the kind of applications that are run, the characteristics of the underlying physical infrastructure, and the business strategy the provider pursues. Our goal is to contribute towards a generic solution to the cloud management problem. We believe that a cloud management system must be flexible to support a wide range of provider-defined objectives.
On a functional level, management objectives are achieved through controlling the resource allocation process, which is the task of performance management. As the external load on a cloud changes over time, resource allocation must adapt to continuously meet the activated management objective. This means that the management system must continuously monitor resource utilization and dynamically adjust resource allocations.
In this paper, we present an architecture for IaaS perfor-mance management and discuss an initial implementation, which is built on OpenStack. The key building blocks are a set of controllers that allocate resources to applications and cooperate to achieve an activated management objective. The controller designs contain generic components that must be instantiated for a specific management objective. We evaluate a prototype implementation regarding efficiency and cost for three specific objectives. The work reported here focuses on computational resources only, and the inclusion of storage and networking resources is currently under investigation.
Compared to commercial cloud management software, our implementation is flexible and open, as it is designed to facilitate adding new management objectives. Our work is complementary to many recent and current research activities in cloud resource allocation, which center around formalizing
and solving a specific resource allocation problem and produce a specific resource allocation solution for a specific controller (like the VM placement controller). This paper, in contrast, is system-oriented and focuses on how to design and implement a system of collaborating controllers, in order to achieve system-level management objectives in a dynamic environment.
The paper is organized as follows. Section II introduces our architecture for performance management of an IaaS cloud. Section III gives background information on OpenStack and how it is used in our work. Section IV describes the realization of our management architecture for an OpenStack cloud, and we present its evaluation in Section V. Section VI discusses related work, and Section VII concludes the paper by summarizing our contributions and outlining future plans.
II. PERFORMANCEMANAGEMENT OF ANIAAS CLOUD
Performance management can be understood as the man-agement of the resource allocation process [1]. The task of performance management is to satisfy the customers by conforming to SLAs and, at the same time, to satisfy the provider by achieving management objectives when allocating resources. Building a performance management capability requires defining metrics that express to which extent specific management objectives are achieved and instrumenting the managed system such that SLA compliance and performance metrics can be continuously monitored.
The managed system, i.e., the cloud environment (some-times simply referred to as cloud), includes a potentially large number of physical servers for computational tasks, com-plemented with storage devices, and communication devices, which enable communication within the cloud as well as with the outside world.
Management objectives define the strategies according to which resources are allocated to applications. Many cloud management implementations support some form ofbalanced load objective, whereby the computational resources of the cloud are allocated in such a way that CPU and, sometimes, memory utilization is balanced across servers. Operating the cloud under such an objective often increases the chance to cope with unforeseen spikes in application demand. Another objective relates to minimizing power consumption of the cloud while still conforming to the customer’ SLAs. This is typically achieved through server consolidation, whereby a minimal number of servers handles the load, while the remaining servers are put on standby (consuming little or no power). A well-studied class of management objectives relates to fair resource allocation, an example of which is allocating resources to applications proportional to an ap-plication’s demand (e.g., [2]). A further, important class of management objectives involves support for differentiation among different classes of cloud service. In Section IV, we discuss a specific example of service differentiation, whereby a guaranteed service class and a best-effort class are supported on the same cloud infrastructure. Clearly, a provider may want to satisfy several management objectives at the same time, or switch between objectives depending on the load pattern. For example, a provider may operate the cloud infrastructure under
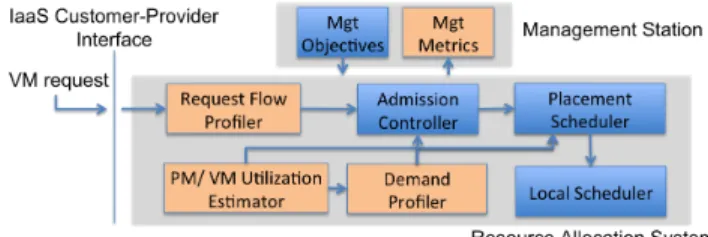
Fig. 1. IaaS Performance Management: Components and Information Flow. (Light colored- monitoring, dark, control)
the combined objective of enabling service differentiation and minimal energy consumption, or a provider may switch from balanced load to minimizing power consumption after office-hours.
Formalizing the problem of performance management for an IaaS cloud and finding a resource allocation that meets one or more management objectives is an active and im-portant research topic, but goes beyond the scope of this paper. Generally, finding an allocation that meets a specific management objective can be formulated as an optimization problem. Some management objectives can appear as objective functions in an optimization problem, while others can appear as constraints. Examples of constraints include the condition that communicating VMs must run on the same physical server (colocation constraint)—with the goal to increase application performance—or the condition that specific VMs must run on different physical servers (anti-colocation constraint)—-with the goal to increase the robustness of the application, for instance.
Fig. 1 shows our architecture for performance management of an IaaS cloud environment. The lower part of the figure con-tains the components of the resource allocation system which is part of the IaaS cloud infrastructure. The upper part shows a management station which sets the management objectives controlling the resource allocation process and monitors the performance metrics. The light-colored components in Fig. 1 contain functions related to state estimation and prediction, while the dark-colored components contain controllers. The light-colored components produce state estimations and de-mand predictions, which are consumed by the controllers.
When a customer submits a request to a provider for running an application in one or several VMs, the request is received by the Admission Controller, which either accepts or rejects it. In case the request is accepted, the Placement Scheduler
selects, for each involved VM, the server that executes it. The
Local Scheduler on that particular server then schedules the VM for execution. Note that all three controllers make their decisions based on the currently active management objective and state of the system. Three components monitor and predict the system state: theRequest Flow Profilercharacterizes VM request statistics, the PM/VM Utilization Estimator monitors the utilization of physical as well as virtual machines, and the Demand Profiler characterizes the VM resource demand. During operation of the cloud, the demand for a specific application may vary or the resource capacity of the entire cloud may change, due to failures or maintenance procedures, for instance. For this reason, resource allocation must be adaptive, which implies that the Placement Scheduler and
the Local Scheduler dynamically reallocate resources to the VMs, in order to continue following a management objective. Reallocation may include moving VMs between servers.
III. OPENSTACK—ANOPEN-SOURCECLOUDPLATFORM
OpenStack [3] is an open-source cloud computing platform for both private and public clouds. The OpenStack project was announced in July of 2010 by Rackspace and NASA, who made the initial code contributions. Since then, more than 150 companies have announced their support for the project, and an active developer community is making OpenStack a de-facto standard in cloud computing.
The OpenStack software consists of several independently-developed components with well-defined APIs. The core com-ponent that provides IaaS functionality (similar to Amazon EC2) is OpenStack Compute (also called Nova). It handles provisioning and life-cycle management of VMs and supports most available hypervisors. Further components are Object Storage, a scalable storage service similar to Amazon S3, Im-age Service for imIm-age manIm-agement, Identity for authentication, Dashboard, a web-based GUI, primarily for starting/stopping VMs and managing user/group configurations, and Network for building virtual network topologies that live on top of hardware from different vendors.
The implementation described in this paper is based on the Diablo release of the OpenStack distribution. Our implemen-tation currently uses the components Compute, which we have extended for our purposes, and Image Service for managing VM images.
IV. DESIGN ANDIMPLEMENTATION OF THE
PERFORMANCEMANAGEMENTARCHITECTURE IN
OPENSTACK
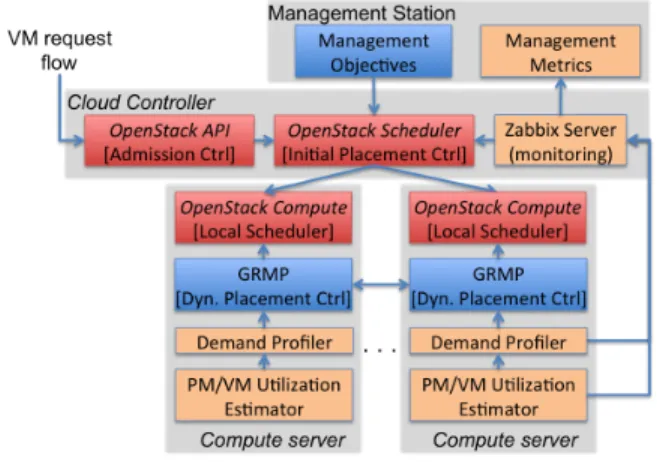
Fig. 2 shows the realization of our performance management architecture (Fig. 1) in an OpenStack cloud. Fig. 2 includes an OpenStack cloud controller, which is a physical server that runs the OpenStack Scheduler and API components, and a potentially large number of OpenStack compute servers, each of which runs an OpenStack Compute component. The components in Fig. 1 are realized as follows. The functionality of the Admission Controller is realized in the OpenStack API and the OpenStack Scheduler components (Fig. 2). The Placement Scheduler is split into two controllers: the Initial Placement Controller running in the OpenStack scheduler, which performs the initial placement of a VM, and the Dynamic Placement Controller in the compute servers, which adapts the placement over time through live-migration of VMs. The functionality of the Local Scheduler is performed by the OpenStack Compute component in each compute server. Regarding the components that perform estimation and prediction, the Request Flow Profiler is placed in the cloud controller while the Demand Profiler and the PM/VM Utilization Estimator run on each compute server.
We now provide some details about specific components in our implementation. The Request Flow Profiler is currently not implemented.
Fig. 2. Realization of the performance management architecture in Open-Stack. Names in italic refer to OpenStack terms while gray enclosures represent servers.
The PM/VM Utilization Estimator monitors the utilization of computational resources of the server and each VM. The server utilization is obtained through an operating system in-terface (/proc) and the VM utilization through thelibvirt library. The output of this component is consumed by Demand Profiler as well as the Initial and Dynamic Placement Con-trollers. The Demand Profiler component predicts the resource utilization of the VMs. The current implementation uses a moving-average forecaster that returns the utilization of the VM over the last two minutes.
When a VM is launched on a compute server, as directed by a placement controller, the Local Scheduler creates a disk image for the VM and calls the hypervisor to boot the VM. Parameters to this call may include the type of the (virtual) CPU, the number of cores, the amount of memory, the hard disk image to boot from, and the local CPU allocation policy. The degree of control of allocating computational resources to specific VMs depends on the hypervisor an implementation uses. In the case of Xen and VMware ESX Server, for example, a guaranteed resource level, together with a priority level for shared resources, can be specified for each VM. In the case of KVM, which our implementation currently uses, CPU resources are multiplexed, and differentiation among VMs can be achieved through setting different priorities to processes that run VMs.
The Initial Placement Controller selects the compute server on which a VM is to be launched. In our implementation, we are using the OpenStack least-cost scheduler for this purpose. This scheduler contains two generic functions (Fig. 3a), a filter function that selects the set of compute servers capable of running a given VM and a cost function that ranks the filtered set of servers according to their suitability. These functions need to be instantiated to support a specific management objective.
The Dynamic Placement Controller (Fig. 3b) continuously adapts the placement of VMs through live-migration. Such a function is needed in a dynamic cloud environment, where the load on a server can significantly change over time (e.g., due to changes in demand of individual VMs, VMs starting and terminating, etc.), and the system thus becomes less effective in achieving the management objective. An adapted placement
(a) Initial Placement Controller (b) Dynamic Placement Controller Fig. 3. Design of the two controllers that implement the Placement Scheduler.
then results in the system state moving back to a desired region. The controller is realized in a distributed way using a gossip protocol called GRMP, which we developed in earlier work [4]. GRMP implements a generic scheme for resource allocation which can be instantiated for various management objectives. The protocol, whose pseudocode is given in Al-gorithm 1, runs on each compute server. During execution, a server asynchronously and periodically initiates an interaction with a peer server chosen (at random) through the peer sam-plingservice. During such an interaction, the servers exchange their states (including the list of running VMs and their predicted demands) and select the VMs to be migrated from one server to the other. The functions initInstance(), choosePeer()andupdateState()in Algorithm 1 need to be instantiated to support a specific management objective. The peer sampling service is realized using a gossip protocol called CYCLON [5].
Algorithm 1 Protocol GRMP runs on each server n[4] initialization
1: initInstance()
2: start passive and active threads; active thread
1: while true do
2: read current state An
3: n0=choosePeer()
4: send(n0, An); An0 =receive(n0) 5: updateState(n0, An0)
6: execute An
7: sleep until end of round 8: end while
passive thread 1: while true do
2: read current state An
3: An0=receive(n0); send(n0, An)
4: updateState(n0, An0)
5: execute An
6: end while
We use the Zabbix monitoring software [6] with custom scripts to collect performance metrics from the compute servers. The metrics are then displayed via a web browser on the management station. Management objectives are specified through a command line interface.
The Dynamic Placement Controller, the Demand Profiler and the Utilization Estimator are implemented in a multi-threaded python application of about 1000 lines of code. The Dynamic Placement Controller uses KVM block migration to move VMs between servers. (Block migration is a form of live-migration where the disk image of the VM is migrated along
with its operational state. It does not require shared storage.) We now give three specific examples of global manage-ment objectives and how they can be mapped to the four controllers of the management system. Note that there exist many variations of these management objectives which will require slightly different mappings. A summary is displayed in Fig. 4.
Balanced load: The objective is to allocate the com-putational resources of the cloud to VMs in such a way that the CPU utilization is balanced across all servers. In case of overload, i.e., if the aggregate CPU demand of VMs exceeds the cloud capacity, CPU resources are allocated to VMs proportional to their demand. The controllers of the management system implement this objective as follows. (1) The Admission Controller accepts a VM request if there exists a server with sufficient available capacity to run the VM. Otherwise, the request is rejected. (2) The Initial Placement Controller places a VM on the server that minimizes the maximum predicted CPU utilization of all cloud servers. Predicted CPU utilization is computed from the CPU demand predictions for each VMs that are obtained from the Demand Profiler. (3) The Dynamic Placement Controller has the same placement objective, but realizes it through the gossip protocol. During a gossip interaction between two servers, a VM with low memory demand whose migration reduces the maximum (predicted) utilization of the two servers is migrated (this is specified inupdateState) [2]. (A VM with a low memory demand is preferred for migration, since it can be migrated faster.) (4) In case of underload, the Local Scheduler allocates resources to VMs according to their predicted demand. In overload, the resources of a server are allocated to VMs pro-portional to their predicted demand. (In our implementation, this policy is approximated by the default scheduler of the Linux kernel.)
Energy efficiency: The objective is to minimize the power consumption of the cloud while satisfying the demand of all VMs, which is achieved through server consolidation whereby servers that do not run VMs are put on standby. In case of overload, resources are allocated to VMs proportional to their respective demand. The controllers of the management system implement this objective as follows. (1) The Admission Controller accepts a VM request only if there exists a server with sufficient available capacity to run the VM. (2) The Initial Placement Controller places a VM on a server with the smallest available, but sufficient capacity. (3) The gossip protocol that implements the Dynamic Placement Controller performs server interactions as follows [4]: (a) if both servers are (predicted to be) in underload, a VM with low memory demand that will not overload the higher loaded server is migrated to the higher-loaded server; (b) if one server is in overload and one in underload, a VM with low memory demand that will not overload the lower loaded server is migrated to the lower-loaded server; (c) if both servers are in overload, they interact in the same way as for the balanced-load objective. (4) The Local Scheduler allocates resources to each VM according to predicted demand in case of underload, and proportional to predicted demand in case of overload.
Service differentiation: The objective is to support two classes of service: aguaranteed-serviceclass where each VM
m receives the resources it requires up to a capacity limit
θm and a best-effort service class where the cloud resources
not currently used by the guaranteed-service class are shared fairly among the VMs of this class. The controllers of the management system implement this objective as follows. (1) The Admission Controller accepts a VM request for best-effort service only if there exists a server with sufficient available capacity to run the VM. It accepts a VM request for guaranteed service if there exists a server with sufficient guaranteed capacity, i.e., for a VM with capacity limit θm, there exists a
server with CPU capacityΘssuch thatΘs−Pionsθi≥θm.
The request is rejected otherwise. (2) The Initial Placement Controller balances the relative aggregate capacity limits (i.e.,
1 Θs
P
ionsθi) across servers as its first priority, and it
bal-ances the predicted server utilization as its second priority. It achieves this by (a) placing a guaranteed-service VM on the server that minimizes the maximum aggregate capacity limit over all servers n(i.e., on arg minnmaxnPmonnθm)
and (b) placing a best-effort VM on the server that minimizes the maximum predicted CPU utilization over all servers. (3) The Dynamic Placement Controller attempts to balance the predicted CPU utilization across all servers. This is realized in the same way as for the balanced-load objective, except that only best-effort VMs are migrated. (4) The Local Scheduler allocates resources according to predicted demand in case of underload. During periods of overload, it first allocates all available resources to guaranteed-service VMs fairly (i.e., proportional to the predicted CPU demand of each VM); any remaining server capacity is then shared fairly among best-effort VMs. (In our implementation, this policy is approxi-mated by the scheduling policy of the Linux kernel through assigning a high scheduling priority to guaranteed-service VMs and the lowest priority to best-effort VMs.)
V. EVALUATION OF THEEFFECTIVENESS ANDEFFICIENCY OF THEIMPLEMENTATION
The cloud platform in our laboratory that we use for the evaluation comprises nine high-performance Dell PowerEdge servers, interconnected by a Gigabit Ethernet switch. Each server has two 12-core AMD Opteron processors and 64GB RAM, which creates a system with 216 cores. All servers run Ubuntu 10.04 with Linux kernel 3.0 and KVM hypervisor kvm-kmod-3.2. We use the Diablo version of OpenStack, whereby eight servers are configured as OpenStack compute servers and one as an OpenStack cloud controller (Fig. 2).
For the evaluation, we run two types of applications on the cloud platform: (1) an interactive web application called Joomla, which is configured using an Apache web-server, a MySQL database and the Joomla content management system [7], and (2) a CPU-intensive application called Pi, which runs on Debian Linux that executes a multi-process python application. The application computes the sequence of digits ofπ. We run Joomla and Pi on VMs whose configurations are given in Fig. 5.
Image Type VM Configuration
Joomla
(Interactive web app)
1 core, 1GB RAM 2 cores, 2GB RAM 4 cores, 4GB RAM 8 cores, 8GB RAM Pi (CPU-intensive app) 1 core, 256MB RAM 2 cores, 256MB RAM 4 cores, 256MB RAM 8 cores, 512MB RAM
Fig. 5. VM images and VM configurations used in the evaluation.
Load generation: Due to the lack of suitable traces that are publicly available, we use a synthetic model for generating load. The model generates VM request arrivals at a specific rate using a Poisson process, and the lifetime of a VM on the platform is drawn from a truncated exponential distribution. For each request, the type of application (Joomla or Pi) is chosen with equal probability. The VM configuration is selected with a probability that is inversely proportional to the number of cores (see Fig. 5). The load generated by the customers of a web application is changing over time and consumes, on average, some 70% of the (virtual) CPU capacity of the VM it runs on. The CPU load generated by Pi does not exceed 70% of the (virtual) CPU capacity of the VM it runs on. We evaluate the system under three load patterns: (1)low (VM) churn, whereby the VM arrival rate is 6 per hour with an average VM lifetime of 13.3 hours, (2) high (VM) churn, whereby the rate is 2 per minute with an average VM lifetime of 40 minutes and (3) no (VM) churn whereby the rate is 0 and the average lifetime is infinite. We set up the load patterns in such a way that, at any time, an average of some 80 VMs are executing on the platform.
Evaluation metrics: In each evaluation scenario, we measure the effectiveness of the resource allocation system in achieving the management objectives. Second, we measure the cost of the resource allocation system as the number of VM migrations in progress. Live-migration of VMs requires significant resources in terms of memory, CPU and storage. (Note that live-migration results in only a brief interruption in the execution of an application, and that the process of migrating a VM on our platform takes between half a minute and 8 minutes, depending on the VM configuration.)
A. Balanced-load Scenario
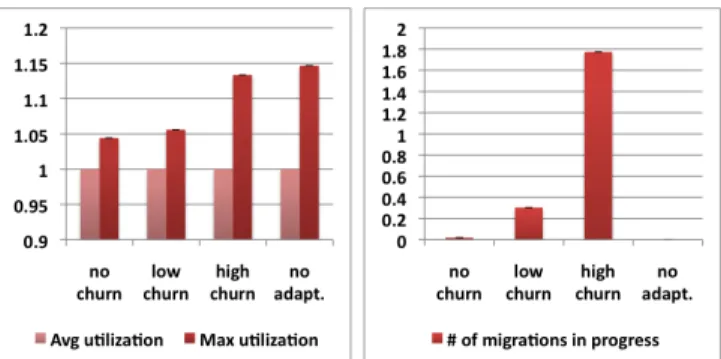
We conduct four experiments in order to evaluate the performance of the management system under the balanced load objective. During the first three experiments, we expose the system to the three load patterns described above. The fourth experiment is conducted with the high churn load pattern, and the Dynamic Placement Controller is disabled. While the goal of the first three experiments is to study the system under different load, the objective of the fourth is to understand the costs and benefits of dynamic adaptation. The controllers of the resource management system are instantiated according to the balanced load objective, as described in the second column of Fig. 4. We quantify the effectiveness of the system by measuring the maximum utilization of all servers and comparing that value to the average utilization. For each measurement run, we wait until the system is in steady state
Balanced load Energy efficiency Differentiated services (1) Admission
Controller accept VM if available ca-pacity, reject otherwise
accept VM if available capacity, reject otherwise
guaranteed: accept VM if available guaranteed capacity;
best-effort: accept VM only if available capacity
(2) Initial Placement Controller
place VM on server that minimizes the maximum utilization among servers
place VM on server with smallest un-used, but sufficient capacity
guaranteed: place VM on server that minimizes maximum of aggregate ca-pacity limits;
best-effort: place VM on server that minimizes maximum utilization (3) Dynamic
Placement Controller
move a VM from higher loaded to lower loaded server, such that maximum utilization is minimized
move a VM from lower loaded to higher loaded server without creating overload; if one server is overloaded move a VM from higher loaded to lower loaded server
move a best-effort VM from higher loaded to lower loaded server such that maximum utilization is minimized (4) Local
Scheduler
underload: as per predicted demand
overload: proportional to predicted demand
underload: as per predicted demand; overload: proportional to predicted de-mand
underload: as per predicted demand; overload: guaranteed-service VMs are prioritized, remaining capacity shared fairly among best-effort VMs
Fig. 4. Mapping management objectives to controller functionality.
Fig. 6. Measurements for the balanced load objective: efficiency metric (left) and cost metric (right).
and then measure the relevant metrics every 30 seconds for a duration of three hours.
The measurement results are presented in Fig. 6. All values are averaged over a run. Each of the four experiments produces two bars on the left, showing the average and the maximum server utilization, and one bar on the right, showing the cost of adaptation. A measure of effectiveness is the difference between the two bars in the graph on left. The values on the left graph are normalized with respect to the average utilization.
We draw three conclusions from the experiments. First, the system effectively balances the load under low or no churn. The effectiveness of the system is reduced under high churn. We expect this behavior, since the Dynamic Placement Controller runs at a specific rate, which is limited by the fact that live-migration is a resource-intensive task. Second, the migration costs are low under low churn and high under high churn. This is also expected, since, after each new placement or termination of a VM, there may be a need to adapt the placement. Third, under low churn, an increase in effectiveness through dynamic adaptation can be achieved at a low cost. However, under high churn, the cost for achieving effectiveness can become very high. This suggests that there is a churn-rate limit above which dynamic adaptation becomes too expensive. This issue warrants further investigation.
Fig. 7. Measurements for the objective of energy efficiency through server consolidation: efficiency metric (left) cost metric (right).
B. Energy-efficiency Scenario
We conduct four experiments in the same way as in the balanced-load scenario–three scenarios with different load patterns and one with high churn and having the Dynamic Placement Controller disabled. The controllers of the resource management system are instantiated according to the energy efficiency objective, as described in the third column of Fig. 4. During the experiments, we measure the effectiveness of the system by counting the number of servers that run VMs and comparing that number to a (theoretical) minimum computed as the ceiling of the aggregate CPU demand (of all VMs) divided by the capacity of a single server. For each measurement run, we wait until the system reaches steady state and then measure the relevant metrics every 30 seconds for a duration of three hours.
The measurement results are presented in Fig. 7. All values are averaged over a run. Each of the four experiments produces two bars on the left, showing the minimum needed and the actual number of servers running VMs, and one bar on the right, showing the cost of adaptation. The effectiveness metric is the difference between the bars in the graph on left.
The conclusions drawn from this experiment are similar to those obtained from the balanced-load scenario, as the mea-surement graphs display qualitatively similar properties. First, the system is effective under low churn, and the effectiveness decreases under high churn. This means that the number of
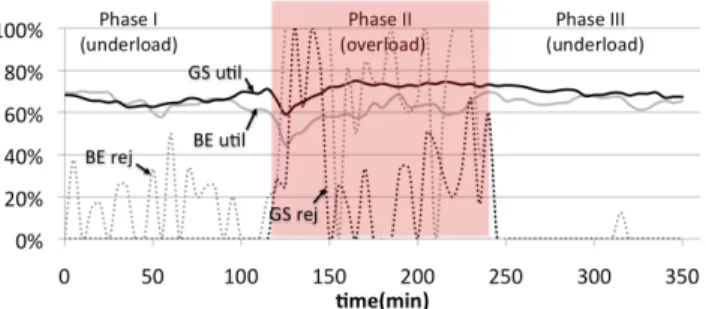
Fig. 8. Measurements for the objective of service differentiation: average CPU utilization and VM rejection rates for best-effort (BE) as well as guaranteed-service (GS) VMs.
servers that run VMs (relative to the CPU demand), is higher under high churn than under low churn. Second, for increased churn rate, the cost of achieving consolidation increases, while the effectiveness of the system in achieving the objective decreases, compared to the case where the Dynamic Placement Controller is disabled. Also here, the measurements suggest that dynamic adaptation seems cost effective only up to a certain churn rate.
C. Service-differentiation Scenario
We conduct an experiment to evaluate the effectiveness of resource allocation under a specific service differentiation objective that supports two classes of service. The controllers of the resource allocation system are instantiated according to the last column of Fig. 4. The system gives guaranteed service to the Joomla application and best-effort service to Pi. During the experiment, the system is loaded with a VM-request rate of 1.5 per minute and an average VM lifetime of 40 minutes, whereby requests for each type of application have equal probability. The average load for all VMs (guaranteed service and best effort) is about 70%. VM configurations have either two or eight cores and are taken from Fig. 5. During the experiment, the Dynamic Placement Controller is active. After the warm up period in which the system reaches steady state, the experiment is run in three consecutive phases of two hours each. During Phase I, the average CPU utilization is about 50%. At the beginning of Phase II, 14 (out of 24) cores on each compute server are disabled, reducing the CPU capacity of the cloud by some 60% and resulting in overload. At the beginning of Phase III, all cores are enabled again, and the cloud capacity becomes the same as during Phase I.
During the experiment, we measure two metrics, separately for both service classes, in order to quantify the effectiveness of the management system: the average CPU utilization and the VM request rejection rate. The measurement results are presented in Fig. 8 in form of a time-series plot for the four metrics. The utilization values are averaged over all VMs of a class.
During Phase I, the system is in underload, and the demand of each applications is satisfied. No guaranteed-service VMs are rejected and the average rejection rate for best-effort VMs is about 15%. An inspection of the measurement data from the Admission Controller reveals that all rejected VMs have an 8-core configuration. They have been rejected, because placing them at their time of arrival on any server would have violated
an 80% utilization threshold of the server. We observe that during Phase II, after the system has stabilized, the utilization of the guaranteed-service VMs is on a similar level as in Phase I, while the utilization of the best-effort VMs settles at a lower level. We also see that some guaranteed-service VMs are rejected, and best effort VMs are rejected at a higher rate. During Phase III, the system is in underload again and the difference in utilization between VMs from both classes becomes smaller. The rejection rate for best-effort VMs is smaller than during Phase I, which suggests that the system is in transient state and requires additional time to display the statistics we see in Phase I.
In summary, the experiment shows that the resource alloca-tion system effectively differentiates between the two service classes. During overload, the utilization of the guaranteed-service VMs stays (approximately) the same as during un-derload, while the utilization of best effort VMs decreases. Further, only best-effort VMs are rejected during underload, and, during overload, the rejection rate of best-effort VMs is significantly higher than that of guaranteed-service VMs. Therefore, the system gives, at all times, a better service to the guaranteed-service class than to the best-effort class.
VI. RELATEDWORK
There is little information available about the management systems of major public clouds such as those underlying Ama-zon EC2 or Microsoft Azure. However, there exist commercial cloud management systems, for which technical descriptions are available. The most advanced is probably VMWare’s VSphere [8], which is used by many IaaS providers, in-cluding CSC, Savvis, Bluelock and hosting.com [9]. The core component of VSphere’s resource management system is the Distributed Resource Scheduler (DRS), which is actually centralized despite its name. DRS supports initial and dynamic placement of VMs to achieve management objectives related to load balancing and energy efficiency. Compared to our work, DRS is closed and does not support user-defined management objectives. Furthermore, it is limited to a cluster of 32 servers due to its centralized design.
Similar in functionality to VSphere is the Virtual Machine Manager (VMM) component Microsoft Systems Center [10]. The core functionality of VMM’s resource allocation system is implemented by two components: an‘intelligent placement’ component (equivalent to the Initial Placement Controller in our work) and a ‘dynamic optimization’ component (equiva-lent to the Dynamic Placement Controller). VMM supports load balancing and energy efficiency objectives. Similar to DRS, VMM does not allow users to define management objectives. Furthermore, an installation supports a cluster of up to 16 servers.
Like OpenStack, other open-source cloud management sys-tems, such as OpenNebula [11] and Nimbus [12], support user-defined policies for the initial placement of VMs. For instance, the OpenNebula Match-making Scheduler allows defining requirements and rank expressions that have a similar purpose as the cost and filter functions in OpenStack (Fig. 3a). However, all open-source cloud management systems we have studied do not directly support dynamic VM placement.
Many recent works on resource allocation in clouds focus on computing allocations for specific management objectives, such as energy efficiency ([13], [14], [15]), fairness ([16], [2]) and service differentiation [17]. However, there are also approaches where generic solutions are developed for different objectives ([4], [18], [19]). All of the above works however deliver placement solutions. They do not consider the design of controllers and the fact that achieving management objectives generally requires the cooperation of several controllers of different type with coordinated policies.
VII. DISCUSSION
With this paper we make the following contributions. First, we present a management architecture for an IaaS cloud, which supports dynamic resource allocation with management objectives. Three critical components of this architecture are the VM Admission Controller, the VM Placement Scheduler (implemented as two separate controllers) and the VM Lo-cal Scheduler. Second, the implementation design includes modular and extensible components that can be refined to realize specific management objectives, which we illustrate with three examples. Third, the implementation is realized as an extension of the OpenStack cloud platform, so that all OpenStack installations can take advantage of the management capabilities our implementation provides. Finally, a prototype evaluation shows the effectiveness of our implementation in achieving objectives related to load balancing, energy efficiency and service differentiation under changing load. Dynamic placement of VMs can significantly increase the effectiveness of achieving a management objective. However, the cost of effectiveness increases with the level of VM churn and can become prohibitive in a highly dynamic system.
While our current implementation only covers computa-tional resources, there is a clear need to extend the work towards including storage and networking resources, which we plan to address in future work. While the currently available commercial implementations are limited to a small number of servers (32 in the case of VSphere), and available designs of centralized controllers scale up to 103–104servers, we believe that future cloud management implementations should support much larger configurations, perhaps in the order of 105–106 servers. In fact, the Dynamic Placement Controller in our implementation scales to such a size due to its distributed design [2]. We plan to decentralize other components of our architecture in a similar way. For an OpenStack implementa-tion to scale, however, several issues inherent to OpenStack must be addressed, for instance, the bottlenecks introduced by a centralized database (shared among all OpenStack compo-nents) and a centralized messaging queue.
Acknowledgments: This work has been supported in part by the EC 7th Framework SAIL project, the EIT RMAC project and Ericsson Research.
REFERENCES
[1] H.-G. Hegering, S. Abeck, and B. Neumair, Integrated management of networked systems: concepts, architectures, and their operational application. San Francisco, CA, USA: Morgan Kaufmann Publishers Inc., 1998.
[2] F. Wuhib, R. Stadler, and M. Spreitzer, “A gossip protocol for dynamic resource management in large cloud environments,”Network and Service Management, IEEE Transactions on, 2012.
[3] OpenStack, “http://www.openstack.org,” April 2012.
[4] R. Yanggratoke, F. Wuhib, and R. Stadler, “Gossip-based resource allo-cation for green computing in large clouds,” inInternational Conference on Network and Service Management, October 2011.
[5] S. Voulgaris, D. Gavidia, and M. van Steen, “CYCLON: Inexpensive membership management for unstructured p2p overlays,” Journal of Network and Systems Management, vol. 13, no. 2, pp. 197–217, 2005. [6] Zabbix Monitoring Solution, “http://www.zabbix.com/,” April 2012. [7] Joomla! Content Management System, “http://www.joomla.org/,” April
2012.
[8] VMware VSphere, “http://www.vmware.com/products/vsphere/ overview.html,” April 2012.
[9] L. Leong and T. Chamberlin, “Magic quadrant for public cloud in-frastructure as a service,” December 2011, http://www.gartner.com/ technology/reprints.do?id=1-18BON1E&ct=111214.
[10] Microsoft Systems Center, “http://www.microsoft.com/systemcenter/,” April 2012.
[11] OpenNebula, “http://www.opennebula.org/,” April 2012. [12] Nimbus, “http://www.nimbusproject.org/,” April 2012.
[13] A. J. Younge, G. von Laszewski, L. Wang, S. Lopez-Alarcon, and W. Carithers, “Efficient resource management for cloud computing environments,” inProceedings of the International Conference on Green Computing. Chicago, IL: IEEE, Aug 2010.
[14] C.-T. Yang, K.-C. Wang, H.-Y. Cheng, C.-T. Kuo, and W. Chu, “Green power management with dynamic resource allocation for cloud vir-tual machines,” inHigh Performance Computing and Communications (HPCC), 2011 IEEE 13th International Conference on, sept. 2011, pp. 726 –733.
[15] A. Beloglazov and R. Buyya, “Energy efficient resource management in virtualized cloud data centers,” inCluster, Cloud and Grid Computing (CCGrid), 2010 10th IEEE/ACM International Conference on, may 2010, pp. 826 –831.
[16] G. Wei, A. V. Vasilakos, Y. Zheng, and N. Xiong, “A game-theoretic method of fair resource allocation for cloud computing services,” J. Supercomput., vol. 54, no. 2, pp. 252–269, Nov. 2010.
[17] J. Rao, Y. Wei, J. Gong, and C.-Z. Xu, “Dynaqos: model-free self-tuning fuzzy control of virtualized resources for qos provisioning,” in
Proceedings of the Nineteenth International Workshop on Quality of Service, ser. IWQoS ’11. Piscataway, NJ, USA: IEEE Press, 2011, pp. 31:1–31:9.
[18] J. Z. Li, M. Woodside, J. Chinneck, and M. Litoiu, “Cloudopt: multi-goal optimization of application deployments across a cloud,” in Pro-ceedings of the 7th International Conference on Network and Services Management, ser. CNSM ’11, 2011, pp. 162–170.
[19] Y. Yazir, C. Matthews, R. Farahbod, S. Neville, A. Guitouni, S. Ganti, and Y. Coady, “Dynamic resource allocation in computing clouds using distributed multiple criteria decision analysis,” in IEEE International Conference on Cloud Computing, July 2010, pp. 91 –98.