DYNAMIC EFFECTS OF MUTATIONS IN EGLIN C
by
Michael Clarkson
A dissertation submitted to the faculty of the University of North Carolina at Chapel Hill in partial fulfillment of the requirements for the degree of Doctor of Philosophy in the Department of Biochemistry and Biophysics.
Chapel Hill 2005
Approved by:
Advisor: Andrew Lee Reader: Gary Pielak
ABSTRACT
MICHAEL CLARKSON: Dynamic Effects of Mutations in Eglin c (Under the direction of Andrew Lee)
ACKNOWLEDGEMENTS
TABLE OF CONTENTS
LIST OF TABLES . . . viii
LIST OF FIGURES . . . ix
LIST OF ABBREVIATIONS AND SYMBOLS . . . xii
INTRODUCTION . . . 1
CHAPTER I. Contiguous Network Responses . . . 7
Introduction . . . 7
Methods . . . 8
Expression and Purification . . . 8
NMR Data Acquisition and Processing . . . 9
NMR Relaxation Studies . . . 12
Chemical Denaturation Studies . . . 14
Results and Discussion . . . 16
Structural Effects . . . 16
Backbone Dynamics . . . 19
Side-Chain Dynamics . . . 23
Contiguity of Responses . . . 36
Energetic Connectivity . . . 41
Conclusions . . . 44
Introduction . . . 45
Methods . . . 46
Results and Discussion . . . 46
Dynamic Effects . . . 46
Structural Effects . . . 50
Unifying Features . . . 53
Reciprocity in Dynamics . . . 54
III. Structural Responses . . . 58
Introduction . . . 58
Methods . . . 59
Assignment and Conditions . . . 59
Alignment Tensors . . . 59
Activity Assays . . . 60
Results and Discussion . . . 61
V63A* Structure and Dynamics . . . 61
R53 Mutation Structural Effects . . . 64
Dynamic Effects in R53 Mutants . . . 69
Conclusions . . . 74
Conclusions from Mutational Experiments . . . 75
Perspective . . . 77
IV. Polymerase µ BRCT Domain . . . 82
Introduction . . . 82
LIST OF TABLES
Table Page
1. Major rotamer populations for the V18 and V52 side-chains in
LIST OF FIGURES
Figure Page
1. Sequence and secondary structure of WT* eglin c . . . 4
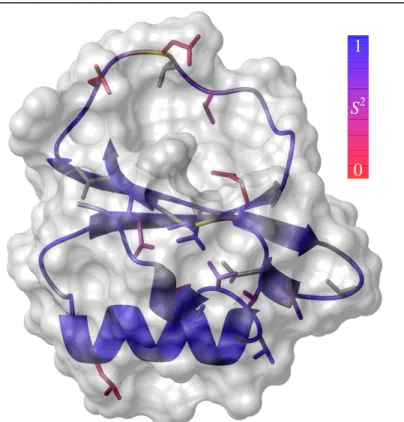
2. Structure of eglin c displaying molecular surface and WT* order parameters . . . 5
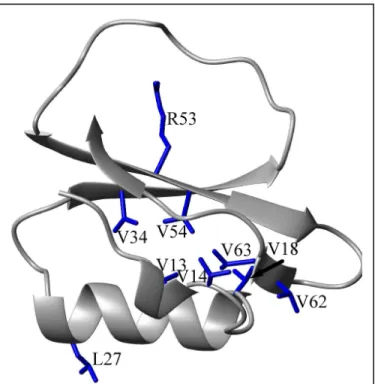
3. Structure of eglin c with mutation sites highlighted . . . 6
4. Comparison of RDC values between different preparations of WT* protein and bicelles . . . 16
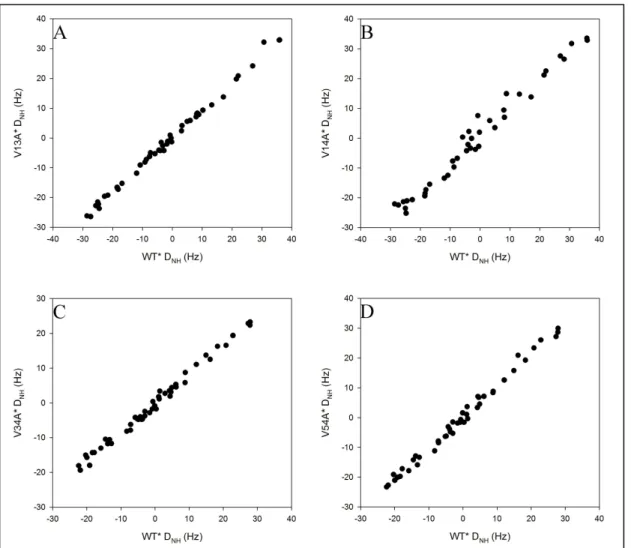
5. Direct comparisons of RDCs from V13A*, V14A*, V34A*, and V54A* eglin c to WT* . . . 17
6. Chemical shift comparisons between WT* and mutant proteins . . . 18
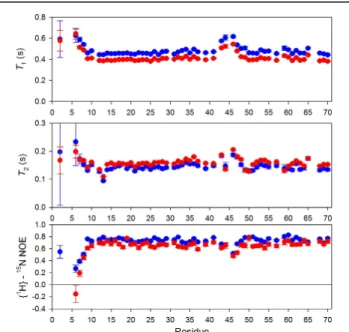
7. Relaxation data for WT* eglin c . . . 19
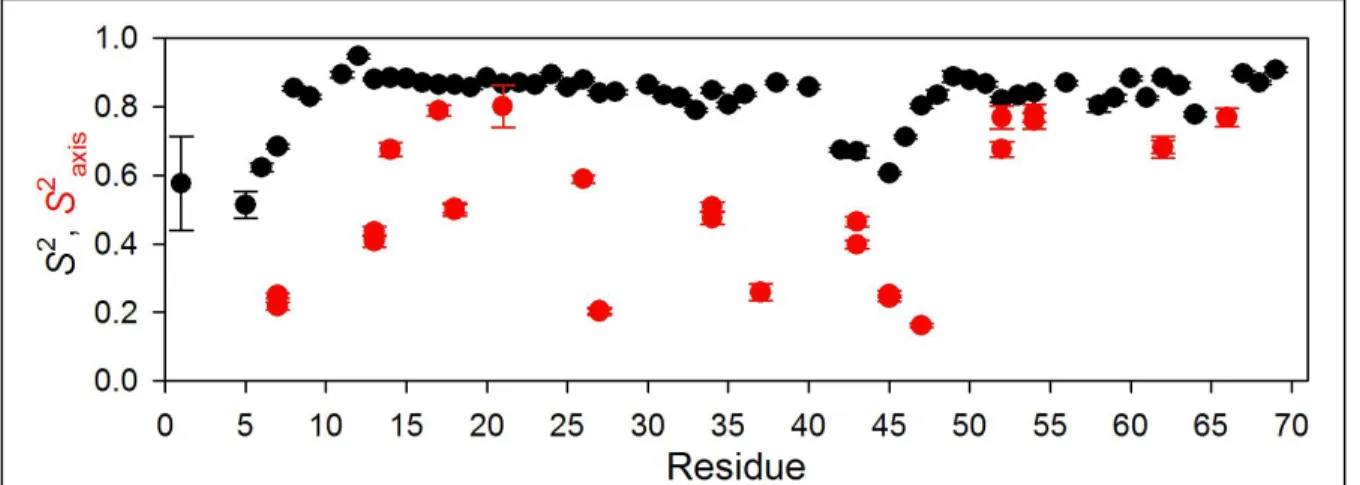
8. Backbone and side-chain order parameters of WT* eglin c . . . 20
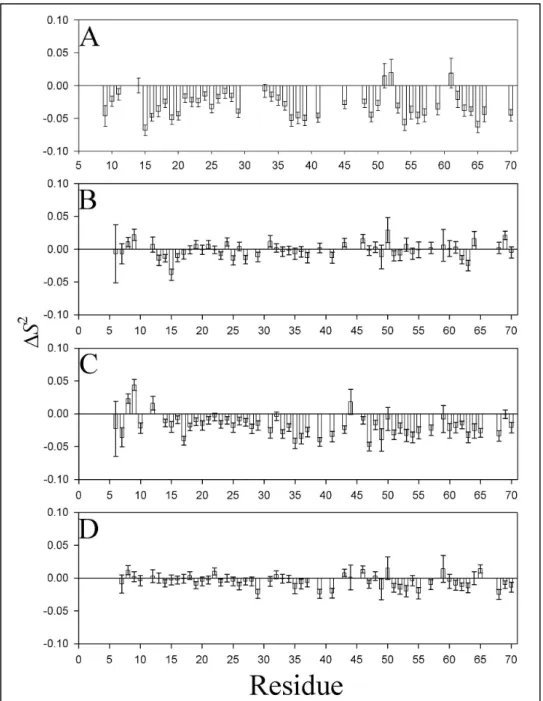
9. Change in backbone order parameters for eglin mutants . . . 21
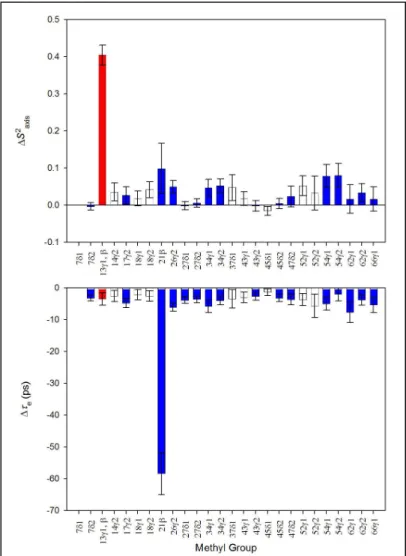
10. Changes in side-chain dynamics for V13A* . . . 24
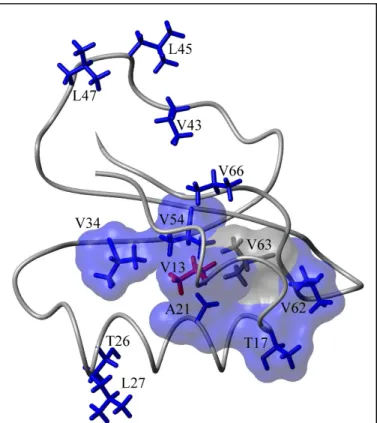
11. Side chains showing a dynamic response to the V13A mutation . . . 25
12. Side-chain dynamics changes in V14A* . . . 27
13. Side chains with a dynamic response to the V14A mutation . . . 28
14. Side-chain dynamics changes in V34A* . . . 29
15. Side-chain dispositions in the core of eglin c . . . 31
16. Side chains responding to the V34A mutation . . . 32
17. Side-chain dynamics changes in V54A* eglin c . . . 33
18. Side chains with a dynamic response to the V54A mutation . . . 34
19. Side-chain dynamics changes in V63A* eglin c . . . 38
21. Changes in backbone and side-chain dynamics parameters for V62A* eglin c . . . . 47
22. Side chains responding to the V62A mutation . . . 47
23. Backbone and side-chain dynamics changes in V18A* . . . 48
24. Side chains experiencing dynamic changes in response to the V18A mutation . . . . 49
25. Direct comparisons of V18A* and V62A* RDCs to WT* RDCs . . . 50
26. Residuals plotted and mapped onto the structure for V18A* . . . 51
27. Residuals plotted and mapped onto the structure for V62A* . . . 52
28. Structural context of V18 and V62 . . . 53
29. Chemical shift changes plotted and mapped onto the structure for V63A* . . . 62
30. Changes in backbone order parameters for V63A* eglin c . . . 62
31. Direct comparison of V63A* RDCs with WT* . . . 63
32. Changes in chemical shift for R53Q* and R53A* . . . 64
33. Chemical shift changes in eglin c due to the R53A mutation . . . 65
34. Direct comparison of R53A* and WT* RDC values . . . 66
35. Comparison of predicted and observed RDCs for WT* and R53A* eglin c . . . 67
36. Backbone dynamics changes in R53Q* and R53A* . . . 70
37. Side-chain dynamics changes in R53Q* and R53A* eglin c . . . 71
38. Surface diagram for R53Q* eglin c . . . 72
39. Surface diagram for R53A* eglin c . . . 73
40. Sequence and secondary structure of the Polymerase m BRCT domain . . . 84
41. Relaxation data for BRCT at 500 and 600 MHz . . . 85
42. Structure of BRCT domain with S2 mapped onto it . . . 85
44. Main window of relax_extract.tcl . . . 91
45. Error messages and unc.in file . . . 91
46. Residue selection window . . . 92
47. rvi main window in relaxation mode . . . 93
48. Primary and secondary data selection windows . . . 94
49. Data selection window in rvi . . . 95
50. Confirmation window . . . 96
51. Overall and residue-specific model selection windows . . . 97
LIST OF ABBREVIATIONS AND SYMBOLS AAPF – n-Succinyl Ala Ala Pro Phe p-nitroanilide
1 – First side-chain torsion angle 2 – Measure of goodness of fit
CI-2 – Chymotrypsin Inhibitor 2 Gi – Free energy of interaction
Gu – Free energy of unfolding
GuHCl – Guanidinium hydrochloride
JCC – Three-bond scalar coupling between carbonyl C and C JNC – Three bond scalar coupling between amide N and C
NMR – Nuclear Magnetic Resonance NOE – Nuclear Overhauser Effect PDB – Protein Data Bank
RDC – Residual Dipolar Coupling
S2 – Generalized Lipari-Szabo order parameter
S2axis – Axial Lipari-Szabo order parameter
e – Effective internal correlation time m – Global rotational correlation time
INTRODUCTION
Proteins use cooperative processes to fold and function. Because these events require many amino acids to work in concert, it is necessary to understand how residues influence each other in order to comprehend these protein behaviors (Luque et al., 2002; Yu and Koshland Jr., 2001). Significant progress has been made in explaining the interactions of adjacent residues, but little has been done on residues that lie far apart within a molecule. Evolutionary studies have indicated that proteins share energy through sparse internal networks of residues in at least some cases, but these experiments do not shed light on the mechanism by which energy is conveyed (Lockless and Ranganathan, 1999; Suel et al., 2003). There are well-known cases, such as that of hemoglobin, in which communication between distal loci can be explained by conformational change (Perutz, 1970). In many instances, however, a structural rationale is not apparent (Mace et al., 1995; McElroy et al., 2002; Meroueh et al., 2002; Ohtaka et al., 2003; Rajagopalan et al., 2002). A deeper understanding of the means by which energy is distributed and relocated within a protein is necessary to advance our understanding of diverse behaviors such as allostery, folding, and ligand specificity.
(Fuentes et al., 2004) and SH2 (Finerty et al., 2002) domains. The reactions have included residues as far as 21 Å from the binding pocket, even though these proteins are not allosteric systems in the classical sense. Mutational experiments have demonstrated similar effects. Dynamics studies in protein L indicated significant changes in slow side-chain dynamics at sites distant from point mutations (Millet et al., 2003). An R A mutation in chymotrypsin inhibitor 2 (CI-2) caused a dynamic change at a tryptophan 13 Å away (Leatherbarrow and Matthews, 1992). The experimental results are supported by theoretical work; molecular dynamics experiments have also demonstrated distal dynamic effects in response to perturbations (Ceruso et al., 2003; Ichiye and Karplus, 1991). In sum, these observations indicate that long-range dynamic responses should be expected, not surprising, when a protein is perturbed.
In some cases, the phenomena of energetic propagation and dynamic response have similar properties. The energetic networks within proteins are sparse and contiguous (Lockless and Ranganathan, 1999; Suel et al., 2003). This also appears to be true of at least some observed dynamic responses, particularly in the PDZ domain (Fuentes et al., 2004) and also in the case of SH2. These similarities suggest the possibility that the two phenomena are related. A priori, dynamic effects reflect the presence of energetic interactions. However, long-range dynamic responses have never been shown to coincide with clear energetic linkages, nor have they been definitively associated with networks within a protein.
N-H vectors. The main chain alone, therefore, is unlikely to provide an efficient means for transmitting motion within a protein. By contrast, the order parameter of the methyl 3-fold symmetry axis (S2axis), which has a range and meaning identical to the normal S2, varies
considerably within a given folded protein for alanines, valines, leucines, isoleucines, methionines, and threonines (Constantine et al., 1998; Lee et al., 1999; Mittermaier et al., 1999; Mittermaier et al., 2003). These order parameters have been shown to range from near 0 to more than 0.9, even among residues that are packed into a hydrophobic core (Constantine et al., 1998; Johnson and Handel, 1999; Mittermaier et al., 1999; Wand et al., 1996; Wand, 2001). In order to accommodate this wide range of motion in the comparatively rigid framework of the backbone it is likely that side chain movements are correlated. Molecular dynamics simulations and normal mode analysis support the idea of correlated motions as a means for dynamically linking distal sites (Ceruso et al., 2003; Radkiewicz and Brooks, 2000; Showalter and Hall, 2002; Young et al., 2001). This might provide a mechanical means for energy transmission.
Though the wide range of values suggests that side chains may serve as a conduit for dynamic transmission, the nature of the order parameter makes inferences from a single observation very difficult. The S2axis value correlates best with distance from the backbone:
resulting dynamics changes may reveal the pathways by which motions and energy are dispersed.
In order to investigate the propagation
of dynamic effects in proteins, this study employs a novel dynamic perturbation-response
experiment. Changes in ps-ns side-chain dynamics are monitored in response to a localized perturbation. In this case the perturbation is mutational in nature, but the technique can also make use of ligand binding (Fuentes et al., 2004) or even chemical modification, if appropriate. If the mutation does not provoke a significant change in the structure, one can conclude that the residues experiencing altered dynamics belong to a dynamic network
involving the mutation site. One can then make use of these networks to test the proposition that dynamic interactions are associated with energetic linkages, using methods already established (Edgell et al., 2003).
The protein investigated in this study was eglin c, a serine protease inhibitor derived from the leech Hirudo medicinalis (Seemuller et al., 1977). Like chymotrypsin inhibitor 2, eglin c belongs to the potato inhibitor 1 family, and is atypical for the family in that its sequence contains a large number of aromatic amino acids, more than twice as many as most other members of the family (Figure 1). The majority of methyl-bearing residues in the core are valines; most leucines are at least partially solvent-exposed, and there are no isoleucines or methionines. Nonetheless, due to its small size, the limited number of methyl side chains still samples a majority of the hydrophobic core (Figure 2).
The -helix of eglin c is packed against a central -sheet composed of 3 strands (Figure 2). The first and third strands are linked by a highly flexible loop that is bound by eglin c’s protease target (Bode et al., 1987). In NMR spectra, the intensities of amide peaks for the residues in this region are attenuated by intermediate chemical exchange processes at 37 ºC; as the temperature is decreased, the peak intensity recovers, probably due
to a shift into the slow exchange regime, which may also account for the observation of additional small peaks at this temperature.
Like most proteins, eglin c has a fairly rigid backbone throughout most of the packed regions (Figure 2). The exposed loop, however, has a great deal of flexibility and possesses complicated dynamics. Despite the widespread rigidity of the backbone, there is a broad range of flexibility for the side chains (Figure 2), although this is again typical for a folded protein. While on average buried residues are more rigid than those that are solvent exposed, some buried residues are more flexible than some exposed residues.
Figure 2: Structure of eglin c (from PDB file 1cse) (Bode et al., 1987) displaying molecular surface and WT* order parameters. S2 and S2axis range from 1 (blue) to 0 (red). Yellow backbone
segments indicate residues made completely invisible by intermediate exchange; dynamics could not be determined for residues shown in gray. All structure figures were created using MOLMOL (Koradi et al., 1996).
1
S2
This study primarily addresses the mutational response at 8 sites within eglin c (Figure 3). Each of the residues pictured was mutated to an alanine in order to perform a mutational perturbation-response experiment, except L27, for which only the energetics were analyzed. In addition to an alanine mutation, a less disruptive glutamine mutation was made at R53 in order to investigate the
effect of side-chain bulk. The initial mutations (V14A, V54A) were guided by chance and the simple idea of ablating some buried methyls. Subsequent mutations at methylated sites were made on the basis of observations in the initial cases. The mutation to R53 was made on the basis of the previous work in CI-2 (Leatherbarrow and Matthews, 1992).
In all of these cases the protein bore a F W mutation at position 10, in order to facilitate detection in chemical denaturation experiments. This mutation preserves aromatic character at residue 10; additionally, all other potato inhibitor I family members thus far identified have a tryptophan at this site. To signify the presence of this mutation, proteins bearing it are designated with an asterisk (*).
The results presented here represent a thorough, but not exhaustive, study of large-to-small mutations among both buried and exposed valines in eglin c, and is the largest study to date of the effects of mutations on side-chain dynamics.
CHAPTER I
CONTIGUOUS NETWORK RESPONSES Introduction
Comparative studies have frequently found that side-chain dynamics change at sites distant from that of a perturbation. In the case of protein L, for instance, the slow dynamics of some side chains were altered at distances more than 10 Å from a mutated phenylalanine (Millet et al., 2003). Despite this and similar observations, the mechanism by which dynamic responses propagate to distal surfaces is poorly understood. However, a mechanistic explanation of this kind is a critical step towards understanding the significance of these interactions.
One picture that comes easily to mind when considering long-range dynamic responses is that of a path of responses going from side chain to side chain, from the locus of perturbation to a distal site. The intuitive appeal of this view is matched by its mechanistic plausibility; side chains can be quite flexible, offering a range of motions that can respond to a change in structure or environment. The coexistence of flexible side chains and a rigid backbone also speaks to the possibility of correlated motions, which would provide a convenient means of dispersion for dynamic responses. The simplicity of this view, and its similarities to macroscopic means of force transduction, makes it an attractive first guess about the means of dynamic response.
effects on structure and backbone dynamics, but significant effects on the side-chain dynamics of the protein. The dynamic responses generally appear to form a sparse network of residues which are in contact with each other. These “contiguous network responses” appear to constitute a significant mechanism for distributing the dynamic effects of mutations through eglin c.
Methods
Expression and Purification
WT* and mutant forms of eglin c were expressed using a pET28a (Novagen) plasmid in
Escherichia coli BL21(DE3) cells. The bacteria were grown in LB for unlabeled preparations, and in M9 minimal media containing 15NH4Cl and/or [U-13C]-D- Glucose
(Cambridge) as the sole nitrogen or carbon source to achieve the appropriate labeling. Protein labeled 50% with 2H was prepared using M9 with 60% D2O.
For all labeling schemes, bacteria were grown at 37 ºC to an OD600 of 0.6-0.8 and then
Following dialysis, the lysates were fractionated over a fast-flow Q sepharose column (Pharmacia), eluting with a linear salt gradient from 0 M to 2 M NaCl (eglin eluted at ~150 mM NaCl). Fractions containing eglin c were then concentrated and further purified using a G-50 Sephadex (Pharmacia) column. The purity of the eluates was assessed by SDS-Page. Pure protein was then concentrated and, if necessary, dialyzed into NMR buffer [20 mM KH2PO4, 50 mM KCl, 0.02% NaN3, 10% D2O, pH 7.0]. The final concentration of eglin c in
samples used for relaxation studies was 2.0 mM unless otherwise noted.
Some double mutants were expressed using an alternate vector containing a His6 tag. In
these cases, the polyethyleneimine precipitation and subsequent steps were skipped, and the raw lysate was purified over a Hi-Trap His column (Pharmacia), eluting with an imidazole gradient. Protein samples were subsequently concentrated and dialyzed into NMR buffer for folding studies.
NMR Data Acquisition and Processing
NMR spectra were acquired using 500 and 600 MHz Varian INOVA spectrometers equipped with triple-resonance probes. Relaxation and assignment spectra were acquired at 37 ºC (temperature calibrated with ethylene glycol) or 25 ºC (temperature calibrated with methanol), as noted. RDC experiments were carried out at 20 ºC, but temperatures were generally not calibrated. Spectra were processed using NMRPipe (Delaglio et al., 1995) and analyzed with the assistance of NMRView (Johnson and Blevins, 1994).
13
C. Stereospecific methyl assignments were determined for most proteins using a constant-time carbon HSQC on a sample fractionally labeled with 13C (Neri et al., 1989). Once these had been performed for numerous mutants, it became apparent that prochiral assignments could be made on the basis of chemical shift relationships alone, and this method was used for subsequent mutants. Assignments of each mutant at 20 ºC were determined by tracing peak motions through a series of 15N HSQCs at different temperatures between 37 ºC and 20 ºC. This method was also used to determine amide and methyl assignments of WT* at 25 ºC. Chemical shift values for the amide nitrogen and amide proton were compared individually between the WT* and each mutant. The resulting differences were then combined using the formula:
2 2
) 2
. 0
( N
H
vector = +
where H is the change in chemical shift (in ppm) of the proton, and N is the change in
chemical shift of the amide nitrogen. A trimmed mean of these vectors was constructed by excluding the highest 10% of changes. Chemical shift changes from V63A* were excluded from the trimmed mean due to the temperature difference. “Significant” changes in chemical shift were defined as those changes greater than the trimmed average (0.059) plus twice the standard deviation of the trimmed set (0.051). Therefore, only vector values greater than
0.16 were considered significant.
experiments (Ottiger et al., 1998) performed at 500 MHz on a sample at 20 ºC in the presence or absence of bicelle material. Splittings were measured using NMRView (Johnson and Blevins, 1994) peaklists. Linear correlations and residuals were calculated using EXCEL. Rotamer populations were determined on the basis of 3-bond JNC and JCC couplings for
valines and threonines. Couplings were measured using a quantitative J-correlation method initially described by the Bax group (Bax et al., 1994; Vuister et al., 1993), in which the intensities of two spectra, one of which includes a J coupling evolution, are compared. These couplings were then analyzed after the method of Hennig (Hennig et al., 1999):
3
Jexp(C N) = p1803Jtrans(C N) + (1 – p180)3Jgauche(C N) 3
Jexp(C CO) = p-603Jtrans(C CO) + (1 – p-60)3Jgauche(C CO)
p60 = 1 – p180– p-60
where p60, p-60, and p180 correspond to the populations of each rotamer, 3Jexp is the
experimentally observed coupling, and 3Jtrans and 3Jgauche are the coupling constants expected
for fully-occupied rotamers. Following previous work (Schnell et al., 2004), 3Jtranswas set to
2.1 Hz and 3.6 Hz for NC and CC couplings in valines, and 1.9 Hz and 3.4 Hz for threonines. Similarly, 3Jgauche was set to 0.6 Hz, 0.4 Hz, 0.4 Hz, and 0.2 Hz for NC and CC couplings in
valines and threonines, respectively. For valines, results from the two methyls were averaged by assigning the 2 results to a rotamer shifted 120º from the formula value (i.e. the JNC
NMR Relaxation Studies
Spin-relaxation studies of backbone amides were performed on samples uniformly labeled only with 15N at both spectrometer fields. Standard experiments (Farrow et al., 1994) were used with minor modifications (Hu et al., 2003). 15N T1 data were collected with relaxation
delays of 39, 109, 194, 299, 414, 544, 689, 839, and 1004 ms. 15N T2 data were collected
with relaxation delays of 8, 16, 24, 40, 63, 79, 95, 111, and 127 ms. In some cases, the T2
experiment was replaced by a T1 experiment with relaxation delays of 5, 15, 25, 40, 60, 80,
105, and 135 ms at both fields, and spin-lock frequencies of 2518 Hz at 600 MHz and 2710 Hz at 500 MHz. Following correction for off-resonance T1 relaxation, the difference
between transverse relaxation rates derived from T2 and T1 experiments was negligible.
Errors were assessed by comparing the underlined timepoints above with duplicates taken at the end of the experiment. {1H}-15N NOE data were collected with a saturation period of 4.5 s, and errors were assessed from baseline noise. Peak intensities were extracted using NMRView, visually inspected using GNUPLOT, and then fitted to single-exponential decays using a Levinthal-Marquardt algorithm by the in-house program expfit2.
Once relaxation rates were determined, 15N data were fit by the program relxn2.1 (Lee et al., 1999) to a spectral density function, and then to the simple model-free formalism (Lipari and Szabo, 1982):
( )
(
)
+(
+( )
)
+
= 2 2 2 2
1 1
1 5
2 S S
J
m m
where -1= m-1+ e-1. In this equation, m represents the global correlation time, S2 is the order
correlation time m was fit first by a global minimization for all rigid residues. Flexible
residues were identified for exclusion from the global fit using a previously described method (Tjandra et al., 1995). Once m had been determined, the internal parameters S2 and
e were fit individually for each residue. Although a model-selection protocol based on
information criteria (Chen et al., 2004; d'Auvergne and Gooley, 2003) identified several residues as experiencing improved fits with alternate formulations of the spectral density, this improvement was marginal, and calculated REX values were very small except in the case of
V13. For this reason, all comparisons use the simple model-free formulation.
In order to determine rotational diffusion tensors for eglin c mutants, a second fit was performed in which m was fit individually for every residue (Lee et al., 1997). These data
were then analyzed in concert with solution structures from 1EGL (Hyberts et al., 1992) to determine the angular dependence of the locally-fit global correlation time using the in-house program Qfit. Because no significant anisotropy was noted, no attempt was made to recalculate order parameters on the basis of an alternate diffusion tensor.
Side-chain dynamics were assessed using samples uniformly labeled with 13C and randomly 50% labeled with 2H. 2H spin relaxation data were collected at both 500 and 600 MHz, filtered for CH2D methyl isotopomers using experiments previously described
(Muhandiram et al., 1995). IzCzDz delay times were 3.0, 7.4, 13.1, 19.9, 27.5, 34.0, 45.2,
55.0, and 65.6 ms. IzCzDy delay times were 1.1, 3.2, 5.8, 8.9, 12.4, 16.3, 20.5, 25.1, and 30.0
ms. IzCz values were collected with delays of 12, 20, 28, 36, 44, 52, 60, 68, and 76 ms.
IzCz rates. Relaxation data were best-fitted to the standard model-free formalism, using the
m derived from the analysis of 15N relaxation data. The S2 values were divided by a factor of
0.111 in order to correct for methyl rotation, yielding S2axis.
Side-chain methyls for which changes in model-free parameters were greater than twice the standard deviation of the Monte Carlo simulation results (2 ) were identified as having changed dynamics. The application of more stringent standards (such as 3 , or a 10% change) somewhat diminishes the traceability of responses discussed below, but does not substantially alter most conclusions about long-range responses in these mutants.
Based on previous work (Chou et al., 2003; Hu et al., 2005), it is known that the S2axis
value to some extent reflects the degree to which different rotamers are populated, although it cannot determine specifically which rotamer is most highly populated. Therefore, rotamer populations for valines and threonines were calculated from the observed S2axis values using
(Hu et al., 2005):
5 . 0 19 . 2 29 . 0 2 + = axis major S p
where pmajor is the percentage to which the primary rotamer for the side chain is populated.
Chemical Denaturation Studies
Thermodynamic energies of unfolding were determined using a protocol described previously (Edgell et al., 2003). Briefly, a solution of ~5 µM eglin c in standard NMR buffer
(without D2O), pH 7.0 was titrated using an Aviv auto-titrating fluorometer with a solution
before exciting fluorescence at W10 with 290 nm light and monitoring emission at 350 nm. Using Sigma Plot, the fluorescence emission curves were fit to (Edgell et al., 2003):
[
]
(
)
(
[
]
)
(
[
] [
]
)
[
] [
]
(
)
+ + + + = RT m RT m s f s f F D N D N D D N N obs 1/2 1/2 GuHCl GuHCl exp 1 GuHCl GuHCl exp GuHCl GuHClwhere Fobs is the observed fluorescence, fN and fD represent the fluorescence signal from the
native and denatured states, respectively, and sN and sD represent the slope of the native and
denatured state responses to additional GuHCl. R is the gas constant (1.987 cal/mol) and T is the absolute temperature of the measurements (298 K). The change in free energy with respect to the change in GuHCl concentration is represented by mN-D, while the concentration
of GuHCl at which half of the protein molecules are unfolded is represented by [GuHCl]1/2;
the Gu for each mutant is calculated by multiplying these two variables. Error was
calculated on the basis of repeated measurements; because not all proteins were subjected to the same number of attempts, the standard deviations were averaged over all mutants in order to estimate error.
The Gi values for double mutants were calculated using:
* , * , * , *
,WT UAB U A UB
U
i G G G G
G = +
where A*, B*, and AB* represent the two single and one double mutant, respectively. The average error in the individual measurements was 0.093 kcal/mol, so the overall error was assumed to be 0.18 kcal/mol for Gi. This is essentially the same as the 0.2 kcal/mol
kcal/mol was applied to determine whether energetic effects were additive; that standard is extended here.
Results and Discussion
Structural Effects
With any mutation it is reasonable to ask whether the structure has been perturbed. In this case, residual dipolar couplings (RDCs) provide a convenient means for assessing the degree of structural perturbation. The dipolar coupling between two nuclei depends on the distance between them and the angle between the line that connects them and the magnetic field vector. In solution, proteins tumble isotropically with respect to the magnetic field vector, and therefore this coupling generally averages to
zero (Tjandra and Bax, 1997). In the presence of a liquid crystal medium (in this case polar bicelles) (Ruckert and Otting, 2000) that aligns parallel or perpendicular to the magnetic field, a fraction of this coupling is recovered. These residual dipolar couplings provide information about the shape of a molecule and the orientation of a bond within the
molecular frame of reference. As such, if the fold of the molecule has changed, the RDCs of the relevant N-H bonds should be affected. This approach has advantages in that the data can be acquired rapidly and the analysis is not computationally intensive.
with a magnitude greater than 5 Hz the average change in magnitude is 30%. Although this numerical comparison seems highly unfavorable, a graphical comparison (Figure 4) is more informative. The two datasets have a tight linear relationship, clearly indicating that the structures are equivalent, at least in terms of backbone N-H vectors. The residuals for the linear relationship are small and random, and average to zero.
Comparisons of RDCs from the four mutants to wild-type are of similarly high quality (Figure 5). Each mutant is shown in comparison to the WT* dataset it most closely matched on the presumption that the bicelle solutions were most similar in that case. Switching the comparison to the other dataset does not cause a large change to the correlation coefficient,
or alter the conclusions with respect to the data reported in Chapter 2. The correlation coefficients for plots V13A* (5A), V34A* (5C), and V54A* (5D) RDCs against those of WT* are all 0.99, which is as good as the R2 when comparing WT* to itself. The exception is V14A* (Figure 5B), which has a correlation coefficient of only 0.98, but even this correlation is excellent.
Chemical shift measurements similarly indicate the resilience of the structure; residues with significantly changed
chemical shifts are generally restricted to the locale of the mutation (Figure 6). The V14A* and V54A* mutants appear to be exceptions (Figure 6B, 6D), but in these cases the chemical shift changes that appear to be distant in the sequence are actually quite close in the structure. Additionally, none of these mutations alter the secondary structure prediction from chemical shift indexing.
While these data do not rule out the possibility of small, local rearrangements of the side-chains, they firmly establish that the fold has been preserved and that the shape of the molecule is essentially unchanged. This latter contention is also supported by the rotational diffusion anisotropy fits, which indicate near-spherical diffusion tensors for all mutants.
Figure 6: Chemical shift comparisons between WT* and mutant proteins. vector values are shown for
Backbone Dynamics
The small amounts of energy involved in nuclear spin systems make relaxation of these systems by spontaneous emission a very slow process (Cavanagh et al., 1996). Consequently, nuclear spins must return to equilibrium by emitting energy when
stimulated by nearby fields fluctuating at the appropriate frequency. As a result, the rate of return to equilibrium is sensitive to
the motions of a given molecule. In this study, relaxation was primarily studied through two processes: T1 relaxation, which is the recovery of polarization parallel to the magnetic field
vector; and T2 relaxation, which is the dephasing of polarization in the plane perpendicular to
the field vector. Additionally, in the case of the 15N measurements a {1H}-15N steady-state NOE was collected, measuring the interdependent relaxation of a proton and nitrogen. The relaxation rates and NOE values acquired for WT* eglin c are shown in Figure 7. Because the relaxation rates are dominated by the overall tumbling of the protein, they are relatively flat across the molecule, but there are notable changes in flexible regions such as the loop and the N-terminus.
All three of these relaxation mechanisms depend on to the spectral density, which reflects the power available at a given frequency (Cavanagh et al., 1996; Lipari and Szabo, 1982). The spectral density can in turn be described by three parameters of molecular motion: the global correlation time m, the order parameter S2, and the effective internal correlation time
Figure 7: Relaxation data for WT* eglin c. T1, T2,
e (Lipari and Szabo, 1982). As its name would suggest, the global correlation time
describes the rate at which the protein tumbles in solution. This also represents the slowest motion to which actual T1 and T2 relaxation rates are sensitive (although the nature of the T2
experiment means that the measured rate may also reflect slower motions).
The order parameter S2 can range from 0 to 1 and reflects the degree of restriction of an internal vector. A bond vector for which S2 = 1 is perfectly rigid with respect to the molecular frame of reference; a bond for which S2 = 0 is isotropically flexible with respect to the rest of the molecule (Lipari and Szabo, 1982). Because methyl groups rotate rapidly about the carbon-carbon axis, their C-H bonds naturally have very low order parameters. Dividing the S2 by 0.111 corrects for this rotation effect and yields the order parameter for the axial bond (S2axis) (Lipari and Szabo, 1982; Muhandiram et al., 1993).
In WT* eglin c, as in most proteins, the backbone is relatively rigid throughout most of the molecule (Figure 8). The exceptions, as already indicated by the raw relaxation data, are the loop region (residues 39-49) and the N-terminus. In contrast, the side chains appear to possess a wide range of flexibilities, ranging from an S2axis as low as 0.2 at L27 to a high of
0.8 for A21. In general, solvent-exposed residues possess the lowest order parameters, but
this is not true in all cases. T26, for instance, has a higher side-chain order parameter than V18, even though V18 is buried in the core.
The effective internal correlation time e is not fit robustly for backbone amides due to
their rigidity and the lower Larmor frequency of 15N; therefore no effort has been made to interpret changes in this parameter for N-H groups. In terms of the generalized order
parameter S2, two kinds of responses to mutation are evident (Figure 9). The first encompasses the V13A* and V34A* mutants (Figure 9A, 9C). In both these cases, it is clear that there is a small, widespread decrease in backbone rigidity on the ps-ns timescale. The average change in S2 relative to WT* for V13A* is -0.03, and for V34A* it is -0.02, compared to an average order parameter of 0.8 for all residues excluding the N-terminus. The largest changes in S2 cluster around the mutation site for both proteins. However, none of the order parameters change by 10% or more, suggesting that the perturbation, while global, is not serious. The reduction in order parameters for these mutants is mirrored by the reduction in magnitude of their RDCs relative to wild-type. This latter evidence does not unambiguously prove that the backbone is more flexible, though the similarity of 2H splittings suggests that the media should have produced similar degrees of alignment. However, the reductions in S2 and RDC magnitude paint a consistent picture of increased backbone flexibility.
In contrast, the backbone S2 of V14A* and V54A* are very similar to those of WT*, with very few residues worth noting. The average change in order parameter for these proteins is -0.002 (V14A*) and -0.005 (V54A*) relative to averages of about 0.82 for parts of the protein outside the N-terminus. In these cases again the largest changes to the order parameters cluster near the mutation sites. None of the mutations significantly perturbed chemical exchange processes in the loop (residues 39-48) or at V66. A subtle chemical shift exchange process at V13 appears to have been quenched in the V13A mutant, but this is not affected by any other mutations.
For the most part these proteins appear to have similar m values. WT* eglin c has a m of
exception here was V13A*, which fit a m of 4.26 ns. It is possible that the decreased m is
related to the increase in backbone flexibility, but the changes in S2 are not an artifact of an erroneously low m fit, as an alternate fit of the data using a longer m shows a further
decrease in the fittedS2 values.
The picture that emerges from the structural and dynamic data indicates that by and large the backbone is not significantly perturbed by these mutations. The same can not be said of the side chains. Each of these mutations causes significant changes in side-chain dynamics at sites distant from the mutated residue.
Side-Chain Dynamics
The detection of small changes in side-chain dynamics is almost inevitable in experiments of this kind. In an effort to simplify the analysis, significant changes in side-chain dynamics were defined as those in which S2axis or e was greater than twice the propagated error in
the measurements (the error for each measurement is the standard deviation of values from 150 Monte Carlo simulations of the fit). While smaller changes may still be real or important, the 2 standard identifies residues for which a change can be confidently identified, at least on the basis of the fitted values.
The V13A* mutation causes changes in side-chain dynamics throughout eglin c (Figure 10), and most of the significant changes in S2axis are concentrated near the mutation site. The
molecule, encompassing nearly all methyl-bearing groups. Although this response is troublesome, it cannot be dismissed out of hand because eis fit robustly for methyl
groups.
The e response highlights an
important consideration of dynamic experiments, in that one hopes to see a significant number of residues that do not display any response to the mutation (Clarkson and Lee, 2004). When all residues appear to change in a uniform
direction, one must be concerned that the fitted m is inaccurate. Even small errors in the
correlation time can cause significant changes to the fitted S2axis values. These changes
should be both global and uniform in sign. The absence of this uniform effect suggests but does not guarantee that the fitted m is correct. Similarly, the presence of a global depression
of e (as observed in V13A*) does not establish that a m error has been made – it is at least
conceivable that all the methyls have accelerated their rotation for some reason. However, taken with the almost uniformly elevated S2axis values, the e data provide cause for concern.
In terms of the response of the loop residues (V43, L45, L47), L7, and V66, there is additional cause to question the results because these residues are engaged in complicated
dynamic processes. The loop moves fairly freely in solution (Figure 8), and the backbone resonances of numerous residues on it show evidence of intermediate chemical exchange. The backbone amide of V66 is also in chemical exchange, though in this case it’s not clear that the exchange is due to any motion on the part of V66. The backbone of L7, in contrast, appears to be in slow exchange, and eglin c does not have a great deal of N-terminal structure. The dynamics at L7 are
therefore likely to be just as complex as in the loop. In all of these cases, it is possible that the simple model- free dynamics model (S2, e, m) simply isn’t appropriate; the fact that the
fits for these residues had 2 values above the average of 2.96 (for V13A*) supports this interpretation. In addition, many of these are marginal effects in e, just barely satisfying the
condition of significance. Finally, most of these residues are solvent-exposed, which makes changes in methyl rotation rates difficult to explain.
Even rejecting that those five residues experience real dynamic changes, it is clear that the V13A mutation induces dynamic responses at several residues with which it is not in direct contact (Figure 11). This includes changes in S2axis and e at V34 and T26, and e changes at
L27, V62, and T17. Of residues in direct contact with V13, only V54 and A21 show a dynamic response.
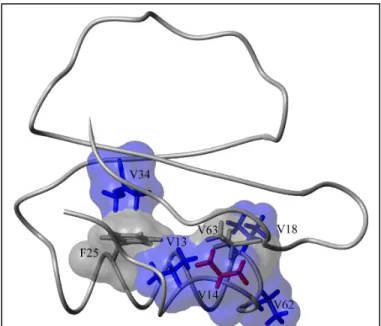
An additional feature of the dynamic response to the V13A mutation is that most of the residues responding to this mutation can be linked into a contiguous surface (Figure 11), provided one inserts a surface for the V63 atoms. This highlights a practical issue in the interpretation of NMR-based dynamic perturbation-response experiments (Clarkson and Lee, 2004). While a large number of side chains can be analyzed in these experiments, certain types of amino acids or groups will escape analysis. In this instance, the dynamics of methylene groups and aromatic side chains were not analyzed. In addition, features of the spectra may prohibit analysis, as in the case of V63. Both V63 methyls are overlapped in the WT* spectrum, precluding any proof of dynamic change in response to the mutation. Nonetheless, the proximity of V63 to several residues experiencing a dynamic response to the V13A mutation suggests the possibility that it too has responded; it is in the hydrophobic core and lies in close proximity to V13, V62, and V54. Given V63’s position, it is at least possible that it responds to the V13A mutation and so its surface has been included, with the caveat that there is no direct evidence to support it. The propagation of dynamic effects to T26 and L27 is more difficult to explain. Although V13 and V34 both directly contact the F25 side chain, it is bent away from T26, and there are no unusual backbone perturbations to indicate a disturbance there. This does not rule out propagation via F25, but these two side chains are not included in the surface nonetheless.
are considered the distances are even greater. Second, many of the residues with significant changes in their model-free parameters can be assembled into a contiguous surface. These features are not unique to the V13A response.
The methyl dynamics data of V14A* eglin c also reveal a dispersion stretching away from the mutation site through a contiguous network of interacting side chains (Figure 12 & 13). In contrast to the observations in V13A*, the response involves both increases and decreases in side chain flexibility, and also a large number of residues for which no significant dynamic change is identified. A group of residues including V18 and T17 becomes more flexible in response to this mutation, while
V13 and V34 become more rigid. In addition, there appears to be a slight, but significant change in e
for the pro-S methyl of L45.
Again in this case there is good cause to question the response at L45, not only because it barely meets the standard of significance but also because its dynamics may be too complex for the simple model-free formalism to accurately handle. The dynamic response at V34 is also subtle, but the
to V14 reinforces the significance of that result.
Regardless of the treatment of L45, the V14A mutation again provokes a clear response at distal residues. The -carbons of V18 and T17 lie about 11 Å away from the -carbon of V14. The methyl carbons of V34 are positioned more than 13 Å away. Additionally, if one takes the liberty of including surfaces for V63 and F25,
one can unite every residue with a dynamic response except L45 into a contiguous surface (Figure 13).
The proposed surface appears to have two branches, one of which rigidifies in response to the mutation, the other of which becomes more flexible. The steep drop-off in response between V13 and V34 may be attributable to the fast-timescale inflexibility of F25. Though aromatic rings are known to flip in protein interiors, these motions occur on the sub-millisecond timescale. On the timescale investigated by these experiments – motions of a duration less than m– the bulky, rigid rings probably have low mobility, which may serve to
muffle dynamic transmission.
mutated site experiences a change greater than 0.1 in S2axis. In the
case of the V34A* mutant, however, a more serious dynamic perturbation appears to take place. As with V14A, eglin c has a mixed response to the V34A mutation (Figure 14). In this case, however, similar dynamic responses do not co-localize. Areas of the core that become more flexible are separated by stretches of residues that appear to rigidify. The dynamic propagation reaches to a greater distance in this case: the methyls of T17 and V62, for instance, are more than 16 Å away from V34. Additionally, the dynamic perturbation appears to be substantially more severe, not only in terms ofS2axis, but also with respect to side-chain rotamer populations (Table 1).
This large change in rotamer populations for core residues is unique to V34A* eglin c among mutants studied thus far. Though neither methyl’s primary rotamer changes as a result of the mutation, the degree to which it is populated shifts dramatically (especially in the case of V52). The population change loosely correlates with a decrease in S2axis, but for
V52 the primary population calculated on the basis of the order parameter is significantly Figure 14: Side-chain dynamics changes in V34A* eglin c.
greater than that calculated on the basis of observed J couplings. Because the J couplings are sensitive to a much broader timescale than spin-relaxation, this suggests that at least some portion of the observed rotamer averaging is due to motions slower than the overall tumbling of the molecule. In the case of V18, this shift in rotamer populations may represent the effect of a conformational change in F36,
which is adjacent to both residues and could shift to fill the new space. In the case of V52 it probably results because that side-chain is directly taking advantage of the hole created by the mutation (see below).
Curiously, although it contacts both V34 and V52 directly, V54 rigidifies in response to the ablation of the V34 methyls. This, however, may be explained by the nature of the population change in V52. In WT* eglin c, the V52 side chain almost exclusively populates the 180º rotamer, putting a single methyl group in contact with both V34 and V54. In the V34A mutant, however, the 60º rotamer is almost equally populated (Figure 15). In this case, the 1 methyl appears to swing into the area vacated by the V34 methyls, while the 2
methyl takes the place of 1. As a result, V54 is now bracketed by 2 methyl groups from the
adjacent V52 approximately half the time. This may serve to restrict its available conformational space.
pmajor, J pmajor, S 2
Methyl
group WT* V34A* WT* V34A*
V13 1 0.55 0.51 0.76 0.75
V13 2 0.55 0.51 0.73
---V18 1 0.86 0.68 0.81 0.73
V18 2 0.86 0.68 0.81 0.71
V52 1 0.81 0.47 0.92 0.89
V52 2 0.81 0.47 0.97 0.90
V54 1 0.91 0.94 0.96
---V54 2 0.91 0.94 0.97 1.01
V62 1 0.83 0.81 0.92 0.93
V62 2 0.83 0.81 0.92 0.94
V54 adopts the 180º rotamer 91% of the time in WT*, but the J coupling results indicate that this percentage is slightly increased in V34A*. Additionally, the increase in S2axis for
V54 may reflect a narrowing of the well for that particular rotamer.
V34A* eglin c also sees dynamic changes at some residues on the opposite face of the -sheet, namely L37, and the loop residues V43 and L47. Although the same caveats as before apply to the loop residues, L37 and V43 at least can be linked to the core residues via R53, which lies between the clear responders V52 and V54. As for L47, the effect there is very marginal, as the change in S2axis is 0.003 above the threshold. It is therefore possible that the
response observed there is an artifact.
As with several other mutations, L27 is identified as a responder, though there does not appear to be any direct way to link it back to V34 (Figure 12). The backbone dynamics in that region are also unusually quiescent compared to the rest of the protein, and that end of the helix features some of the best correlations between V34A* and WT* RDCs. L27, in
Figure 15: Side-chain dispositions in the core of eglin c. In the WT* protein (left), V52 (orange) primarily populates the 180 rotamer in order to avoid steric clashes with V54 (blue) and V34 (red). In the V34A* protein (right), ablation of the V34 methyls allows V52 to adopt the 60 rotamer, in which the methyls bracket V54 1.
1
fact, features the smallest residual observed in the entire protein. However, L27 has some unusual energetic properties (Yi et al., 2003), and its motions may be somehow correlated with those of the loop (J. Fetrow, unpublished data). Thus, there may be some subtle long-range interactions involved. It is also true that the L27 methyls tend to be overlapped slightly in the relaxation spectra, but this occurs in the mutants
and the wild-type, and is unlikely to give rise to differences between proteins.
Additionally, it is important to re-emphasize that the fast-timescale dynamics measured in these experiments cover only a fraction of the available range of fluctuations. That a pathway cannot be conveniently drawn encompassing all residues with altered fast-timescale dynamics does not imply that no such pathway could be conceived were the motions of all residues on all timescales known. Dynamic and structural changes below the sensitivity threshold of these experiments may also account for the distribution of effects. The absence of detectable dynamic changes cannot rule out propagation through any particular site.
surface does not have the convenient feature that adjacent residues always experience similar changes in dynamics, it at least provides a pathway by which dynamic responders may be linked. Because the example of V52 and V54 shows that differing dynamic responses in adjacent neighbors can be rationalized in terms of structural principles, this should not be alarming.
The V54A mutation also provokes a widespread dynamic response involving several large-magnitude changes in S2axis (Figure
17). Again, many of these responses reach distal residues: the methyl carbons of T17 and V62 are 11 Å away from the -carbon of V54. Additionally, a contiguous pathway can link all of the response sites, so long as V63 is included in the surface (Figure 18).
Although the magnitude of the response is notable, another key feature of the V54A* mutant is that all the changes appear to involve a rigidification of the methyl groups. In this case, there is no concern for fitting bias as in V13A*, however. The small-magnitude changes in S2axis that do not meet the 2 criterion are both positive and negative.
Additionally, the e changes observed
include both increases and decreases, suggesting that there is no need to be concerned about m. The rigidification
therefore appears to be a real feature of the mutational response, albeit a counterintuitive one. The creation of a hole in the middle of the core would seem to afford more opportunities for conformational flux, not less.
The rigidification may reflect the fact that no fast-moving side chains are appropriately positioned to take advantage of the opportunity created by the ablation of the V54 methyls. In the case of the V34A mutation, V52 can partially fill the new hole simply by adopting an alternate rotamer conformation (Figure 15). This is not possible in the case of the V54A mutation because the methyl groups of V34, V13, and V52 are already as close to the V54 -carbon as they can be without changing the backbone conformation. Because there is no opportunity to take advantage of the new space, there is no entropic compensation for the loss of enthalpy from van der Waals interactions. This may serve to narrow the energy well and stabilize a single conformation in the core, thus increasing the order parameters.
Clearly, this rigidification does not extend to all timescales; because the stability of the protein is decreased, unfolding is occurring more frequently, implying an increase in backbone flexibility on a timescale of seconds and above. Near the nanosecond timescale, however, it appears that there are no slower compensating motions. Rotamer populations
derived from J couplings are nearly identical between WT* and V54A*, showing that there is no motion lasting ms or less that compensates for the increase in rigidity (data not shown). Additionally, because the maximum rotamer population neither increases nor decreases, these data suggest that the increase in order parameter results from decreased fluctuations in particular rotamer states – a narrowing of the energy well for each particular conformation. This is consistent with the picture described above in which side chains sacrifice fluctuations in order to maximize the available hydrophobic contacts.
In a sense, the rotamer transitions suggest that the response to the V54A mutation is more purely dynamic than that to the V34A mutation. In both cases, most side chains in the core rigidify. The only exceptions to this in V34A* eglin c are those residues that are taking advantage of the new pocket directly (V52) or indirectly (V18, via F36). The responses at these residues may be seen as more structural, while the rigidifying side chains might be more dynamic.
more standard structural means. Dynamics can therefore serve as a sensitive probe for minor, but significant, changes in structure.
An additional feature of interest in the V54A results is that this increase in rigidity does not correlate with an increase in stability. These two concepts are naturally associated (Wray et al., 1999), and it seems rational to suggest that large fluctuations in a structure occur when the interactions of the primary configuration are insufficient to maintain it. Yet in the case of V54A this expectation is not borne out. Though, as mentioned, conformational transitions between the folded and unfolded states have increased in frequency, the fast motions of side chains in the native state have decreased in amplitude. On face this contradiction is perplexing, but a consideration of thermodynamics may serve to explain it. The increase in
S2axis reflects a decrease in conformational entropy, though the possibility of correlated
motions makes a straightforward calculation of the magnitude of this effect impossible (Lee et al., 2002; Wand, 2001). Given this loss, the rigidification of V54A* eglin c makes sense as a cause of its destabilization. This is consistent with pH experiments on eglin c, in which it was shown that a drop in pH decreased both the global stability and the core methyl flexibility (Hu et al., 2003). In such cases, it may be more appropriate to think of instability in terms of native state fragility rather than structural looseness.
Contiguity of Responses
side chains that includes residues distant from the mutation site. In each case, dynamic responses were observed beyond the first and second shells of interactions. Additionally, significant changes in both S2axis and e were observed in each of these mutants. Finally, in
each case all, or nearly all, of the side chains where a dynamic response was observed could be assembled into a contiguous surface. These features constitute a specific kind of dynamic reaction to a mutational perturbation: a “contiguous network response”.
Several limitations of this analysis are immediately evident. First, while clear changes in model-free parameters create some certainty that a change has occurred, an absence of change in these parameters does not establish that the dynamics are unchanged. Due to their nature, model-free parameters do not include information about the direction of fluctuations. These could conceivably change even when the overall amplitude of fluctuation does not. Additionally, many types of side chains are missed by this analysis, specifically methylenes and aromatic groups. Attempts to measure the dynamics of these groups in the core of eglin c failed in part because their rigidity rendered 2H-based experiments too insensitive, which suggests that their primary flexibility does not lie on the ps-ns timescale. However, this cannot be stated with any certainty. As a result, though the observed networks have the
appearance of sparseness, they may not actually possess this property.
A V63A mutation, however, does not prompt a significant long-range response (Figure 19). Notable responses occur only at the adjacent residues V14 and V62, and the poorly-modeled V43. Yet it should be noted that the V63A mutation caused a 3.2 kcal/mol decrease in Gu, or more
than half of the stability of WT*. The protein could not be studied at the same temperature or concentration as other eglin mutants, and had to be compared to WT* at 25 ºC, 1 mM.
At this temperature the rigidity of side chains is substantially increased (Figure 20), which may serve to globally dampen dynamic propagation. Although the increase in rigidity is striking, this result is roughly similar to observations for some side chains in calmodulin (Lee et al., 2002). Additionally, V63A* was not entirely stable even at this temperature for long periods of time. As a result, the dynamic data are not as high in quality for this mutant, which may serve to mask real changes in dynamics. Clearly, however, the residue is critical for the stability of eglin c, which serves to reinforce its inclusion in these dynamic networks, though it is not proven that its importance is entirely dynamic in nature.
Of the other residues which were assumed to be part of these dynamic networks, R53 and F25, both appear to also be critical residues in eglin c, though again it has not been proven that this is due to dynamics. F25L* eglin c forms a protein gel when concentrated to >500 µM at room temperature, and
mutations of R53 prompt substantial structural changes in the loop (Chapter 3).
The apparent significance of all these residues suggests that their inclusion in dynamic networks is at least reasonable. Restraint must be exercised, however, in adding such residues to a network. In every case except F25 in the V14A network, each hypothetical inclusion is bracketed by a cluster of responding residues reinforcing its inclusion. The presence of such a cluster should be viewed as a requirement for the insertion of these surfaces in a network. Assuming that the observation of contiguity is meaningful, what does it imply about the nature of dynamic transmission? In the most trivial sense it would seem to indicate that side chains exert dynamic effects on adjacent side chains, and that the net result of these transmissions is a chain of interactions forming a contiguous surface. Yet this simplistic
interpretation is contradicted by the fact that although all of the observed networks appear to have numerous members in common, they do not have all members in common. For instance, although all four mutations appear to affect V63, they do not all alter the dynamics of V18 and V62. Similarly, though V14 causes dynamic changes in the core, it does not affect V54. And though V34 and V13 both appear to be members of the V14A network, V14 does not respond to mutation at either site, nor does it respond to mutation of V54. Finally the V54A mutation causes a rigidification of V18, but the V34A and V14A mutations actually increase V18’s flexibility, even though they ostensibly transmit motion to V18 via the same mechanism (V63) as V54A. If adjacency were all that was required for transmission, these observations would be incompatible.
A more powerful explanation of the contiguity could be made using motional modes involving correlated motions of the side chains. Such a possibility cannot be directly established by these experiments because they do not contain information on whether these motions are temporally correlated. Synchronous motions of bond vectors should theoretically give rise to similar e or e values for the axial bond. However, the dynamic
parameters obtained by 2H spin-relaxation methods are a convolution of the degenerate methyl rotation and the spatial diffusion of the axial bond, and are dominated by the former (Lee et al., 1999). The relative invariance of the bond angle between the hydrogens and the axis makes a deconvolution of the order parameter possible (Muhandiram et al., 1995; Ottiger and Bax, 1999), but the rate of methyl rotation is highly variable, preventing a similar trick for e.
Nonetheless, the contiguity of the residues in each of these networks, and the fact that
fluctuations that are correlated in the WT protein are collectively affected by a mutation. These fluctuations may assemble into distinct sets of sub-global modes; the existence of many such modes may account for the difference in dynamic response for each of these mutants.
Energetic Connectivity
Motional modes and dynamic interactions both indicate the sharing of energy between distal sites of a protein, and thermodynamic mutant cycle analysis is a classic way of identifying these kinds of interactions. Stabilities of eglin mutants were measured by chemical denaturation and used as a means to detect energetic coupling using mutant cycle analysis. Though numerous dynamic interactions have been noted in the cases of these four mutants, only one coupling (out of five measured) meets the standard of 0.3 kcal/mol used by Shortle and Stites (Table 2). The V18A/V54A cycle has an interaction energy of -0.946 kcal/mol. A cycle measured for a case in which no dynamic interaction was detected – L27A/V54A – has a coupling of -0.221
kcal/mol, similar to the observed values of -0.270 kcal/mol for V14A/V18A, -0.249 kcal/mol for V34A/V62A, and -0.266 kcal/mol for V54A/V62A. The V18A/V34A cycle did not appear to be associated with any interaction energy at all. The energetic results prompt two questions: why the dynamic
Mutant Gu Gi
V14A -1.046
--V18A -1.212
--L27A -0.170
--V34A -1.270
--V54A -1.588
--V62A -1.022
--V14A/V18A -2.528 -0.270
V18A/V34A -2.504 -0.022
V18A/V54A -3.745 -0.946
L27A/V54A -1.979 -0.221
V34A/V62A -2.541 -0.249
V54A/V62A -2.876 -0.266
networks did not generally correlate with detected energetic couplings, and why one of them did.
The near-absence of detectable interaction energies is consistent with the results of previous experiments where the dynamic probe was hydrogen exchange (Spudich et al., 2002). While it is possible that no energetic interaction exists for pairs of residues that did not meet the 0.3 kcal/mol standard, this is difficult to reconcile with the often obvious changes in dynamics. It is equally possible that the free energy of unfolding is simply not an appropriate probe of the interaction. Also, it could be that the energies involved are simply too small to be accurately measured. This does not refute their significance; even if the energetic interaction associated with the dynamic linkage of two particular residues is near zero, the sum of many such energetic linkages throughout a molecule may be substantial.
These findings also point to limitations of the thermodynamic mutant cycle experiment itself. The experiment relies upon the assumption that both mutations ablate the interaction to a similar degree. If the interaction is completely removed (or even gained) by one mutation, but only partially removed or unaffected by the other in the wild-type background, then even a real and large interaction energy will not be detected. The dynamic responses noted above were not generally reciprocal: as an example, V14 did not respond to the V34A mutation, even though V34 responded to V14. This issue will be treated more fully in the next chapter. However, even with the data shown here it is clear that this assumption may be invalid for all or most dynamic responses.