THE INFLUENCE OF AGING ON MUSCLE QUALITY, MUSCLE SIZE, AND ISOKINETIC STRENGTH IN THE PLANTARFLEXOR MUSCLES
Gilbert Edward King
A thesis submitted to the faculty of the University of North Carolina at Chapel Hill in partial fulfillment of the requirements for the degree of Masters of Arts in the Department
of Exercise and Sport Science (Exercise Physiology).
Chapel Hill 2013
Approved by:
Eric D. Ryan, Ph.D.
Abbie E. Smith-Ryan, Ph.D.
iii ABSTRACT
GILBERT EDWARD KING: The Influence of aging on muscle quality, muscle size, and isokinetic strength in the plantarflexor muscles
(Under the direction of Dr. Eric Ryan)
Aging often results in numerous physiological changes that result in reductions in
maximal strength. Few previous studies have examined the influence aging on muscle
size and quality and its impact on dynamic strength measures in the plantarflexor muscles.
The primary purpose of this study was to examine the influence of aging on medial
gastrocnemius muscle cross-sectional area (CSA), echo intensity (EI), and isokinetic
plantarflexion strength. Twenty young (20±2 years) and 10 older (68±3 years) men
volunteered for this study. Our results demonstrated that older adults produced (21 and
23 %) less torque (P<0.05) at 30 and 120°.s-1, respectively. In addition, there were no
age-related reductions in muscle CSA (P=0.166), but an increase in EI (P=0.015) in the
older adults. These findings suggest that the age-related reductions in isokinetic
strength are a result of decreases in muscle quality (i.e. increase in connective/adipose
iv
ACKNOWLEDGEMENTS
I would like to thank everyone who helped make this thesis project possible. I
would first like to thank my advisor, Dr. Eric Ryan, your guidance and patience has
pushed me to finish this document and you have shown me what it takes to be productive
researcher. I would also like to thank my committee members, Dr. Abbie Smith-Ryan
and Eric Sobolewski, for taking the time to review my document and for providing
feedback to help bring this thesis into fruition. I would also like to thank the research
team, Joseph Rosenberg and Michael Scharville, for your dedication and assistance with
data collection. I would finally like to thank my classmates for supporting throughout
v
TABLE OF CONTENTS
LIST OF TABLES ... vii
LIST OF FIGURES ... viii
Chapters I. INTRODUCTION ... 1
Purpose ... 5
Research Questions ... 5
Hypotheses ... 5
Delimitations ... 5
Limitations ... 6
Theoretical Assumptions ... 6
Statistical Assumptions ... 6
Operational Definitions ... 6
Abbreviations ... 7
II. REVIEW OF LITERATURE ... 8
Isokinetic characteristics during plantarflexion ... 8
The effect of aging on isokinetic peak torque ... 9
The effect of aging on muscle structure and function ... 13
The effects of aging on echo intensity and muscle cross sectional area ... 18
vi
Participants ... 22
Experimental Design ... 22
Isokinetic Strength Testing: ... 22
Ultrasound Acquisition ... 23
Signal Processing ... 25
Statistical Analysis: ... 25
IV. RESULTS ... 27
V. DISCUSSION ... 29
Tables ... 34
Figures... 36
APPENDIX ... 39
vii
LIST OF TABLES
Table
1. Means ± SD for age, stature, and body mass
for the young (n = 20) and old (n = 10) men.………...….35
2. Pearson product moment correlation coefficients between Isokinetic 30, Isokinetic 120, CSA, and
EI for the young men.………...….………....………....35
3. Pearson product moment correlation coefficients between Isokinetic 30, Isokinetic 120, CSA, and
EI for the old men.………...………...…………...35
4. Partial correlation coefficients between CSA,
Isokinetic 30, and Isokinetic 120, independent of EI………...35
5. Partial correlation coefficients between EI,
viii
LIST OF FIGURES
Figure
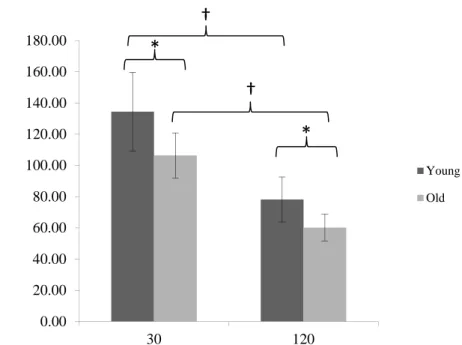
1. Isokinetic peak torque at 30 and 120°·sec-1 for the young and old men. * indicates a significant difference between groups (P<0.01). † indicates a significant difference between velocities (P<0.01).
Values are mean ± SD..………..37
2. Medial gastrocnemius cross-sectional area (CSA) values for the young and old men. Values are
mean ± SD..………38
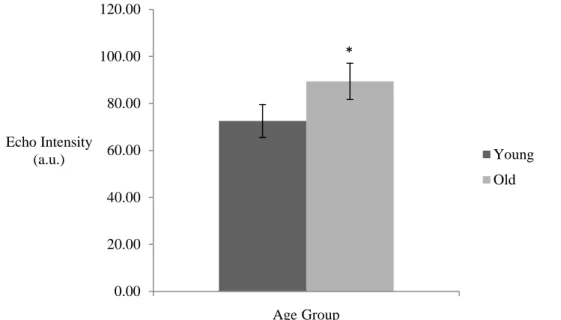
3. Medial gastrocnemius echo intensity (EI) values for the young and old men. * indicates a
significant difference between groups (P<0.01).
CHAPTER I INTRODUCTION
The Centers for Disease Control and Prevention (CDC) has identified falls among
older adults (≥65 years) as a major public health concern (9). Falling often leads to
injury, decreases in mobility, loss of independence, decreased quality of life, or even
death (41). In 2009, US emergency departments treated 2.4 million nonfatal falling
related injuries among older adults. In 2000, it has been estimated that the United States
health care system spent over 19 billion dollars on falls for the elderly, and by 2020 the
annual cost (direct and indirect) of fall-related injuries is expected to approach 54.9
billion dollars (9). A previous study by Plujim et al. (32) has demonstrated that in a
three year prospective study, 55.3 percent of older adults reported a fall, with 20.9 percent
reporting three or more falls over the three year period. Many previous authors (4, 7, 31,
32, 41, 42) have suggested that the increased risk of falling and impaired ability to
perform activities of daily living among older adults are due to the numerous changes in
the neuromuscular system resulting in reductions in maximal strength.
Age-related reductions in maximal strength are often linked to a number of
alterations in the neuromuscular system that include changes in motor unit number,
muscle fiber size, and the proportion of fiber types which results in sarcopenia or the
age-related loss of muscle mass (26). It has been reported that sarcopenia begins as
2
between 20 and 80 years of age (28). Studies examining single fibers have indicated
that fast-twitch type II fibers atrophy at a greater extent than slow-twitch type I fibers,
accounting for 60% of the total fiber reduction with aging (27). In a recent review by
Aagaard and colleagues (1), the authors suggested that the gradual loss of alpha motor
neurons may be due to apoptosis, reduced insulin-like growth factor I signaling, increased
amounts of circulating cytokines, and/or greater cell oxidative stress. The subsequent
denervated muscle fibers from larger motor units are then often reinnervated by adjacent
motor units resulting in larger slow-twitch motor units (4, 25, 27, 39). This was
demonstrated by Aniansson et al (4) who reported a decrease in muscle fiber area for type
II fibers (14 – 25%) over an eight year period in elderly participants, whereas there were
no significant changes in the type I fiber area, which may be due to the increase sprouting
and reinnervation of the slow-twitch fibers. In addition, denervated muscle has been
suggested to be replaced by connective and adipose tissue which may reflect an alteration
in muscle tissue quality (8, 14). This has been supported by Lexell et al. (26), who
reported that elderly individuals only have 50% of their total muscle area composed of
muscle fibers, while their younger counterparts have around 70% of their total muscle
area comprised of muscle fibers. Muscle quality, or the infiltration of fat and/or
connective tissue, has been assessed previously using computed tomography (CT) and
ultrasound imaging. For example, Goodpaster et al. (17) demonstrated that a decrease
in skeletal muscle attenuation (Hounsfield units) as measured by CT was associated with
an increase in lipid content. The authors (17) reported that higher muscle attenuation
values were associated with greater isokinetic leg extension torque production and
3
computer-aided gray-scale analyses of ultrasound images offer a potential alternative to
CT muscle quality assessments, whereby enhanced echo intensity (EI) value represents a
greater accumulation of connective and/or adipose tissue. For example, Fukumoto et al.
(14) reported a negative relationship between EI and maximal isometric leg extension
strength (-0.40); and the authors also reported a positive relationship with EI and aging
(0.34), as age increases EI increases as well. Cadore et al. (8) also reported a negative
relationship between EI and isometric (-0.51) and fast (360°.s-1; -0.67) and slow (60°.s-1;
-0.48) isokinetic muscle actions.
Many previous studies have demonstrated an age-related decrease in isometric
strength, however some authors (7, 23, 24, 42) have suggested dynamic muscle actions
may be more related to functional abilities. This was suggested by Rothstein et al. (32)
who stated "because the patient's limb is moving during an isokinetic test, these
measurements may appear to provide more meaningful indexes of function than isometric
measurements". For example, a study by Whipple et al. (42) compared elderly fallers to
non-fallers and reported that the fallers were only able to produce 21.4% of the
plantarflexion peak torque then that of the non-fallers at the fastest velocity tested
(120°.s-1). This demonstrated that isokinetic testing may be an appropriate indicator of
functional ability between groups. It has also been suggested that peak torque at the
fastest isokinetic velocities is most influenced by the age-related reduction in type II
fibers. Larsson et al. (24) suggested that the decrease in percent of type II fibers from
the adult group (63.2%) to the elderly group (45.0) is a contributing factor for the
decrease is isometric and isokinetic strength. Furthermore, plantarflexor muscles have
4
when compared with other lower extremity muscle groups (i.e. hip flexors, hip abductors,
hip extensors, and knee extensors) (38). Previous research suggests that plantarflexion
strength is a major risk-factor for falling in the elderly population, and most likely due to
the important role of plantarflexor muscles for propulsion and balance during gait (12, 38,
42). These findings highlight the need for future studies to examine the influence of
5 Purpose
1. The primary purpose of this study was to determine the influence of aging on
muscle quality, muscle size, and isokinetic peak torque of the plantarflexor
muscles.
2. A secondary purpose was to determine if muscle quality is associated with
isokinetic strength independent of muscle size and if muscle size is associated
with isokinetic strength independent of muscle quality for both young and older
men.
Research Questions
1. Did aging effect muscle quality, muscle size, and isokinetic plantarflexion peak
torque at 30°.s-1 and 120°.s-1?
2. Did EI effect isokinetic strength independent of muscle CSA, and does muscle
CSA effect isokinetic strength independent of EI?
Hypotheses
1. Old men would experience decreases in muscle quality and size and isokinetic
plantarflexion peak torque at 30°.s-1 and 120°.s-1
2. Aging had a positive relationship with EI, a negative relationship with muscle
CSA, and a negative relationship with isokinetic strength.
3. There would be a negative relationship between muscle quality and isokinetic peak
torque, and a positive relationship between muscle size and isokinetic peak torque.
Delimitations
6 were recruited to participate in this study.
2. Participants would not exceed more than 1 - 5 hours of exercise per week.
3. Participants did not have a current or recent injury of the low back, hip, knee, or
ankle within the past three months, or a neuromuscular disease that may affect
their ability to produce maximum torque.
4. The duration of the two sessions was approximately 60 minutes, 2-7 days apart.
Limitations
1. Participants were recruited from lifetime fitness classes and fitness areas on the
University of North Carolina at Chapel Hill's campus. In addition, the old men
were recruited from communities within and surrounding the campus. Therefore,
the participant population was not truly random.
2. The sample included volunteers, therefore not meeting the underlying assumption
of random selection.
Theoretical Assumptions
1. Participants provided accurate health, medical, and physical activity history.
2. Participants gave maximal effort during the isokinetic testing.
3. Participants followed to guidelines pertaining to lower body exercise before
testing.
4. All equipment was function properly for all testing sessions.
Statistical Assumptions
1. The population from which the samples are drawn was normally distributed.
2. The sample was randomly selected.
7
Isokinetic peak torque - the maximum torque produced during a muscle action performed
at a constant velocity.
Muscle cross-sectional area (CSA) - the area of the cross section of a muscle
perpendicular to its longitudinal dimension, generally at its largest point.
Muscle quality - the amount of adipose and connective tissue in a given cross-sectional
scan of skeletal muscle as measured from the echo intensity of a computer-aided gray
scale analysis of an ultrasound image.
Abbreviations
CSA - cross-sectional area
EI - echo intensity
MG - medial gastrocnemius
MVC - maximum voluntary contraction
CHAPTER II
REVIEW OF LITERATURE
Isokinetic characteristics during plantarflexion
So et al. (1994)
The purpose of this study was to compare the isokinetic characteristics between
athletes and non-athletes during plantarflexion and dorsiflexion. Twenty-three athletes
(6 = cyclist, 7 = gymnasts, 10 = soccer players) and 25 non-athletes were tested. Peak
torque (PT), torque acceleration energy (TAE), average power (AP), total work (TW) ,
endurance ratio (ER), torque ratio (TR), and work ratio (WR) were measured at velocities
of 60°.s-1 (5 consecutive repetitions) and 180°.s-1 (25 consecutive repetitions) for the
dominant and nondominant limb. Significant bilateral differences were only found
between the three sport groups. At 60°.s-1, cyclists generated greater dorsiflexion PT for
the dominant limb (28.7Nm) when compared to the nondominant (24.8Nm), soccer
players produced greater dorsiflexion PT for the nondominant limb (34.4Nm) when
compared to the dominant limb (31.3Nm), and gymnasts showed a significantly higher
TR for the nondominant limb (37.7%) when compared to the cyclists (23.3%). At
180°.s-1, gymnasts generated greater plantarflexion PT for their nondominant limb
(39.7Nm) when compared to the dominant limb (36.7Nm) and gymnasts had a
significantly higher TR and WR for the nondominant limb (44.3% and 57.3%,
respectively) when compared to the cyclists (29.3% and 26.2%, respectively). For all
9
dorsiflexion and plantarflexion, the non-athletes had a significantly lower ER than the
gymnasts or soccer players, but only had slightly lower ER than the cyclists for
plantarflexion. These findings suggest that the sport-specific requirements of these
different athletes may lead to significant bilateral differences in isokinetic muscular
performance. For example, the authors (35) suggested that stepping forward on the foot
pedal would result in improved plantarflexion isokinetic strength but minimal
improvements in dorsiflexion isokinetic strength.
The effect of aging on isokinetic peak torque
Fugl-Meyer, Gustafsson, and Burstedt (1980)
The purpose of this study was to establish normal physiological data during isometric
and isokinetic plantarflexion muscle actions, and to determine if peak torque (PT) could
be predicted from demographic and anthropometric measures. Sixty-nine female and
sixty-six males (age 20 - 65) volunteered for this study. Age, sex, weight, height, and
crural circumference (between the upper and middle thirds of the lower leg) were
recorded. The participants were positioned supine in a Cybex II dynamometer (Lumex
Inc., New York), with their legs fully extended at 0° below the horizontal plane or flexed
at 90° in a randomized order. All participants performed maximal isokinetic muscle
actions at 30, 60, 90, 120, and 180°·s-1 with their ankle joint starting in maximum
dorsiflexion. Isometric PT was measured at maximum dorsiflexion and the same joint
angle where PT occurred during the isokinetic muscle action at 30°·s-1. For both sexes,
PT was lower at the flexed leg position when compared to the fully extended position,
however females generated less PT compared to males at all velocities. Participants
10
younger group (approximately 70%). The authors (13) suggested that the decrease is PT
at 90° is supported by a decrease in medial gastrocnemius muscle activation (e.g. EMG
amplitude) and tension with the leg flexed. In addition, the age-related decrease in
isokinetic strength may be related to changes in skeletal muscle morphology (e.g. fiber
type alterations) rather than muscle size.
Gerdle and Fugle-Meyer (1985)
The purpose of this study was to develop a clinically applicable prediction equation
for plantarflexion peak torque (PT) and contractile work (CW) in healthy middle-aged
and elderly adults. The secondary purpose was to evaluate the relationship between CW
and electromyographic (EMG) amplitude of the soleus (Sol), medial gastrocnemius (MG),
and lateral gastrocnemius (LG) muscles. Eighty-eight (male, n = 45; female, n = 43)
healthy individuals between the ages of 40-64 years were recruited for this study.
Demographic (age and gender) and anthropometric measures of height, weight, leg length,
and crural circumference (between the upper and middle thirds of the lower leg) were
recorded. The participants were positioned supine in a Cybex II dynamometer (Lumex
Inc., New York) with their hips and legs fully extended (0° below the horizontal plane).
Three maximum plantarflexion isokinetic muscle actions were performed at 30, 45, 60,
120, and 180°·s-1 with surface EMG electrodes placed on the left or right MG, LG, and
Sol muscles (limb was randomized). The elderly group (60-64 yrs) demonstrated a
steeper decrease in PT (60Nm reduction from 60 to 180°·s-1) and CW (33 J decrease from
60 to 180°·s-1) at the highest velocity when compared to the younger groups.
EMG/maneuver time (the ratio of muscle activation over the amount of time it took for
11
4.4 watts, females = 2.91 - 2.74 watts), and was unaffected by age. The age and sex
variables correlated the best with the generated PT and CW prediction equations for the
elderly participants. The authors (15) suggested that the loss of muscle fibers that is
associated with aging is responsible for the significant decrease in PT, CW, and EMG
amplitude in the elderly group. However, the consistency of the EMG/maneuver time
indicates that motor unit recruitment occurs independent of velocity and age.
Gerdle and Fugle-Meyer (1986)
The purpose of this study was to establish a clinically acceptable prediction equation for
isokinetic plantarflexion peak torque (PT) and contraction work (CW) in individuals
between 40 and 64 years old. Eighty-eight (men, n = 45, women, n = 43) healthy
individuals were recruited for this study. Demographic (age and sex) and
anthropometric measures of height, weight, leg length, and crural circumference
(between the upper and middle thirds of the lower leg) were recorded. The participants
were positioned supine with their hips and legs fully extended in a Cybex II dynamometer
(Lumex Inc., New York). Participants performed three maximum isokinetic
plantarflexion muscle actions with each leg (in a randomized order) at 30, 60, 120, and
180°.s-1. A prediction equation for PT and CW, using the recorded anthropometric
measures, was generated for each age group and isokinetic velocity. The age, gender,
and crural circumference measures were able to explain greater than 60 percent of the
variance in PT and CW between the participants at 30, 60, and 120°·s-1 (30°·s-1 = 0.82
and 0.63; 60°·s-1 = 0.79 and 0.63; and 120°·s-1 = 0.75 and 0.60). Aging showed a
negative relationship with the PT and CW prediction equations. The results also
12
velocity (30°·s-1 = 14°, 60°·s-1 = 21°,120°·s-1 = 27°, 180°·s-1 = 31°). The authors (16)
suggested that the decrease in r2 values with the increase in isokinetic velocity is due to
the increased contribution of the gastrocnemius muscles to that of the soleus for torque
production at greater velocities.
Whipple, Wolfson, and Amerman (1987)
The purpose of this study was to examine differences in leg extension and flexion
and plantar- and dorsiflexion isokinetic peak torque (PT) and power output in elderly
participants with and without a history of falls. Seventeen "fallers" (age 82.2) and 17
nonfallers (age 84.6) (males = 3 per group; and females = 14 per group) volunteered for
this study. The participants performed eight to ten isokinetic muscle actions (extension
and flexion) with the dominant limb on a Cybex II dynamometer (Lumex Inc., New York)
at 60 and 120°·s-1 (contralateral limb was used if injury prevented testing on the dominant
limb). The participants were seated erect with their leg flexed (90°) for the leg
extension and flexion assessments, and seated at a semi-supine angle of 30° for plantar-
and dorsiflexion assessments. The fallers generated 12% of their leg extension PT
(12.1Nm) when performing plantarflexion (2.2Nm), while the nonfallers generated
24.1% of their leg extension PT (33.2Nm) when performing plantarflexion (8.0Nm). At
120°·s-1, the nonfallers produced 19.8% greater power output (9.0Nm·rad·s-1) when
compared to the fallers (1.8Nm·rad·s-1). In addition, the fallers produced 7.5 times less
dorsiflexion power output (0.42Nm·rad·s-1) when compared to the nonfallers
(3.21Nm·rad·s-1). The authors (42) indicated that this was the first study to demonstrate
a decrease in lower extremity PT and power output in elderly participants with a history
13
(especially at higher velocities) in the fallers may be related to the substantial decline in
type II muscle fibers and may lead to greater joint instability in elderly adults
The effect of aging on muscle structure and function
Vandervoort AA and McComas AJ (1986)
The purpose of this study was to examine the effects of aging on the contractile
properties of plantar- and dorsiflexor muscles. One hundred and eleven healthy men
and women (between 20-100 years old) volunteered for this study. The participants
were positioned at 10° of dorsiflexion for isometric plantarflexion testing and 30° of
plantarflexion for isometric dorsiflexion testing (0° or neutral = 90° between the foot and
leg). Voluntary or evoked torque responses were measured using an oscilloscope
(Hewlett-Packard type 141B) and stimulated M-waves were measured using
electromyographic (EMG) recording electrodes. Participants performed multiple
maximum voluntary contractions (MVC) for five seconds prior to the application of the
electrical stimuli. Stimulating electrodes were placed on the skin at the peroneal nerve
at the neck of the fibula and the uppermost part of the tibialis anterior muscle during
dorsiflexion and over the popliteal fossa during plantarflexion. Muscle cross-sectional
area (CSA) was examined with a B-mode ultrasound imaging system at the greatest girth
of the calf. Estimations of the number of motor units were taken from the five eldest
participants by using subthreshold stimulation increments and comparing it with their
maximal M-wave values. The eldest men (80-100 yrs) produced less voluntary torque
(56% for dorsiflexion, 55% for plantarflexion) and stimulated twitch torque (38% for
dorsiflexion, 23% for plantarflexion) when compared to the youngest group (20-30 yrs).
14
estimated number of motor units (70% reduction) when compared to the younger adults
(CSA = 36.5cm). The authors (40) suggested that by the age of 75, only 80% of
voluntary strength is remaining and this may be caused by the denervation of motor units.
The decrease in muscle CSA that occurs with aging is reduced by the increased presence
of connective tissue following the atrophy of the type II fibers, and this is the primary
cause of the large decrease in muscle strength, with only a slight decrease in muscle CSA,
that is seen with aging.
Lexell, Taylor, and Sjöström (1988)
The purpose of this study was to examine the age related changes in muscle area,
total number, size, proportion, and distribution of fiber types of the vastus lateralis in men.
Forty-three previously healthy male cadavers (15-83 years old) that were less than three
days post-mortem were used in this study. A 10 mm slice was taken from the vastus
lateralis (taken half way between origin and insertion) and stained for mATPase. A 1x1
square grid was placed on the muscle cross-section to divide the muscle into quadrants
and then it was used to calculate muscle area (multiplying the number of sampled
quadrats by 48), fiber density (mean number of fibers per mm2), total number of fibers
(multiplying muscle area by fiber density) and proportion of fiber types (values of type I
and type II in the squares). Fiber size was calculated by measuring fibers of each type
in five different regions (for each region, one fiber was selected and 24 of the closest
fibers of the same type were measured). Fiber type distribution was measured by taking
the amount of type I fibers in every 48th mm2 cross-section and then it was converted it
into a contour plot. For the older age groups (70 and 80), the muscle fibers were not as
15
not seen in the younger age groups (e.g. angulated fibers, variations in fiber shape, and
isolated fibers). Muscle area reached its peak size at 23.7 years of age and showed a
40% drop from 20 to 80 years old. For fiber size, type II fibers decreased with
increasing age and demonstrated a 26% reduction from 20 to 80 years old, while no
significant relationship was shown between age and the size of type I fibers. For fiber
density, the younger groups demonstrated that 70% of their muscle area was comprised of
muscle fibers, while the older groups only demonstrated that 50% of their muscle area
was comprised of muscle fibers. In addition, type II fibers were more superficial and
type I fibers were deeper in the muscle of younger groups, whereas the older groups did
not show a clear distribution between the two fiber types. The authors (27) suggested
that denervated and inactive fibers are the cause for the change in fiber size and number
(especially in type II fibers) and that the replacement of those fibers by fat and fibrous
tissue is responsible for the decrease in fiber density.
Brooks SV and Faulkner JA (1988)
The purpose of this study was to examine the change in contractile properties of the
soleus (Sol) and the extensor digitorum longus (EDL) muscles in young, adult, and aged
mice. Fifty-five male mice (young (2-3 months) n = 11, 15; adults (9-10 months) n = 14,
18; aged (26-27) n = 14, 18; respectively for the Sol and EDL) were used in this study.
The Sol and EDL muscles were removed from the mice and isolated in silk sutures. The
muscles were then stimulated by two platinum electrodes (200 µm pulse at a
supramaximal intensity) to measure twitch force, contraction force, half-relaxation time,
and shortening velocity. Following the stimulus, the muscles were blotted, weighted,
16
20 (Sol) and 13% (EDL) decrease in muscle mass when compared to the adult mice. No
significant changes were found for fiber length or cross-sectional area with aging when
compared to the younger groups. The aged group showed a decrease in maximum
isometric torque for the EDL muscle (18.6Nm) when compared to the young (23.0Nm)
and adult (23.8Nm) groups. The authors (6) suggested that the decrease in maximum
force with aging is not due to changes in pennation angle or alterations in myosin ATPase
or myosin light or heavy chains due to the lack of changes in fiber length/muscle length
ratio or the force-velocity relationship. The reduction in the number of cross-bridges
during the driving stroke of a contraction could be the cause of the decrease in force by
the skeletal muscle.
Narici, Maganaris, Reeves, and Capodaglio (2003)
The purpose of the study was to examine the sarcopenic changes in muscle mass and
structure. Sixteen elderly men (70-81 years old) and fourteen younger men (27-42 years
old) volunteered for this study. Muscle cross-sectional area (CSA) and volume were
determined with the participants positioned supine in a General Electric scanner
(ProSpeed Sx power) and by measuring the size of the medial gastrocnemius (MG) in 40
continuous images. Resting fascicle length (Lf) and pennation angle was examined in
the dominant limb at the midbelly of the MG using realtime ultrasound (HDI-300, ATL,
Bothell) with the probe placed along the median longitudinal plane of the MG muscle.
The younger groups showed a greater muscle CSA (17.4cm2) and volume (279.3cm3)
when compared to the elderly group (CSA = 14.0cm2; volume = 208.7cm3). The
younger group also had a longer Lf (4.78cm) and a greater pennation angle (27.2°) when
17
that the decrease in pennation angle and shortening of the fascicles was related to the loss
of sarcomeres in parallel and in series. In addition, the shortened fascicles and reduction
in muscle volume resulted in a significant decrease in physiological CSA.
Clark DJ et al. (2010)
The purpose of this study was to examine the influence of rapid muscle activation on
isokinetic leg extension peak torque and power output between healthy middle-aged, old,
and mobility limited older adults. Eighty-nine participants (healthy middle-aged (MH)
aged 40-55 yrs, n = 29; healthy old-aged (OH) aged 70-85 yrs, n = 28; limited mobility
old-aged (LM) aged 70-85, n = 32) volunteered for this study. Participants were seated
upright with their dominant leg flexed at 90° in a Cybex-II dynamometer (Cybex,
Ronkonkoma, NY). Five consecutive maximum isokinetic muscle actions were
performed at 60, 90, 180, and 240°·s-1(progressing from slowest to fastest velocity).
Three isometric maximum voluntary contractions were performed with the leg fixed at
60° leg flexion. Surface electromyographic (EMG) electrodes were placed on the rectus
femoris (RF), vastus medialis (VM), vastus lateralis (VL), biceps femoris (BF), and
semimembranosus (SM) to measure muscle activation. Computer tomography scans
using a Siemens Somatom Scanner (Erlangen, Germany) were used to determine muscle
cross-sectional area (CSA) (at the midpoint of the femur). In addition, normalized
torque (torque divided by total quadriceps CSA) and specific torque (torque divided by a
specific muscle's CSA) values were calculated. The LM group produced significantly
lower normalized torque, specific torque (at 240°·s-1) and power output than the other
groups. For muscle activation, EMG amplitude values were lower for the LM elderly
18
suggested that the decrease in power output and peak torque is not completely attributed
to a decrease in muscle size but also a reduction in agonist activation for the mobility
impaired older adults. The authors also speculated that the mechanisms for the impaired
neuromuscular activation may be related to decreased inhibition between cerebral
hemispheres, reduced excitability of the corticospinal pathway, and/or a decrease in
cortical projections to motor-neurons.
The effects of aging on echo intensity and muscle cross sectional area
Goodpaster et al. (2001)
The purpose of this study was to examine the relationship of computer tomography
(CT) derived muscle quality and muscle strength in older individuals. One thousand
two hundred and eighty-five men (73.7 ±2.9 years) and 1, 342 women (73.3 ± 2.9 years)
volunteered for this study. CT scans of the mid-thigh were obtained by either a
Somatom Plus 4 (Siemens, Erlangen, Germany), 9800 Advantage (General Electric,
Milwaukee, WI), or PQ 2000S (Marconi Medical Systems, Cleveland, OH) to measure
muscle cross-sectional area (CSA). Skeletal muscle mass, adipose tissue, and muscle
quality (average CT pixel intensity) was calculated with the IDL development software
(RSI Systems, Boulder, CO). Muscle quality was calculated from muscle attenuation
coefficients of the outlined muscle area, with the lower values reflecting greater muscle
quality. The participants performed three maximum effort leg extensions on an
isokinetic dynamometer (model 125 AP, Kin-Com, Chattanooga, TN) at 60°·s-1. Muscle
quality showed a negative relationship with BMI in men (-0.44) and women (-0.43) and
total body fat (-0.53). Muscle CSA demonstrated a positive relationship with BMI (men
19
demonstrated a positive relationship with maximum torque (0.20) and specific torque
(0.26) for all participants. The authors (17) suggested that the lower muscle quality that
occurs with aging is caused by the decrease in muscle fiber density, and that there is an
increase in lipid concentration in skeletal muscle. The reduction in type II fibers
correlates to the reduction in maximal strength and the increase in type I fibers
contributes to the increased lipid content in the muscle. In addition, obese individuals
have increased subcutaneous adipose tissue and lower muscle quality, resulting in
reduced muscle strength.
Cadore et al. (2012)
The purpose of this study was to examine the effects of aging on the relationship
between echo intensity (EI), neuromuscular, and cardiorespiratory performances.
Thirty-one elderly males (64.7 + 4.1 years) volunteered for this study. Each participant
performed maximal voluntary isometric contractions of the leg extensors and flexors, and
maximal leg extension and flexion isokinetic muscle actions at 60, 180 and 360°·s-1 on an
isokinetic dynamometer (Biodex, New York, USA). A B-mode ultrasound (Philips,
VMI, MG, Brazil) unit was used to examine muscle thickness (MT) in all of the
quadriceps femoris (QF) muscles and echo intensity (EI) of the rectus femoris (RF)
muscle. The RF muscle images were analyzed using the gray-scale histogram function
and the analyze function in Image-J software (National Institute of Health, USA, version
1.37) to determine EI. Force per unit of muscle mass was calculated by dividing the
isometric peak torque by the MT of the sum of the muscles of the QF. Peak oxygen
uptake (VO2peak), and the workload at the first and second ventilatory threshold (VT1, VT2)
20
A significant negative relationship was observed between EI and the isometric and
isokinetic peak torque (PT) values (isometric PT = -0.51; PT at 60°·s-1 = -0.48; PT at
180°·s-1 = -0.64; PT at 360°·s-1 = -0.64), and between EI and VT values (VT1 = -0.46,
VT2 = -0.50). For MT, a significant correlation was observed between VI, VM, and the
summed MT of all the muscles of the QF and the corresponding isometric PT and
isokinetic PT at all velocities (values ranging from 0.42 to 0.63). For cardiorespiratory
performance, significant correlations were observed between the workload at VT1 and
VT2 and force per unit of muscle mass, isometric PT, and isokinetic PT. The authors (8)
suggested that the increase in intramuscular connective tissue resulted in an increase EI
and subsequent decrease in muscle strength and workload at VT1 and VT2 which may be
explained by the age related decrease in capillaries. In addition, the positive correlation
between force per unit of muscle mass and cardiorespiratory performance implies that the
endurance performance in elderly men is related to the frequency and recruitment of
fibers rather than MT.
Fukumoto et al. (2012)
The primary purpose of this study was to examine the relationship between muscle
quality measured from echo intensity (EI), muscle strength, and muscle thickness (MT) in
middle-aged and elderly women. The secondary purpose was to examine the
relationship between EI and body composition. Ninety-two women (70.4 + 6.6 years)
volunteered for this study. A B-mode ultrasound (LOGIQ e; GE Healthcare UK Ltd.,
Chalfont, Buckinghamshire, England) was used to examine MT and fat thickness (FT) of
the rectus femoris (RF) and the vastus intermedius muscles and EI of RF. EI was
21
Elements (Abode Systems Inc., San Jose, CA). The participants used a battery-operated
impedance instrument (Muscle-α; Art Haven 9, Kyoto, Japan) to calculate body fat
percentage and body mass index (BMI). Participants were positioned on an isometric
dynamometer (Isoforce GT-330; OG GIKEN Co., Okayama, Japan) with their leg flexed
at 60° and performed two maximal isometric leg extension muscle actions. MT showed
a positive relationship with BMI (0.39) and muscle strength (0.47), but a negative
relationship with age (-0.40). EI demonstrated a positive relationship with age (0.34)
and negative relationship with strength (-0.40), while muscle strength showed a positive
relationship with BMI (0.22) and a negative relationship with age (-0.32). The authors
(14) suggested that muscle quantity (MT) and muscle quality (EI) independently effect
muscle strength, and the age-related decrease in strength maybe due to the reduction of
type II fibers or muscle satellite cells. In addition, EI of the muscle is not related to FT
of the muscle, total body fat percentage, or BMI, and only correlates to the adipose and
CHAPTER III METHODOLGY Participants
Twenty young males (age 18-30) and ten older males (age 65-74) were recruited
from the University of North Carolina at Chapel Hill (UNC-CH) and the nearby
community (Table 1). Participants were excluded if they are accumulating more than 1
- 5 hours of exercise per week, had a current or recent injury of the low back, hip, knee,
or ankle within the past three months, or a neuromuscular disease that may affect their
ability to produce maximum torque. Prior to testing, participants filled out a health
history and exercise status questionnaire, and a written informed consent form approved
by the University's international review board.
Experimental Design
The participants reported to the UNC-CH Neuromuscular Research Laboratory and
completed two sessions lasting approximately 60 minutes each. The first session was
the familiarization trial where they had their height and body mass measured, underwent
a musculoskeletal ultrasound imaging assessment to examine muscle size and quality, and
practiced the isokinetic strength testing protocol. Approximately 2-7 days following the
familiarization trial, at the same time of day (±2hrs), all participants underwent the same
ultrasound imaging assessment followed by the isokinetic strength testing.
Isokinetic Strength Testing:
23
(Computer Sports Medicine Inc., Stoughton, MA, USA). The participants were seated
at a 135° angle between the thigh and torso with a restraining strap across the thigh and
the participants' arms crossed in front of their chest. The participants' right leg was fully
extended (0° below the horizontal plane) with their foot placed firmly against the foot
plate and the lateral malleolus of the fibula aligned with the axis of rotation of the
dynamometer. The range of the motion for the ankle joint was set from 20°
plantarflexion to 50°dorsiflexion(with 0°representing the ankle at an approximately 90°
angle). The foot was secured in a heel cup attached to the footplate with toe and ankle
straps over the toes and metatarsals (distal to the malleoli).
Each participant performed three consecutive maximal isokinetic muscle actions at
both slow (30°·sec-1) and fast (120°·sec-1) velocities in random order (7). One minute of
rest occurred between the three muscle actions at each velocity. Previous studies have
suggested these speeds represent a slow and fast velocity during plantarflexion that still
exhibit a load range (7, 13, 16). The testing began with the investigator passively
pushing the footplate into dorsiflexion at a velocity of 20°·sec-1 until a verbal cue of a
slight stretch is given by the participant. The investigator would immediately release
the footplate and the participant plantarflexed as hard and as fast as possible until the
footplate reaches the end of the range of motion (20° of plantar flexion). The participant
performed three consecutive isokinetic muscle actions at each velocity in random order.
One minute of rest was given between the three muscle actions at each velocity.
Ultrasound Acquisition
The cross-sectional area (muscle size) and echo intensity (muscle quality) of the
24
Healthcare, Wauwatosa, WI, USA) at approximately 1/3rd the distance from the articular
cleft between the femur and tibia condyles to the lateral malleolus (34). These
assessments took place with the participants lying prone and their foot fixed against a
wooden platform at a neutral joint angle (90° between the foot and the leg). During the
assessments all participants were asked to relax as much as possible. To ensure the
12L-RS ultrasound probe (5-13 Hz) moved along the transverse plane (from lateral to
medial), a high-density foam pad was placed perpendicular to the longitudinal axis of the
plantarflexor muscles. A generous amount of water-soluble transmission gel was
applied to the skin and probe to improve acoustic coupling. The participants were asked
to refrain from vigorous physical activity prior to testing for a minimum of 24 hours.
Image-J software version 1.37 (National Institute of Health, MD, USA) was used to
determine muscle CSA and echo intensity.
Panoramic ultrasound images of the medial gastrocnemius were recorded using
LogicView software which complied overlapping images and determined the X, Y, and
rotational offsets between the adjacent images. The software used this orientation
information and the images to construct one composite image of the entire muscle (5).
Echo intensity (EI) and muscle cross-sectional area (CSA) were measured using the
polygon function in Image-J. The area of the manually traced muscle was used to
calculate muscle CSA. The entire muscle was manually traced inside the surrounding
fascia. One instructor performed the manual tracing for all the participants. EI values
were determined using the histogram function, where pixels of the image were expressed
in values ranging from 0 to 255 (black = 0, white = 255) and the mean gray scale value
25
were examined at a depth of 4 cm using the musculoskeletal setting at a frequency of 10
MHz and a gain of 68 dB.
Signal Processing
All signals were collected using a Biopac MP150 data acquisition system (Biopac
Systems Inc., Goleta, CA, USA) using AcqKnowledge software (Biopac Systems Inc.,
Goleta, CA, USA). Torque, position, and velocity signals were sampled from the
dynamometer at 2500 Hz. Data was stored on a personal computer and processed
offline through custom written LABView (National Instruments Corporation., Austin, TX)
software. Isokinetic peak torque was calculated from the highest consecutive 50 data
points occurring during the isokinetic load range from the isokinetic muscle action that
generated the highest peak torque value (19). The load range is the time frame at which
the limb is moving at the designated speed (30°·sec-1 or 120°·sec-1), and does not include
any acceleration and deceleration. The torque, position, and velocity signals were
filtered using a zero-phase shift 100-point moving averager. The torque data was
gravity corrected for the weight of the foot plate. No gravity correction was performed
for the weight of the foot per the recommendation of Salsich et al. (34) who indicated that
the foot's mass was considered negligible (approximately 1.5% of the body's mass).
Statistical Analysis:
Four independent t-tests were used to analyze the differences between muscle CSA,
EI, isokinetic peak torque at 30°·sec-1, and isokinetic torque at 120°·sec-1 between to the
age groups. Pearson product moment correlations were used to examine the
relationships between all four variables for both young and old men. Partial correlations
26
independent of muscle size; and the relationship between muscle size and muscle strength
independent of muscle quality for both young and old men. The alpha level was set at P
≤ 0.05, and all analyses were performed with SPSS version 20 (SPSS Inc., Chicago, IL,
CHAPTER IV RESULTS Isokinetic Peak Torque
For isokinetic peak torque, the older men produced 21% and 23% (106.4 ± 14.5 and
60.2 ± 8.6 Nm) less torque during the slow (30°·sec-1, P<0.005) and fast (120°·sec-1,
P<0.005) velocities when compared to the younger men (134.4 ± 25.2 and 78.2 ± 14.4
Nm, Figure 1).
Echo Intensity
Echo intensity values were lower for the young men (P<0.005, Figure 3) when
compared to the older men. For the young men, there was a negative relationship
between EI and muscle CSA (r=-0.533, P=0.015). In addition, there was a negative
relationship between isokinetic peak torque at the slow velocity (r=-0.512, P=0.021), but
no relationship between EI and isokinetic peak torque at the fast velocity (r=-0.424,
P=0.062) (Tables 2 and 3). Partial correlations found no relationship between EI and
isokinetic peak torque at the slow (r=-0.160, P=0.514) or fast (r=0.050, P=0.838)
velocities, independent of muscle CSA, in the young group (Table 5). For the old
group, there was a negative relationship between EI and muscle CSA (r=-0.701,
P=0.024), but no relationship between EI and isokinetic peak torque at the slow (r=0.011,
P=0.976) or fast (r=-0.195, P=0.589) velocities. There was no relationship between EI
and isokinetic peak torque at the slow (r=0.133, P=0.733) or fast (r=-0.101, P=0.797)
28 Muscle Cross-sectional Area
Medial gastrocnemius CSA was not different between young and old men (P=0.166,
Figure 2). For the young men, there was a positive relationship between muscle CSA
and peak torque at the slow (r=0.812, P<0.001) and fast (r=0.839, P<0.001) velocities
(Table 2). There was a positive relationship between CSA and isokinetic peak torque at
the slow (r=0.742, P<0.001) and fast (0.800, P<0.001) velocities, independent of EI, for
the young group (Table 4). For the old group, there was no relationship between muscle
CSA and peak torque at the slow (r=0.119, P=0.744) or fast (r=0.178, P=0.623)
velocities. There was no relationship between muscle CSA and peak torque at the slow
(r=0.177, P=0.648) or fast (r=0.058, P=0.882) velocities, independent of EI for the old
CHAPTER V DISCUSSION
A primary finding of the current study was the decrease in isokinetic peak torque at
both slow (21%) and fast (23%) velocities in the older men. These results are similar to
a previous study by Thelen et al. (36). The authors reported a 25% reduction in peak
torque at both 30°·sec-1 and 120°·sec-1 in the older group when compared to the younger
group. Similarly, Fugl-Meyer et al. (13) reported a 29% decrease in peak torque at the
slowest velocity (30°·sec-1) for the older men, however, the authors reported a greater
decrease in peak torque at faster velocities (90°·sec-1 = 40%, 180°·sec-1 = 59%). The
findings reported by Fulg-Meyer and colleagues (13) coincide with previous research that
suggest as the angular velocity increases, there is a greater reduction in peak torque
between young and old men. For example, Always et al. (3) reported a 30% decrease in
peak torque at 30°·sec-1 and a 35% decrease at 120°·sec-1. Cunningham et al. (11) also
reported a 30% decrease at (30°·sec-1), but a larger reduction in strength (52%) at
120°·sec-1. The greater reduction in peak torque at faster velocities reported in previous
studies has been attributed to decreases in the number of type II fibers (25, 26, 40),
decreases in pennation angle, shortening of the fascicles (31), and/or decrease in
neuromuscular activation (10). A possible explanation for the higher peak torque values
generated at the faster velocity for the old men in the current study when compared to
previous studies, may be related to their physical activity status. For example,
30
rated themselves as recreationally inactive and Cunningham et al. (11) studied older
adults who reported exercising on average 1.5 hours per week. The older men in the
current study reported exercising 4.3 ± 1.1 hours per week (young = 8.9 ± 4.1 hours per
week). Thus, it is possible that greater habitual levels of physical activity may reduce
the magnitude of age-related decreases in peak torque often seen at fast isokinetic
velocities. This was previously supported by Kent-Braun and colleagues (20) who
suggested that greater levels of physical activity may attenuate the accumulation of
intramuscular fat and subsequent muscle function.
One of the most common mechanisms that are attributed to the age-related
reductions in peak isokinetic strength is a loss of skeletal muscle mass (2, 40). The
older men in the current study did not demonstrate an age-related reduction in medial
gastrocnemius muscle CSA. These findings are in contrast to previous studies who have
specifically examined the plantar flexor muscles (3, 31, 37, 40). For example, it has
been reported that older men demonstrated a 17.3 - 23.3% smaller plantarflexor muscle
CSA than their younger counterparts (3, 31, 40). However, fewer authors have
reported non-significant age-related changes in muscle CSA for the dorsiflexor muscles
(20) and quadriceps muscles (24). Larsson et al. (24) reported no change in thigh
circumference between the 20-29 year old age group and the 60-69 year old age group,
whereas Kent-Braun and colleagues (20) reported no change in dorsiflexor muscle area
between the young and old men. As mentioned in the previous paragraph, physical
activity status may attenuate overall reductions in muscle CSA (20). In addition,
Williams et al. (21) have suggested that training can also slow the denervation of type II
31
study was a positive relationship between muscle CSA and isokinetic strength in the
young men (30°·sec-1 r= 0.812, 120°·sec-1 r= 0.839), but not for the old men (30°·sec-1 r=
0.199, 120°·sec-1 r= 0.178). Many previous studies have documented a significant
relationship between muscle size and strength in young men (13, 36, 39). The lack of
relationship between muscle CSA and isokinetic strength in the older men in the current
study may be a result of the lack of change in muscle CSA when compared to the
younger men (Figure 2) but significant decrease in peak torque at both velocities. Thus,
it is possible anatomical muscle CSA may have not changed but the quality of the tissue
may have been altered leading to a reduction in peak strength. These findings may be
supported by the increases in EI observed in the older men (Figure 3) and potential
increase in non-contractile tissue (i.e. fat and connective tissue). Thus, it is possible that
older men in the current study have no detectable changes in muscle CSA, but a greater
proportion of non-contractile tissue.
The age-related reduction in muscular strength has been attributed to a decrease in
the muscle quality (8, 14, 17). This current study demonstrated that old men had a
higher EI value (lower muscle quality) when compared to the younger men. These
findings along with previous research addressing muscle quality and EI (8, 14) provide
further support that muscle quality may be reduced as we age. An increase in EI is
speculated to be the result of an increased amount of intramuscular fat and connective
tissue that is commonly seen with aging resulting in a more hyperechoic US image (14).
Both the young and old men in the current study demonstrated a negative relationship
between EI and muscle CSA. Although speculative, these findings may suggest that
32
given area (26). A negative relationship was also found between EI and peak torque at
the slow (-0.512, P = 0.021), but not the fast (-0.424, P=0.062) velocity in the young men.
A negative relationship between EI and peak torque suggests that muscles with greater
amounts of connective or adipose tissue will less peak torque. However, this
relationship is lost once the data was normalized for muscle CSA. Previous studies
have reported a negative relationship between EI and strength in older adults (R= -0.40 to
-0.67; 8, 14). Our findings are in contrast to these results and may be related to the lack
of changes in muscle CSA. For example, Fukumoto et al. (14) have reported that older
adults experience a simultaneous reduction in muscle quality (8, 14, 17) and size, thus the
proportion of non-contractile tissue is greater in a smaller muscle. However, in the
current study, it is possible that proportion of non-contractile tissue increased in the older
men, without changes in muscle CSA. It is also possible that these findings are limited
by the small sample of elderly men (n=10). Future studies, with larger sample sizes are
needed to further explore these issues.
In conclusion, this is first study to investigate the relationship between age, isokinetic
strength at both slow and fast velocities, muscle size, and muscle quality in the
plantarflexor muscles. The age-related reductions in maximal dynamic isokinetic
strength in the current study were likely not due to decreases in muscle CSA, but a
reduction in muscle quality. Although no consistent relationship was found between
isokinetic strength and EI, past research still suggests that muscle quality is an important
factor in torque production (8). In the current study muscle CSA has been shown to
have less of an impact on peak torque in old men, which is suggested to be caused by
33
torque, specifically at faster velocities, may suggest an influence of physical activity
status, which previous authors have noted to influence the number of non-contractile
tissue within skeletal muscle (20, 21). The decrease in isokinetic strength with aging
has been linked with an increased risk of falling in older men (4, 31). Future studies
should look to examine differences in muscle strength, quality and size in different older
populations such as those with a history of falling or lower leg injuries. Research could
also be applied to investigating intervention techniques or protocols that inhibit the
age-related decreases in strength, size, and muscle quality to help further fall prevention
34
Table 1. Means ± SD for age, stature, and body mass for the young (n = 20) and old (n = 10) men.
Young Old Age (years) 20.4 ± 1.9 68.3 ± 2.9* Stature (cm) 175.6 ± 6.1 175.3 ± 5.6 Body mass (kg) 75.2 ± 11.9 80.1 ± 8.9 * indicates a significant difference between groups (P<0.01)
Table 2. Pearson product moment correlation coefficients between Isokinetic 30, Isokinetic 120, CSA, and EI for the young men.
Isokinetic 30 Isokinetic 120 CSA EI
Isokinetic 30 (Nm) - 0.786** 0.812** -0.512*
Isokinetic 120 (Nm) - 0.839** -0.424
CSA (cm2) - -0.533*
EI (a.u.) -
Isokinetic peak torque at 30°·sec-1 (Isokinetic 30), isokinetic peak torque at 30°·sec-1 (Isokinetic 120), muscle cross-sectional area (CSA), and echo intensity (EI)
Statistical significance: * P < 0.05, ** P < 0.01
Table 3. Pearson product moment correlation coefficients between Isokinetic 30, Isokinetic 120, CSA, and EI for the old men.
Isokinetic 30 Isokinetic 120 CSA EI
Isokinetic 30 (Nm) - 0.846** 0.199 0.011
Isokinetic 120 (Nm) - 0.178 -0.195
CSA (cm2) - -0.701*
EI (a.u.) -
Isokinetic peak torque at 30°·sec-1 (Isokinetic 30), isokinetic peak torque at 30°·sec-1 (Isokinetic 120), muscle cross-sectional area (CSA), and echo intensity (EI).
Statistical significance: * P < 0.05, ** P < 0.01
Isokinetic peak torque at 30°·sec-1 (Isokinetic 30), isokinetic peak torque at 30°·sec-1 (Isokinetic 120), muscle cross-sectional area (CSA), and echo intensity (EI).
Statistical significance: * P < 0.05, ** P < 0.01
Table 4. Partial correlation coefficients between CSA, Isokinetic 30, and Isokinetic 120, independent of EI.
Isokinetic 30 Isokinetic 120
Young 0.742** 0.800**
35
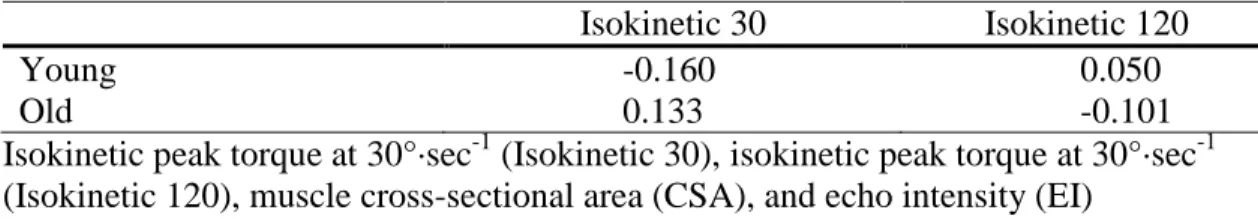
Table 5. Partial correlation coefficients between EI, Isokinetic30, and Isokinetic 120, independent of CSA.
Isokinetic 30 Isokinetic 120
Young -0.160 0.050
Old 0.133 -0.101
36
0.00 20.00 40.00 60.00 80.00 100.00 120.00 140.00 160.00 180.00
30 120 Isokinetic Peak
Torque (Nm)
Isokinetic Velocity (°•sec-1)
Young
Old
*
*
†
†
37
0.00 2.00 4.00 6.00 8.00 10.00 12.00 14.00 16.00 18.00 20.00
CSA (cm2)
Age Group
Young Old
38
0.00 20.00 40.00 60.00 80.00 100.00 120.00
Echo Intensity (a.u.)
Age Group
Young Old
*
39 Appendix
The following appendix is not to be copyrighted
Health History and Exercise Status Questionnaire
Participant ID: _______________________________________________ Date______________
Email: ___________________________________ Cell Phone ________________________
Other Phone ________________ Home
Address_____________________________________
Person to contact in case of emergency
__________________________________________
Emergency Contact Phone ______________________ Birthday (mm/dd/yy)____/_____/_____
Personal Physician ____________________________ Physician’s Phone_______________
Gender ________ Age ______(yrs) Height ______(ft)______(in) Weight______(lbs)
Does the above weight indicate: a gain____ a loss____ no change____ in the past 6 months?
If a change, how many pounds?___________(lbs)
A. JOINT-MUSCLE STATUS (Check areas where you currently have problems)
Joint Areas Muscle Areas
( ) Wrists ( ) Arms
( ) Elbows ( ) Shoulders
( ) Shoulders ( ) Chest
( ) Upper Spine & Neck ( ) Upper Back & Neck
( ) Lower Spine ( ) Abdominal Regions
( ) Hips ( ) Lower Back
P
PRREE--EEXXEERRCCIISSEETTEESSTTIINNGG H
HEEAALLTTHH&&EEXXEERRCCIISSEE S
40
( ) Knees ( ) Buttocks
( ) Ankles ( ) Thighs
( ) Feet ( ) Lower Leg
( ) Other_______________________ ( ) Feet
( ) Other_____________________
B. HEALTH STATUS (Check if you currently have any of the following conditions)
( ) High Blood Pressure ( ) Acute Infection
( ) Heart Disease or Dysfunction ( ) Diabetes or Blood Sugar Level
Abnormality
( ) Peripheral Circulatory Disorder ( ) Anemia
( ) Lung Disease or Dysfunction ( ) Hernias
( ) Arthritis or Gout ( ) Thyroid Dysfunction
( ) Edema ( ) Pancreas Dysfunction
( ) Epilepsy ( ) Liver Dysfunction
( ) Multiply Sclerosis ( ) Kidney Dysfunction
( ) High Blood Cholesterol or ( ) Phenylketonuria (PKU)
Triglyceride Levels ( ) Loss of Consciousness
( ) Allergic reactions to rubbing alcohol
C. PHYSICAL EXAMINATION HISTORY
Approximate date of your last physical examination______________________________
Physical problems noted at that
time__________________________________________
Has a physician ever made any recommendations relative to limiting your level of physical exertion? _________YES __________NO
If YES, what limitations were
recommended?___________________________________
__________________________________________________________________
D. CURRENT MEDICATION USAGE (List the drug name and the condition being managed)
MEDICATION CONDITION
__________________________ _________________________________
__________________________ __________________________________
__________________________ __________________________________
E. PHYSICAL PERCEPTIONS (Indicate any unusual sensations or perceptions.
Check if you have recently experienced any of the following during or soon after physical activity (PA); or during sedentary periods (SED))
41
( ) ( ) Chest Pain ( ) ( ) Nausea
( ) ( ) Heart Palpitations ( ) ( ) Light Headedness
( ) ( ) Unusually Rapid Breathing( )( ) Loss of Consciousness
( ) ( ) Overheating ( ) ( ) Loss of Balance
( ) ( ) Muscle Cramping ( ) ( ) Loss of Coordination
( ) ( ) Muscle Pain ( ) ( ) Extreme Weakness
( ) ( ) Joint Pain ( ) ( ) Numbness
( ) ( ) Other______________ ( ) ( ) Mental Confusion
F. FAMILY HISTORY (Check if any of your blood relatives . . . parents, brothers, sisters, aunts, uncles, and/or grandparents . . . have or had any of the following)
( ) Heart Disease
( ) Heart Attacks or Strokes (prior to age 50)
( ) Elevated Blood Cholesterol or Triglyceride Levels ( ) High Blood Pressure
( ) Diabetes
( ) Sudden Death (other than accidental)
G. EXERCISE STATUS (Please provide a precise estimation of your previous exercise habits)
Do you regularly engage in aerobic forms of exercise (i.e., jogging, cycling, walking, etc.)?
YES NO
In the past 6 months, how many hours per week do you spend performing
this type of exercise? ______ hours
Do you regularly lift weights? YES NO
In the past 6 months, how many hours per week do you spend performing
this type of exercise? ______ hours
Do you regularly play recreational sports (i.e., basketball, racquetball, volleyball, etc.)?
YES NO
In the past 6 months, how many hours per week do you spend performing
42
REFERENCES
1. Aagard P, Suetta C, Caserotti P, Magnusson SP, and Kjer M. Role of the nervous system in sarcopenia and muscle atrophy with aging: strength training as a countermeasure. Scand J Med Sci Sports. 20:49-64. 2010.
2. Akima H, Kano Y, Enomoto Y, Ishizu M, Okada M, Oishi Y, Katsuta S, and Kuno S. Msucle function in 164 men and women aged 20--84 yr. Med Sci Sports Exerc. 33(2):220-226. 2001.
3. Always SE, Coggan AR, Sproul MS, Abdujalil AM, and Robitaille PM. Muscle torque in young and older untrained and endurance-trained men. Journal of
Gerontology.51A(3):B195-B201. 1996.
4. Aniansson A, Grimby G, Hedberg A, et al. Muscle function in old age. Scand J Rehabil Med. 6:43-39. 1978.
5. Antiainan JP, Hoffren M, Hulmi JJ, Pietikainen M, Mero AA, Avela J, Kakkinen K. Panoramic ultrasonography is a valid method to measure changes in skeletal muscle cross-sectional area. Euro J Appl Physiol. 108: 273-279. 2010
6. Brooks SV and Faulkner JA. Contractile properties of skeletal muscles from young, adult and aged mice. Journal of Physiology. 404:71-82. 1988
7. Brown, L.E. and Whitehurst, M. (2000) Load range. In: Isokinetics in human performance. Ed: Brown L.E. Champaign, IL: Human Kinetics. 97-121.
8. Cadore EL, Izquierdo M, Conceição M, Radaelli R, Pinto RS, Baroni BM, Vaz MA, Alberton CL, Pinto SS, Cunha G, Bottaro M, and Kruel LFM. Echo intensity is associated with skeletal muscle power and cardiovascular performance in elderly men. Experimental Gerontology. 2012
9. Centers for Disease Control and Prevention (2012). Cost of Falls Among Older Adults. Retrieved from http://www.cdc.gov/HomeandRecreationalSafety/Falls/fallcost.html
10. Clark DJ, Patten C, Reid KF, Carabello RJ, Phillips EM, and Fielding RA. Impaired voluntary neuromuscular activation limits muscle power in mobility-limited older adults. Journal of Gerontology. 65A(5):495-502. 2010.
11. CunninghamDA, Morrison D, Rice CL, and Cooke C. Ageing and isokinetic plantar flexion. Eur J Appl Physiol. 56:24-29. 1987.
12. Daubney ME and Culham EG. Lower-extremity muscle force and balance