Computational Intelligence for
Measuring Macro-Knowledge
Competitiveness
AHMAD Q. AL-SHAMI
A thesis submitted in partial fulfilment of the requirements of
Nottingham Trent University for the degree of
Doctor of Philosophy
To my beloved mother with great gratitude for her lifelong sacrifice for the whole family. Undoubtedly, without her prayers, endless love and encouragements this
thesis would have been impossible. Thank you mom for every beautiful thing you did to make our life beautiful.
Acknowledgements
First and foremost, all praise and thanks are due to the almighty Allah, for his blessings, help and mercy along this journey and I render this and future work for His sake.
I owe my sincere appreciations and gratitude to my respectable direc-tor of studies, Dr. Ahmad Lotfi, for his guidance over the last four years. His office was always open for me for any inquiry despite his many responsibilities. Also, his patience, relentless effort and exten-sive suggestions around my work were indispensable to the accom-plishment of this research. I would like to extend a huge thank to Dr. Simeon Coleman for his advice, support, feedback and knowl-edge throughout the development of my thesis. I also thank Dr. Eugene Lai, for his support in the early stage of this project. Ac-knowledgement is also due to Professor Petr Dost´al, Brno University of Technology, Czech Republic, who gave me valuable suggestions in our discussion during his visit to Nottingham.
Moreover, I would like to show appreciation to the financial support of the School of Science and Technology at Nottingham Trent Univer-sity to participate in various international conferences. The data sets provided by the IMD Business School and the International Telecom-munication Union which partially utilised in this research is also grate-fully acknowledged.
Thanks are extended to my extended family: mother, mother and father in law, brothers and brothers in law. Your prayers and faith have inspired and encouraged me to continue with this study. In particular, I owe a huge debt of gratitude to my dear brothers Waleed and Abdullah for huge support. Without your precious guidance,
insights, and generosity, the graduate study would have been very difficult. Thanks also should gone to friends and colleagues in the School of Science and Technology / The Computing and Informatics Department in Nottingham Trent University. In addition, I would like to pay tribute to my family for their dedications, support, sympathy, and patience throughout the journey of this study. In particular, I would like to say big thanks to my wife Fatemah Alzahraa’ and our courageous son Humam and lovely daughters, Zaynab and Aya; your wonder and love have always inspired me during the happiness and sorrow of the last four years.
Ahmad Q. Al Shami August 2013
Abstract
The aim of this research is to investigate the utilisation of Computa-tional Intelligence methods for constructing Synthetic Composite In-dicators (SCI). In particular for delivering a Unified Macro-Knowledge Competitiveness Indicator (UKCI) to enable consistent and transpar-ent assessmtranspar-ents and forecasting of the progress and competitiveness of Knowledge Based Economy (KBE). SCI are assessment tools usually constructed to evaluate and contrast entities performance by aggre-gating intangible measures in many areas such as economy, educa-tion, technology and innovation. SCI key value is inhibited in its capacity to aggregate complex and multi-dimensional variables into a single meaningful value. As a result, SCIs have been considered as one of the most important tools for macro-level and strategic deci-sion making. Considering the shortcomings of the existing SCI, this study is proposing an alternative approach to develop Intelligent Syn-thetic Composite Indicators (iSCI). The suggested approach utilizes Fuzzy Proximity Knowledge Mining technique to build the qualita-tive taxonomy initially, and Fuzzy c-mean is employed to form the new composite indicators.
To illustrate the method of construction for the proposediSCI, a fully worked application is presented. The presented application employs Information and Communication Technology (ICT) real variables to form a new unified ICT index. The weighting and aggregation results obtained were compared against classical approaches namely Vector Quantisation and Principal Component Analysis, Factor Analysis and the Geometric mean to weight and aggregate synthetic composite indi-cators. This study also compares and contrasts Optimal Completion
Strategy and the Nearest Prototype Strategy to substitute missing values. The validity and robustness of the techniques are evaluated using Monte Carlo simulation.
The developed iSCI concept is generalised to build the suggested
UKCI which ultimately is equipped with short-term forecasting ca-pabilities. This achieved by a hybridised model consisting of Artifi-cial Neural Networks and Panel Data: Time Series Cross Sectional to predict and forecast the competitiveness of KBE. The proposed model has the capability of forecasting and aggregating seven major KBE indicators into a unified meaningful map that places any KBE in its league even with limited data points. The Unified Knowledge Economy Forecast Map reflects the overall position of homogeneous knowledge economies, and it can be used to visualise, identify or eval-uate stable, progressing or accelerating KBEs. In order to show the value added by the new development techniques, theUKCI is applied to fifty-seven countries initially, then expanded to include the Middle East and North Africa (MENA) region as a special case study. In total seventy-three countries were included, that are representative of developed, developing and underdeveloped economies. The final and overall results obtained, suggest novel, intelligent and unbiased results compared to traditional or statistical methods when building, not only the UKCI, but for any future composite indicator for many other fields.
Publications
The following publications have been published as a direct result of this thesis:
Refereed Journal Papers
Ahmad Al Shami, Ahmad Lotfi and Simeon Coleman “Intelligent Synthetic Com-posite Indicators with Application,” Soft Computing: Volume 17, Issue 12 (2013), Page 2349-2364, Springer Berlin Heidelberg, DOI: 10.1007/s00500-013-1098-3, ISSN: 1432-7643.
Ahmad Al Shami, Ahmad Lotfi, Simeon Coleman and Petr Dost´al, “Unified Knowledge Based Economy Forecasting,”Journal of Technological Forecast-ing & Social Change, Elsevier (Accepted subject to revision).
Refereed Conference Papers
Ahmad Al Shami, Ahmad Lotfi and Simeon Coleman, “Towards Developing 3rd Generation Intelligent Synthetic Composite Indicators,” UKCI 2012 IEEE 12th Annual Workshop on Computational Intelligence, September, 5-7, 2012 - Edin-burgh, United Kingdom.
Ahmad Al Shami, Ahmad Lotfi and Simeon Coleman, “Unified Knowledge Based Economy Neural Forecasting Map,” WCCI 2012 IEEE World Congress on Com-putational Intelligence (IJCNN), June, 10-15, 2012 - Brisbane, Australia, pp. 2008-2015. DOI: 10.1109/IJCNN.2012.6252645, E-ISBN : 978-1-4673-1489-3, Print ISBN: 978-1-4673-1488-6.
Publications
Ahmad Al Shami, Ahmad Lotfi, Eugene Lai, & Simeon Coleman, S. 2011, “Uni-fied knowledge economy competitiveness index using fuzzy clustering model,” IEEE Symposium Series on Computational Intelligence (SSCI 2011) / (CIFEr), Paris, France, April 11-15, 2011. DOI: 10.1109/CIFER.2011.5953563, Print ISBN: 978-1-4244-9933-5.
Ahmad Al Shami, Ahmad Lotfi, Eugene Lai, & Simeon Coleman, “Forecasting Macro-Knowledge Competitiveness; Integrating Panel Data Analysis and Com-putational Intelligence,” In Proceedings of the 31st International Symposium on Forecasting (ISF 2011), Prague, Czech Republic, June 26-29, 2011.
Contents
Publications vi
Contents viii
List of Figures xiv
List of Tables xvii
Nomenclature 1
1 Introduction 1
1.1 Defining Terminology . . . 3
1.2 Research Motivations . . . 4
1.3 Aims and Objectives . . . 7
1.4 Research Novelty and Contributions . . . 9
1.5 Thesis Outline . . . 11
2 Literature Review 13 2.1 Introduction . . . 13
2.2 Evaluating Knowledge Based Economy . . . 13
2.3 The Rise of Synthetic Composite Indicators . . . 14
2.4 SCI Developments Methods . . . 15
2.4.1 Multivariate Analysis . . . 16
2.4.2 Statistical Weighting Techniques . . . 17
CONTENTS
2.4.2.2 Data Envelopment Analysis and Benefit of the
Doubt . . . 19
2.4.2.3 Regression Based Weighting . . . 19
2.4.2.4 Unobserved Components Model . . . 20
2.4.3 Participatory Weighting Techniques . . . 20
2.4.3.1 Budget Allocation Process . . . 20
2.4.3.2 Public Opinion . . . 21
2.4.3.3 Conjoint Analysis . . . 21
2.4.3.4 Analytic Hierarchy Process . . . 21
2.4.4 Statistical Aggregation Techniques . . . 22
2.5 Computational Intelligence Techniques . . . 23
2.5.1 Artificial Neural Networks . . . 23
2.5.2 Fuzzy Logic . . . 23
2.5.3 Hybrid Techniques . . . 24
2.6 Prediction and Forecasting Techniques . . . 26
2.7 Summary . . . 28
3 Reasoning and Epistemology 29 3.1 Introduction . . . 29
3.2 Knowledge Theories . . . 30
3.3 Macro-Knowledge Theory . . . 31
3.3.1 Knowledge Based Economy . . . 32
3.3.2 Intellectual Capitals . . . 34
3.4 Towards A Unified Macro-Knowledge View . . . 35
3.4.1 Tacit Macro-Knowledge for Advanced KBE . . . 37
3.4.2 Competitiveness and Unified KBE Measure . . . 38
3.5 Summary . . . 40
4 Qualitative Taxonomy 41 4.1 Introduction . . . 41
4.2 The Controversy of Synthetic Composite Indicators . . . 42
4.3 Establishing the Qualitative Taxonomy . . . 45
CONTENTS
4.4.1 Fuzzy Proximity Knowledge Mining . . . 47
4.4.1.1 Soft Focused Web Mining . . . 47
4.4.1.2 Fuzzy Proximity Text Search and Match . . . 48
4.5 Developing the Qualitative Taxonomy . . . 49
4.5.1 Variable Sources . . . 51
4.5.2 Exact Text Matching . . . 52
4.5.3 Fuzzy Text Matching . . . 53
4.5.4 Reasoning and Grouping Matched Indicators . . . 55
4.6 Assembling the Unified Framework . . . 56
4.6.1 Tacit Theme . . . 58
4.6.1.1 ICT and E-Services . . . 59
4.6.1.2 Intellectual Capitals . . . 59 4.6.1.3 Innovation . . . 59 4.6.2 Explicit Theme . . . 60 4.6.2.1 Economy . . . 60 4.6.2.2 Education . . . 60 4.6.2.3 Infrastructure . . . 61 4.6.2.4 Labour Market . . . 61 4.6.2.5 Public Administration . . . 61
4.6.3 UKCI Concept Map . . . 63
4.7 Summary . . . 65
5 Data and Methods of Development 66 5.1 Introduction . . . 66
5.2 Data Collection . . . 67
5.3 SCIs Methods of Construction . . . 71
5.4 Data Treatments Methods . . . 71
5.4.1 Multivariate Analysis . . . 72
5.4.2 Data Normalisations . . . 74
5.4.3 Measures of Correlation and Association . . . 75
5.4.3.1 Pearson Correlation Coefficient . . . 76
5.4.3.2 Chi-Square Based Measures . . . 76
CONTENTS
5.5 Statistical Weighting Methods . . . 77
5.5.1 Equal Weighting . . . 78
5.5.2 PCA and Factor Analysis Weighting . . . 78
5.6 Statistical Aggregation Methods . . . 78
5.7 Computational Intelligence Techniques . . . 79
5.7.1 Fuzzy c-Means Algorithm . . . 79
5.7.2 Vector Quantization . . . 81
5.8 Missing Data Imputation Methods . . . 83
5.8.1 Fuzzy c-Means Strategies . . . 83
5.8.2 Statistical Strategies . . . 84
5.9 Predictions and Forecasting Methods . . . 85
5.9.1 Multiple Regression Analysis . . . 86
5.9.2 Panel Data Analysis: Time-Series Cross-Sectional . . . 87
5.9.3 Computational Intelligence Forecasting Methods . . . 89
5.9.3.1 Artificial Neural Network Techniques . . . 89
5.9.3.2 Self-Organising Map . . . 90
5.10 Robustness and Validation Analysis . . . 93
5.10.1 Monte Carlo Analysis . . . 93
5.10.2 Adaptive Neuro-Fuzzy Inference System . . . 93
5.11 Summary . . . 96
6 Unified Macro-Knowledge Competitiveness Framework 97 6.1 Introduction . . . 97
6.2 Intelligent Synthetic Composite Indicators Framework . . . 99
6.3 Empirical Case Study . . . 100
6.3.1 Numerical Dataset Analysis . . . 100
6.3.1.1 Correlation . . . 101
6.3.1.2 Outlier Detection . . . 101
6.3.1.3 Multivariate Analysis . . . 102
6.3.1.4 Variables Standardisation . . . 103
6.3.2 Missing Data Imputation . . . 104
6.3.3 Missing Data Accuracy Comparative Results . . . 105
CONTENTS
6.3.4.1 FCM Weighting and Aggregation . . . 107
6.3.4.2 LBG VQ Weighting and Aggregation . . . 108
6.3.4.3 Statistical Weighting and Aggregation . . . 109
6.3.5 Validation and Robustness Analysis . . . 111
6.4 Generalising iSCI for Developing the UKCI . . . 116
6.4.1 Pre-Aggregation Tests and Analysis . . . 116
6.4.1.1 Correlation Analysis . . . 116
6.4.1.2 PCA Analysis . . . 117
6.4.1.3 Normalisation . . . 118
6.4.1.4 ANFIS Predictions and Validation . . . 118
6.4.1.5 Data Division for ANFIS Training and Testing . 120 6.4.1.6 ANFIS Predictions and Validation Results . . . . 123
6.4.2 UKCI Fuzzy Inference Aggregation Model . . . 126
6.5 Assessing the UKCI Applicability for the MENA Region . . . 129
6.5.1 The UKCI Drill Down Capability for Comprehensive Deci-sion Making . . . 132
6.6 UKCI Themes and Final Measurements . . . 134
6.7 Summary . . . 136
7 Forecasting Macro-Knowledge Competitiveness 137 7.1 Introduction . . . 137
7.2 Macro-Knowledge Competitiveness Forecasting Framework . . . . 138
7.2.0.1 Panel Data Analysis . . . 140
7.2.0.2 Fixed vs. Random Effects Models . . . 141
7.2.1 Artificial Neural Network Techniques . . . 142
7.2.1.1 ANN Training Techniques . . . 143
7.2.1.2 Data Division for Training and Testing . . . 144
7.2.2 KBE Forecasting Using ANN with Panel Data Structure . 145 7.3 Performance, Analysis and Results . . . 148
7.3.1 Accuracy and Performance Measures . . . 148
7.3.2 The Forecasting Performance Results . . . 148
7.3.3 The SOM Mapping Results . . . 152
CONTENTS
8 Conclusions and Future Works 157
8.1 Thesis Summary . . . 157
8.2 Concluding Remarks . . . 158
8.2.1 Intelligent Qualitative Taxonomy . . . 159
8.2.2 Intelligent Synthetic Composite Indicators (iSCI) . . . 159
8.2.3 Application of iSCI for Measuring Macro-Knowledge Com-petitiveness . . . 160
8.2.4 Macro-Knowledge Competitiveness Prediction and Fore-casting . . . 161 8.3 Future Works . . . 163 8.4 Problems Confronted . . . 164 Appendix A 165 Appendix B 167 References 177
List of Figures
4.1 Dynamic programming matrix to match two strings. . . 48
4.2 Schematic diagram of creating qualitative taxonomy for unified ICT index. . . 50
4.3 Top 10 matched words. . . 52
4.4 Top 20 matched words. . . 53
4.5 Word tree of the “technology” and its derivatives using fuzzy knowl-edge mining system. . . 54
4.6 UKCI units of development and overall topology. . . 58
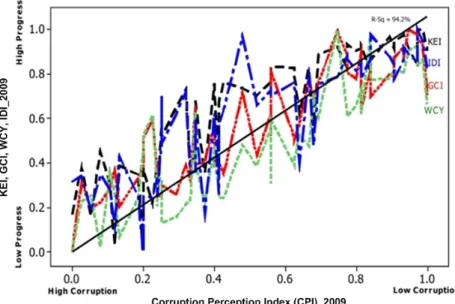
4.7 Corruption hinders knowledge progress, innovation and competi-tiveness. . . 62
4.8 UKCI concept mapping. . . 64
5.1 WCY scores from 2007-2010 for 50 random economies. . . 69
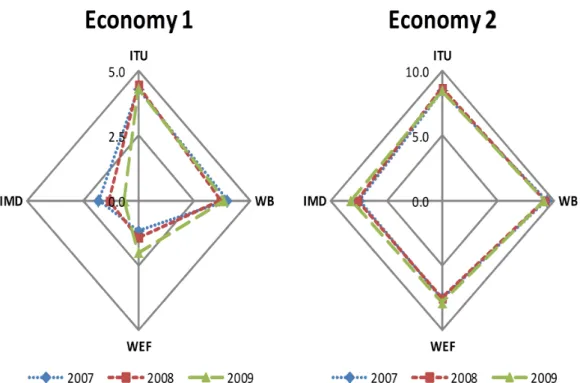
5.2 Two random economies on a radar visualisation from four selected indicators. . . 70
5.3 Illustration of the LBG LVQ clustering process. . . 82
5.4 Standard backpropagation ANN model. . . 90
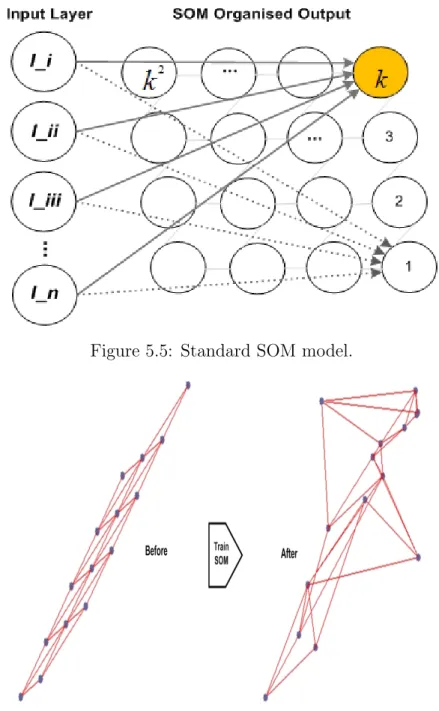
5.5 Standard SOM model. . . 91
5.6 SOM neuron weight positions of random data points before and after training for one-step ahead clustering map. . . 91
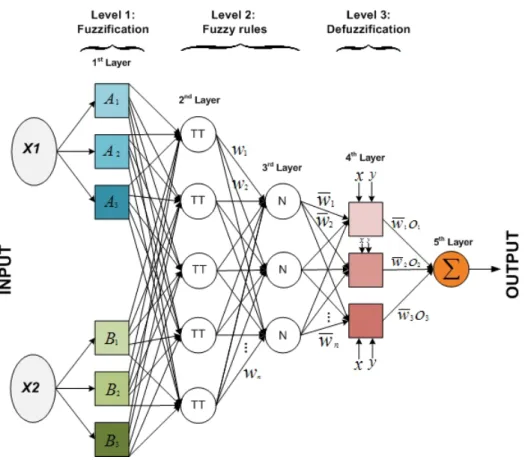
5.7 ANFIS structure with two inputs for one targeted output. . . 94
6.1 Schematic diagram of the proposed intelligent indicators develop-ment. . . 99
LIST OF FIGURES
6.3 PCA result showing the scree plot of eigenvalues of covariance for
57 countries. . . 103
6.4 Imputation methods MAE overall performance, 95% confidence interval. . . 106
6.5 Illustration of the fuzzy clusters for two selected economies. . . 108
6.6 Illustration of the FCM vs. LBG VQ final scores for two selected economies. . . 109
6.7 Illustration of the GME vs. FCM vs. LBG VQ final scores for two selected economies. . . 111
6.8 Monte Carlo results for FCM, GME and LBG VQ simulated models.113 6.9 Monte Carlo result of simulated vs. the real data models for FCM vs. GME and LBG VQ. . . 114
6.10 PCA eigenvalues and the number of principal components. . . 117
6.11 UKCI prediction model. . . 119
6.12 The inner-structure of IMD-WCY fuzzy sub-model. . . 121
6.13 Fuzzy rules to construct the predicted IMD-WCY scores. . . 122
6.14 Predicted vs. 2011 real scores. (a) WEF-GCI , (b) ITU-IDI, (c) WB-KEI. . . 124
6.15 Predicted vs. 2011 real scores. (a) INS-GII, (b) WEF-NRI, (c) IMD-WCY. . . 125
6.16 Schematic diagram of the UKCI fuzzy inference model. . . 126
6.17 FCM aggregation process of the five baskets scores to one explicit theme score - Spain vs. Sweden, year 2011-2012. . . 127
6.18 FCM aggregation process for UKCI tacit, explicit and final scores - Spain vs. Sweden, year 2011-2012. . . 128
6.19 UKCI baskets scores comparison, Jordan vs. Qatar vs. UAE, year 2011-2012. . . 132
6.20 Jordan detailed tacit and explicit profile, years 2009-2011. . . 134
7.1 Proposed KBE progress forecasting framework. . . 139
7.2 Diagram of data availability, inputs and division for ANN one-step ahead forecasting. . . 145
LIST OF FIGURES
7.4 SOM map before and after using PCA. . . 147 7.5 Predicted vs. real scores and one-step ahead forecasting based on
the proposed ANN II for ITU index. . . 150 7.6 Predicted vs. real scores and one-step ahead forecasting based on
the proposed ANN II for IMD, INS, WB and WEF indices. . . 151 7.7 SOM clustering map results form selected KBE indicators. . . 153 7.8 Visualisation techniques for one-step ahead forecasted and
List of Tables
4.1 Technology and ICT filtered variables. . . 55
4.2 The UKCI framework development units. . . 57
4.3 Extracted elements for macro-knowledge competitiveness. . . 63
5.1 Selected knowledge economy indicators. . . 68
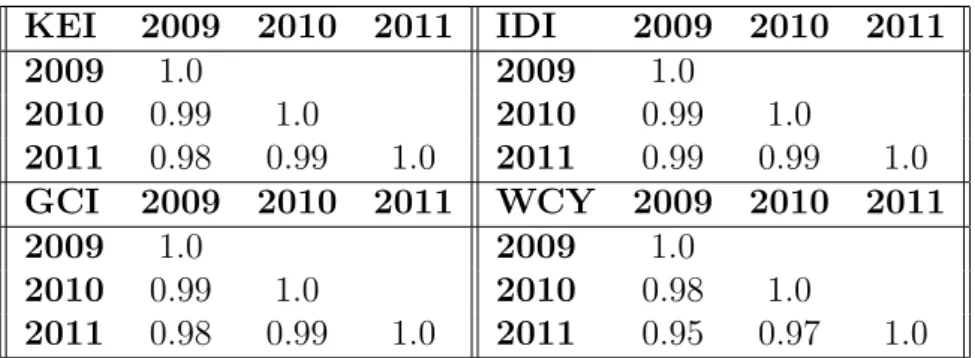
5.2 Individual indicator score correlation for three consecutive years 2009, 2010 and 2011. . . 69
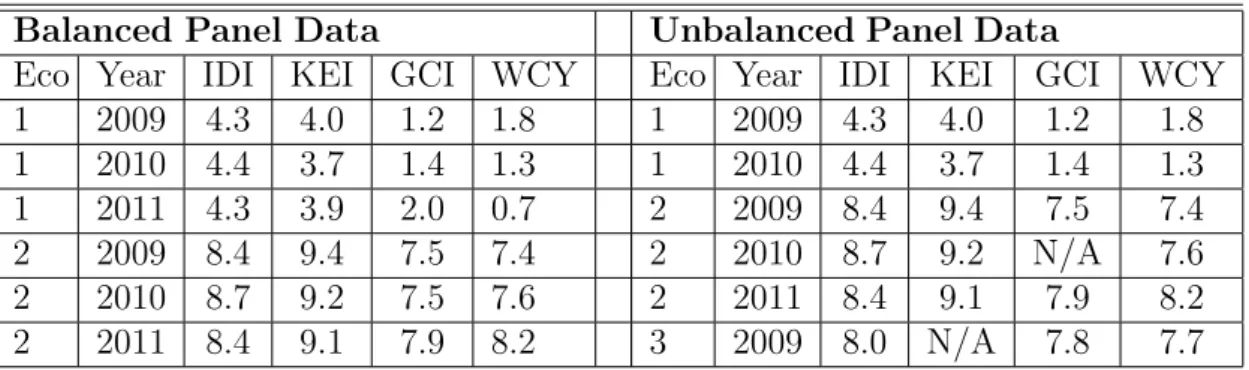
5.3 Sample data, illustrating balanced and unbalanced panel data set. 88 6.1 Correlation coefficient matrix for individual variables. . . 101
6.2 Mean absolute error of 10 trials for the tested imputation methods. 105 6.3 Index of agreement of 10 trials for the tested imputation methods. 105 6.4 Eigenvalues of ICT index dataset. . . 108
6.5 Variables weights extraction using PCA & FA rotated factor load-ings for ICT index. . . 109
6.6 Unified ICT index scores and ranks for 57 countries using GME vs. VQ vs. FCM, year 2011. . . 115
6.7 Correlation coefficient matrix final scores, year 2011. . . 117
6.8 Principal component analysis. . . 118
6.9 UKCI overall predicted errors. . . 123
6.10 MENA region normalised row variables, year 2011-2012. . . 130
6.11 MENA region imputed variables using FCM-OCS, year 2011-2012. 131 6.12 UKCI final scores - MENA region, years 2009, 2010 and 2011. . . 133
Nomenclature
7.1 Hausman test for IMD-WCY index: fixed vs. random effects. . . . 142 7.2 Forecast overall performance results for the selected KBE indicators.149 7.3 Labels, abbreviations and name of economies used in this study. . 152
1 Normalised raw data used to calculate the unified ICT index, year 2011. . . 168 2 UKCI final aggregated scores and ranks for 73 economies, year
2010-2011. . . 169 3 UKCI final aggregated scores and ranks for 73 economies, year
2009-2010. . . 170 4 Explicit Macro-Knowledge Competitiveness Indicator (EKCI) and
the theme detailed baskets scores, year 2011-2012. . . 171 5 Explicit Macro-Knowledge Competitiveness Indicator (EKCI) and
the theme detailed baskets scores, year 2010-2011. . . 172 6 Explicit Macro-Knowledge Competitiveness Indicator (EKCI) and
the theme detailed baskets scores, year 2009-2010. . . 173 7 Tacit Macro-Knowledge Competitiveness Indicator (TKCI) and
the theme detailed baskets scores, year 2011-2012. . . 174 8 Tacit Macro-Knowledge Competitiveness Indicator (TKCI) and
the theme detailed baskets scores, year 2010-2011. . . 175 9 Tacit Macro-Knowledge Competitiveness Indicator (TKCI) and
Nomenclature
Roman Symbols
AHP Analytic Hierarchy Processes
AM Arithmetic Mean
ANFIS Adaptive Neuro-Fuzzy Inference System
ANN Artificial Neural Networks
AP Accelerating Progress
AR Additive Rules
ARIMA AutoRegressive Integrated Moving Average
ARMA AutoRegressive Moving Average
ARMAX AutoRegressive Moving Average with exogenous inputs
BAP Budget Allocation Processes
BOD Benefits of the Doubt
CA Cluster Analysis
CI Computational Intelligence
COA Conjoint Analysis
Nomenclature ED Euclidean Distance EM Expectation Maximisation EW Equal Weighting FA Factorial Analysis FCM Fuzzy c-Means
FEM Fixed Effect Model
FIS Fuzzy Inference Systems
FPKM Fuzzy Proximity Knowledge Mining
GCI Global Competitiveness Index
GII Global Innovation Index
GM Geometric Mean
GMA Geometric Mean Aggregation
HDI Human Development Index
ICT Information Communication and Technology
IDI ICT Development Index
IEWB Index of Economic Well-Being
IMD International Institute for Management Development
INS INSEAD Business School
iSCI Intelligent Synthetic Composite Indicators
ITU International Telecommunication Union
KBE Knowledge-Based Economy
Nomenclature
KEI Knowledge Economy Index
KM Knowledge Management
KMS Knowledge Management System
KSOC Knowledge Societies
LA Linear Aggregation
LBG VQ Linde Buzo and Gray Vector Quantization
LMREG Linear Multiple Regression
LSDV Least Square with Dummy Variables
MCMC Markov Chain Monte Carlo
MENA Middle East and North Africa
MI Multiple Imputation MP Moving Progress MS Mean Substitution NF1 Na¨ıve Forecast 1 NN Nearest Neighbour NP Neutral Progress
NPS Nearest prototype Strategy
NRI Networked Readiness Index
OCS Optimal Completion Strategy
OECD Economic Co-operation and Development
PA Public Administration
Nomenclature
PDA Panel Data Analysis
PDS Partial Distance Strategy
REG Regression
REM Random Effect Model
SCI Synthetic Composite Indicators
SDI Sustainable Development Index
SFC Soft Focused Crawler
SVM Support Vector Machines
TSCS Time Series, Cross Sectional
UCM Unobserved Components Models
UKCI Unified Knowledge Competitiveness Indicator
UN United Nation
VAF Variance Accounted For
VCM Variance Components Model
VQ Vector Quantization
WB World Bank
WCY World Competitiveness Yearbook
WDS Whole Data Strategy
Chapter 1
Introduction
Knowledge and information are nowadays regarded as two of the key drivers of a nations progress and status, sometimes more so than wealth, land, capital or labour. Raw facts or ‘data’ can be considered as the basic building blocks which lead to the formation of information and development of knowledge. Informa-tion is data-in-context and it refers to the collecInforma-tion and manipulaInforma-tion of raw facts/data which is then organised in such a way that they have meaningful value beyond the facts. The functional relationships between data, information and knowledge are often interpreted as a pyramid comprising of three levels: data at the bottom, knowledge at the top with information as an intermediate stage. Tools and techniques are available to facilitate the progression from data (level 1) to Information (level 2). The progression from information (level 2) to knowl-edge (level 3) involves complex and indirect processes. For example, reading an article enables the reader to gather information about a chosen topic of interest, but developing knowledge from the gathered information is often a lengthy pro-cess requiring relevant experience, critical evaluation/reflective analysis and some prior knowledge. In some simple cases, it may be possible to develop knowledge directly from data without following the hierarchy.
In general, the main ingredients for creating new knowledge are data, informa-tion and time. It is equally important to appreciate that knowledge is required to make sense of data and information (i.e. to make them interpretable). A system-atic procedure for distinguishing, gathering, saving, and converting information into knowledge is known as a Knowledge Management System (KMS) .
1. Introduction
There are mixed definitions for knowledge, as it is viewed as an abstract concept and its potential can only be realised when it is used to some end. Ac-cording to Stair and Reynolds(2007) knowledge is a blend of experience, values, information-in-context, and insight, while Knowledge Management (KM) refers to the process of comprehending, comparing, judging, remembering, and reason-ing.
The application of the KM concept by nations has led to the development of Knowledge-Based Economies (KBEs). A KBE has two key strategies: first, it focuses on developing the means (hardware and software) to enable low-cost, high-speed electronic connectivity for data transfer; second, it aspires to produce a greater stock of highly skilled human capital to support and expand the pros-perity of a nation. Nations that claimed to have a KBE see themselves as learning societies pursuing a policy of continuous improvement in their knowledge assets (Bontis et al.,1999). Furthermore, utilising knowledge as the key driver for pros-perity and growth on a micro level leads to the creation of Knowledge Societies (KSOC), which relies on the production, distribution, and use of knowledge as the main driver of growth, wealth creation, and employment across all sectors (Quantumiii, 2011). This means that a nation must be in a constant process of change and adaptation to the new economic realities. In this new economy, it is evident that the key to success is ‘knowledge’. For governments they have to invest in, and develop knowledge workers, which also means that government bud-gets should assign capital for education, skills and expertise development. (Riley,
2003). More recently, the term Knowledge Economy (KE) has been used to in-dicate whether a nation has an ability to create and export “expert” knowledge, thus enabling it to be seen as economically innovative (Michael, 2010).
Knowledge-based economies use a number of measures to inform themselves of their achievements. To this end, a range of indicators have been developed by highly regarded and reputable organisations including the United Nation (UN), the World Bank (WB), the World Economic Forum (WEF), the International Institute for Management Development (IMD), INSEAD business school (INS), the International Telecommunication Union (ITU) and many more. These indica-tors have been used by organisations including government agencies, aid agencies and research institutions to assess the progress of a nation or nations in the
con-1. Introduction
text of KBE or KE. However, these indicators are non-uniform, subjective and yield different scores and ranking depending on the nature and type of assess-ments (Archibugi et al., 2009). Moreover, most of these indicators report past performance, and it does not predict where a certain KBE is heading giving all known elements. To minimise any potential confusion to decision makers, a new and intelligent methods for developing progress or sustainability indicators in demand. Such methods should have the capacity to aggregate and forecast multi-dimensional and non-linear vectors within a limited time frame. This will encourage a consistent application of judgement and evaluation of performance, when developing and assessing a nation’s KBE competitiveness using the pub-lished indicators.
1.1
Defining Terminology
When it comes to measuring the KBE, different indicators use different terms such as: progress, innovation, potential, advancement and development of a KBE; in an attempt to show the accuracy and distinct measurement. However, these words are multi-dimensional in nature, and they could be understood differently by different individuals which makes forming and using a unified and comprehen-sive meaning difficult. Nevertheless, looking up the definitions to these words will reveal that these words form an ontological relationship to each other. For exam-ple consider the definitions for the above mentioned terms as defined in Oxford Dictionary.
- advancement: a development or improvement,
- progress: a development towards an improved or more advanced condition,
- development: a specified state of growth or advancement, also it is defined as a new and advanced product or idea,
- innovation: making changes by introducing new ideas, or products,
- competitiveness: having a strong desire to be more successful than others, and
1. Introduction
- potential: having or showing the capacity to develop into something in the future, also abilities that may lead to future success.
By connecting the similar words, one can clearly find the mentioned ontologi-cal relationship which circles around the meaning of well-being, welfare, happiness and prosperity of a nation on a macro scale; and it is no surprise to find indicators named as well-being index such as the Index of Economic Well-Being (IEWB). (Osberg and Sharpe, 2002). Such indicators are designed to measure things like how the community is progressing on increasing the wealth of its citizens, cleaning the environment, fostering innovations, developing education, leisure and culture (Osberg and Sharpe,2005). The United Kingdom has introduced a new well-being index, to admit that GDP was an “imperfect way” of evaluating the country’s development and to devise ways of measuring well-being and innovations (Self et al., 2012). Hence, this research will use any of the above mentioned terms interchangeably to cover the more general concept of measuring the well-being and competitiveness of a KBE on a macro level.
1.2
Research Motivations
Lately, information and knowledge are substituting energy and funds as the main source for nations prosperity, exactly as the former two substituted labour and land about 220 years back. Furthermore, technological advancements in the 21st century have changed the rules of wealth creating labour from tangibly-centred to knowledge-centred, where information and knowledge are becoming the main ingredients of high production (Botha, 2007). Measuring the competitiveness of KBE has become an important issue in recent years both for the public and private sectors. This implies investigative and evaluation techniques into the ex-isting indicators used to measure the competitiveness of KBEs, which allow close attention to the underlying methods that constitute the making and formulation of Synthetic Composite Indicators (SCI). SCI are assessment tools, usually con-structed to evaluate and contrast country performance, by aggregating abstract issues in many areas such as the economy, education, technology and innovation. Nowadays many international organisations are focussing their attention on
1. Introduction
how to recognise, measure and promote developments in nations to improve the quality of lives, individually and collectively (OECD,2008b). In order to achieve this growing trend, many statistical based composite indicators are developed. These indicators are qualitative and quantitative measures derived from a series of observed facts that can reveal relative position of a nation in a given area of progress (Saltelli et al., 2012). However, these indicators suffer many shortcom-ings, as they generate different ranking and scores depending on the nature and type of assessments, even though most of these indicators use the same variables and statistical techniques. For example, the Information Communication and Technology (ICT) Development Index (IDI), developed by the ITU, would in-clude three variables (adult literacy rate, secondary enrolment ratio and tertiary enrolment ratio) to measure the level of ICT skills, these same variables would be used differently and under completely different pillar (category or basket) title by another index.
Due to the lack of availability of some information from a specific nation or during a specific period of time, there will be missing information. Another disagreement in ranking nations happens because of the different methods used to substitute missing values. For example, some organisations use the nearest neighbour imputation method, while others use mean or zero substitutions, and some use multiple imputation or expectation maximisation. Furthermore, the major problem is the difference in the methods used to weight and aggregate an index variables. These disagreements usually stem from the subjectivity or the opinions of the consulted “experts” who usually devise the methods to be used for building the framework, impute missing values, weight and aggregate the SCI variables. This and other controversies are also extensively explained by
Tarantola et al. (2006) and Trebilcock and Prado (2011).
The challenges for this research in accordance to the above environment is to: introduce and investigate the use of Computational Intelligence (CI) techniques to learn KBEs behaviour using limited data sets, devise suitable and non-biased weighting and aggregation methodology, investigate and choose proper method for missing data problem. All are potentially critical where statistical methods has failed to deliver, specially, for underdeveloped and developing economies.
1. Introduction
indices should represent and measure realistic events, and a set of synthetic ag-gregated indicators is not the reality, but it is basically an informative model of it (Saisana and Munda, 2008), therefore it is crucial to use a discipline that can construct better model of reality! One of the major insights of CI methods such as fuzzy logic is that many concepts are better defined by words than by mathematics, and fuzzy logic and its graded membership provide a discipline that can construct better model of reality (Cherchye and Kuosmanen, 2004). Hence, one of the main questions to be addressed in this thesis; is it possible to employ computational intelligence techniques to create a brand new unified and intelli-gent knowledge competitiveness framework? It is envisaged that the framework thus developed will contribute to the development of a computationally intelli-gent macro-knowledge framework and intelliintelli-gent SCIs suitable for countries with different cultural, socio-economic, and technical conditions. This is expected to assist such developing economies in establishing, measuring, monitoring and fore-casting suitable KBE.
In particular, this research study attempts to address the following:
- Why there are many different and separate views on KBE and competitive-ness?
- What are the implications of these differences?
- Can computational intelligence offer an alternative technique to the mea-surement and forecast of KBE progress and competitiveness?
- Is it possible to unify existing KBE measures in a universally acceptable manner?
- What are the implications of using such techniques?
To answer the above questions, the aims and objectives of this research need to be expanded.
1. Introduction
1.3
Aims and Objectives
The main argument and aim of this study is that given the different views about the nature of KE and competitiveness, the abundance of indicators and the con-fusion they create to the decision makers, a more intelligent, flexible and univer-sally acceptable measure of the constituent elements contributing to KBE com-petitiveness can be better selected, weighted, aggregated and forecasted through the adoption of computationally intelligent approaches. The present research therefore will employ and assess such approaches to discover the utilisation of Computational Intelligence (CI) methods for constructing Synthetic Composite Indicators (SCI). In particular for delivering an intelligent qualitative taxonomy as a theoretical framework for making a Unified Macro-Knowledge Competitive-ness Indicator (UKCI) to enable consistent and transparent assessments and fore-casting of the progress and competitiveness of KBE. In this thesis, the focus is on whether different CI methodologies to build SCIs, would lead to different results. The use of CI techniques to build the quantitative side of a new SCI includes the use of Fuzzy Proximity Knowledge Mining (FPKM) methodology for the pur-pose of devising a non-biased, novel and intelligent method to create a new SCI taxonomy. This research also aims to fill the gap where existing KE indicators have failed. A contemporary and unified macro-knowledge epistemology is pro-posed, where many new factors such as intellectual capital and competitiveness would constitute a major ingredient for a reliable KBE measurement. Such new view would give credit to the efforts made by emerging, competitive and vibrant nations, which existing KBE indicators discounts.
The proposed methods to construct the UKCI will be applied to fifty-seven countries initially, then expanded to include the MENA region countries as a special case study. In total seventy three countries will be included, that are rep-resentative of developed, developing and underdeveloped economies. The UKCI
will be evaluated on two levels: from a quantitative point of view and from real case study application in order to show the value added by the new development techniques and measure. The validity and robustness of all techniques are eval-uated using Monte Carlo simulation. Finally, the UKCI will be subjected to a number of uncertainty and sensitivity analyses. It is envisaged that the KMS
1. Introduction
thus developed is capable of evaluating, measuring, describing, forecasting and analysing the main issues that affect knowledge economies on a macro level.
To accomplish the aim of this research, the following objectives are identified:
- To develop understanding and to critically evaluate the current and existing position of the KBEs by studying the available measurements and tools of utilisation issued by the global indicators.
- To propose an alternative method to the measurement of KBE and com-petitiveness, to integrate the strengths and resolve the shortcomings of the assessed techniques.
- To coin a novel CI technique as a a non-biased way to create the qualitative taxonomy of future SCIs. Fuzzy Proximity Knowledge Mining (FPKM) technique is proposed for this purpose. The suggested FPKM consists of two major steps: Focused web mining using Soft Focused Crawler (SFC), and fuzzy text matching using Wagner-Fischer dynamic programming al-gorithm for computing the Levenshtein or ‘edit distance’. The suggested taxonomy will serve as a non-biased, novel and intelligent method for inclu-sion/exclusion and unifications of empirical variables to establish significant, consistent and sound SCI theoretical framework.
- To establish an intelligent and universally acceptable KBE measurement indicator; a number of analysis methods will be used including Principal Component Analysis (PCA), Factor Analysis (FA), Geometric Mean Ag-gregation and CI techniques such as, Fuzzy c-Means (FCM) and Vector Quantization (VQ). These methods will be contrasted and compared to introduce a valuable tool for weighting and aggregating the quantitative elements of future SCIs, and it would change the norm when ranking and classifying nations.
- To compare and contrast the performance of different missing data impu-tation methods including two special FCM techniques that is, the Opti-mal Completion Strategy (OCS), the Nearest Prototype Strategy (NPS). The results are compared against statistical imputation techniques namely;
1. Introduction
the Expectation Maximisation (EM), Multiple Imputation (MI), Nearest Neighbour (NN) and Multiple Regression (MR).
- To investigate the performance of different prediction and forecasting meth-ods to assess the most appropriate technique for forecasting KBE compet-itiveness performance given the limited data sets available. Time Series, Cross Sectional (TSCS) Panel Data, ANN and SOM will be investigated to create a Unified Knowledge Economy Forecast Map (UKFM).
- To introduce a novel macro knowledge capacity building and competitive-ness framework by constructing an Intelligent Syntactic Composite Indica-tors (iSCI) for any nation to share their knowledge, monitor their progress, track their KBE competitiveness to improve their overall welfare.
- To simplify and calibrate the final developed model, a robustness analysis will be performed using Monte Carlo simulation, as an appropriate and justifiable model robustness technique.
- To validate the effectiveness of the introducediSCI and UKCI frameworks and to evaluate its strengths and weaknesses. Economies in the Middle East and North Africa (MENA) region are used as case study.
In attaining the above goals the current research study makes a contribu-tion to producing a novel and intelligent indicator, would be suitable for any country with different cultural, socio-economic and technical conditions. It is envisaged to assist such economies in establishing and monitoring a suitable and competitive knowledge based economy. This research uses real data sets to illus-trate constructing the major components of the proposed index, which includes the qualitative taxonomy, missing values imputations, the weighting, aggregation and forecasting of the suggested UKCI variables.
1.4
Research Novelty and Contributions
This work examined many CI techniques before it delivered an innovative decision making tool branded as the Intelligent Synthetic Composite Indicators (iSCI). An
1. Introduction
application of the iSCI was put-forward to develop a Unified Macro-Knowledge Competitiveness Indicator(UKCI). TheUKCI consists of 80 structural and qual-itative variables that benchmark how a KBE compares with other countries. The qualitative taxonomy of the UKCI was developed using a novel approach coined as Fuzzy Proximity Knowledge Mining (FPKM). The ranking is undertaken for a group of 73 countries that include almost all of developed economies and the MENA region countries. Furthermore, this work used advance econometrics anal-ysis with CI techniques to create a Unified Knowledge Economy Forecast Map
(UKFM). Hence, the main contributions of this thesis are:
- Identification and analysis of the KBE competitiveness on a macro-level.
- Introduced and coined the concept of Fuzzy Proximity Knowledge Mining (FPKM) process to establish an intelligent qualitative taxonomy to build future SCI.
- Introduction of the novel Intelligent Synthetic Composite Indicators(iSCI), with a real case study and validation.
- Using the(iSCI)concept, unified several complex, multi-dimensional macro-knowledge indices, into a data-driven, and unbiased KBE indicator, hence the (UKCI)
- Investigate and determine frequent and abnormal KBE behaviours. The approach is based on visualising and clustering data sets in a format suitable for classifying and identifying abnormalities.
- Examine different forecasting models to forecast future KBE competitive-ness based on Panel Data: Time Series Cross Sectional (TSCS), Multiple Regression, Feed forward ANN model and SOM techniques to produce the
(UKFM), This map can be used to visualise, identify or evaluate stable, progressing or accelerating KBEs.
Overall, the results obtained in this thesis, suggest novel, unbiased and intelligent methods which can be instantly utilised to build future SCIs in many other fields.
1. Introduction
1.5
Thesis Outline
This thesis consists of eight chapters that are organised as follows: In Chapter 2, a review of the existing attempts and research studies on the tools and methods used to evaluate, monitor and forecast progress and competitiveness is given. The review presents the existing studies on the importance and difficulties of evaluat-ing KBE competitiveness, representation, recognition, and the techniques used. In addition, the major techniques used to develop progress measures including statistical, computational intelligence and hybrid methods are detailed.
Chapter 3 tracks, examines and reasons the theories of knowledge, macro-knowledge and competitiveness. The focus is on the types of macro-knowledge that is shared between individuals in a certain society and the “tacit” versus “explicit” macro-knowledge, from a theoretical and practical perspective, to establish a working relationship between these important concepts. This reasoning is to serve as a laying foundation to why and how the interest for a unified measure for macro-knowledge competitiveness started to surface as an essential measure for growth and progress.
The approach taking to construct the qualitative taxonomy or the theoretical framework is explained in Chapter 4. This chapter introduces the utilisations of fuzzy proximity knowledge mining, to build the SCI initially to establish sig-nificant, consistent and sound indicator. The suggested taxonomy will serve as a basis of mining the net for selecting, inclusion/exclusion and unifications of qualitative variables from various knowledge competitiveness sources.
In Chapter5the data selection, acquisitions process, the details of its descrip-tions and analysis for the study are explained; followed by an overview of some existing techniques which are used in data treatments, weighting aggregations and predictions. The chapter begins by presenting the traditional techniques such as PCA, Panel Data predictor. Then, different CI methods such as FCM, VQ and ANN techniques used in this thesis are put forward with discussions of their benefits of use in missing data imputations, weighting, aggregations and forecasting.
In Chapter6covers the main contributions of this thesis where the methods of aggregations are identified and results are presented for three different weighting
1. Introduction
and aggregation models. The chapter starts with an overview of simple rule based systems using adaptive neuro-fuzzy systems (ANFIS), followed by the approach taken to produce an iSCI to identify the centroid of homogeneously clustered nations using FCM. This chapter closes by comparing and validating the robust-ness of the proposed framework against two statistical models as a case study. The chapter concludes that the proposed framework and the empirical case study for developing future composite indicators was successfully constructed using CI methods to combine the efforts of non-linear, multi-dimensional variables, into a new UKCI.
In Chapter7the results of the predictive and forecasting models are presented and validated using visual heat maps and radar charts. A comparison and ac-curacy results between four prediction models are made to find the best model to predict the future progress of any KBE regardless of limited or missing data points. This chapter closes by presenting a Unified Knowledge Economy Forecast-ing Map (UKFM), usForecast-ing SOM. The proposed forecastForecast-ing model has the capability of aggregating major KBE indicators into a unified meaningful map that places any KBE in its league. The UKFM reflects the overall position of homogeneous knowledge economies, and it can be used to visualise, identify or evaluate stable, progressing or accelerating KBEs. Finally, the conclusions arise from this thesis and the formulates of some future research directions are presented in Chapter8.
Chapter 2
Literature Review
2.1
Introduction
This chapter reviews existing attempts and research studies on the tools and methods used to evaluate, monitor and forecast progress and competitiveness. The review presents the existing studies on the importance and difficulties of evaluating KBE competitiveness, representation, recognition, and the techniques used. In addition, the rise and use of SCI for the purpose of measuring progress in nations are reviewed. This chapter is structured as follows; in Section 2.2, the different efforts and the difficulties and faults encountered in such attempts are reviewed. Some literature on indicators classifications, representation, and the levels of groupings with emphasis on the SCI are reviewed in Sections 2.3. In Section 2.4 and Section 2.5 the major Statistical and CI techniques used to develop progress measures are highlighted respectively. The different attempts and methods used to predict and forecast within this domain using both statistical and CI techniques are discussed in Section 2.6. A Summary of this chapter is presented in Section 2.7.
2.2
Evaluating Knowledge Based Economy
Monitoring and evaluating the overall performance for KBE has become very im-portant, since it promotes strategic development and progress. However, many
2. Literature Review
pressing questions arise in light of this. For example, how a nation is doing in its endeavour to become a knowledge economy? How can a nation realise its potentials and capitalise on it? How can nations formulate a decisive plan and tools to establish, evaluate, forecast, monitor and expand its knowledge compet-itiveness horizons? What are the advantages a nation can gain by monitoring its KBE competitiveness? The answers to the above mentioned, and more similar questions is very important, yet it is not easy to do; as a matter of fact, finding the answers to these questions is the main business or concerns for many leading organisations. The Economic Co-operation and Development (OECD) core prac-tice and mission is to analyse the KBE indicators to understand the dynamics of the KBE and its relationship to traditional economics (Foray and Lundvall,
1996). According to the UN (2010) “there is still currently no internationally agreed on framework for measuring the extent to which an economy or society is a knowledge based”. Hence, a framework to bring together the existing mod-els and a research leading and contributing to the debate on this topic is highly needed.
2.3
The Rise of Synthetic Composite Indicators
Indicators are progress measurement tools, usually made to provide a more pre-cise and consistent signal of change for a certain domain than the use of raw data on their own, by summarising information about such domain or subject of interest using statistical measure, e.g. one can measure the level of education or inflation (Statistics.gov.uk, 2010). In general, indicators are classified into two main categories: Individual “simple” and aggregate “synthetic composite” or 2nd generation indicators (Saltelli et al., 2012; Urra, 2007; Arndt and Oman, 2006;
M. Saisana and Tarantola, 2005). Synthetic Composite Indicators are assess-ment tools, usually constructed to evaluate and contrast country performance, by aggregating abstract issues in many areas such as the economy, education, technology and innovation (OECD, 2008b). SCI are developed by using qualita-tive (qualitaqualita-tive synthetic indicators) or quantitaqualita-tive (actual synthetic indexes) methods. SCI may help detect related essential facts, which may not be mea-sured by the basic grouping of simple indices since this combination does not
2. Literature Review
incorporate the inner arrangement of the structure, nor it does clarify how sim-ple indicators relate to one another (Cumbrera et al., 2008). Furthermore, the European Commission Joint Research Centre (Centre,2012), has put three levels of indicator groupings as follows: Individual, thematic and composite indicators. Individual indicators represent a menu of separate indicators or statistics. This can be seen as a first step in stockpiling existing quantitative information. The thematic indicators are individual indicators grouped together around a specific area or theme. They are generally presented individually rather than synthesised in a composite. While the composite indicators are formed when thematic indi-cators are compiled into a synthetic index and presented as a single composite measure (Saltelli et al., 2012).
2.4
SCI Developments Methods
In general the concept of SCI can be viewed as a paradigm of reducing multi-dimensional and non-linear inputs (variables) into a single and meaningful output that can be interpreted by public officials, business leaders, decision makers and ordinary citizens. Even though the issue seems simple, however,“the methods for aggregating vast amounts of empirical data remain rather crude” (Cherchye and Kuosmanen,2004). This aggregated output (hence, the final SCI value) is usually represented and communicated as a single numerical score and/or an ordinal rank. To arrive to this final output value, the index must go through rigorous and monotonous development steps, such as what variables to include/exclude, what to substitute for missing data, how much weight to give to each variable etc. In general, the domain that covers the overall process of understanding the information implied in the variables to measure progress or competitiveness between countries for example, can be investigated along two parallel paths: first, by jointly studying the constituent elements which makes a SCI. Second, by studying the countries in terms of similarity between different elements. (Nardo et al., 2005).
- The Constituent Elements Similarity Process: This track usually involves a couple of steps which starts with making sure that the available
2. Literature Review
variables are adequate, enough and well defined to depict and explain the nested composition of the composite indicator appropriate to describe and develop a new index to measure the progress in a certain domain. This is usually accomplished based on “expert opinions” or based on studying the arithmetic structure of the available dataset. Classically, PCA, FA or Cronbach Coefficient Alpha can be used for that purpose.
- The Distance Measure or Countries Clustering Process: This track involves clustering countries in terms of similarity between different ele-ments using different clustering techniques. The clustering is usually based on distance measures such as Euclidean, Squared Euclidean or City Block etc. These measures and its detailed rules and methods will be discussed later in Section 5.4.4.
Along these two parallel tracks come the details of the different methods and techniques that can be used to construct a SCI to measure the progress or competitiveness in a certain domain. With the details comes the subjectivity, disagreements and biases of which method and why. Most of the research which has been carried out to deal with constructing SCI is done using statistical or knowledge rule based techniques. Statistical techniques are used to find the de-pendence and correlations between the variables collected to measure a level of progress, to treat missing values, detect outliers and ultimately to weight and ag-gregate the composite index. Another common approach for combining multiple attributes is through the use of a set of knowledge rules like IF-THEN to reflect the experts judgement on the input values and a panel of “experts” would set the weight to be assigned to each input. Even though this method was helpful in predicting an output in a small scale, it however offers very little help when the number of inputs goes beyond the human ability to generate so many rules or to reduce the rules to give the best answer; so it is to a certain extent become impractical and a matter of a personal judgement or a best guess intuition.
2.4.1
Multivariate Analysis
Niwa and Tomizawa (1996) constructed the General Indicator of Science and Technology (S&T). Multivariate analysis techniques such as PCA and FA was
2. Literature Review
applied to a set of fourteen related indicators to investigate its structure and extract a single or a small number of indicators. The authors claimed that us-ing multivariate analysis was advantageous for examinus-ing and interpretus-ing the characteristics of indicators, and for producing the desired S&T composite index. The mentioned analysis was performed for 5 economies only, the U.S., Japan, Germany, France and the U.K. which is very limited and can’t be generalized to extract the needed facts regarding the features of S&T action globally or for the world countries comparisons. Dyba (2000) used FA and Cronbach Coeffi-cient Alpha subsequently, to analyse and produce a measurement tool for the key elements of success in improvement of software process. The measures were found to have satisfactory testing properties. However, a recent study by Grupp and Schubert (2010) negated these findings and claimed that using multivariate analysis for exploratory and weighting purposes may lead to drastically differing ranking results when compared with other methods. Some other disadvantages are that multivariate analysis are sensitive to presence of outliers, small-sample and data modifications such as revisions and updates. Despite these disadvan-tages, multivariate analysis still used to develop many indices, for instance the ICT Development Index (IDI) created by ITU uses PCA to set the weight for the indicators and sub-indices included in the IDI (ITU,2012). Furthermore, a collab-orative work between, Yale University Centre for Environmental Law and Policy, and the Centre for Earth Information Science Information Network, at Columbia University has produced in year 2000 the first environmental performance com-posite index called the Environmental Sustainability Index (ESI), which was later replaced by the Environmental Performance Index (EPI) and ‘Trend EPI’. Both EPI and ‘Trend EPI’ are using PCA and FA beside other methods to conduct the exploratory analysis and to help in setting the weighting for these indices (Yale,
2012).
2.4.2
Statistical Weighting Techniques
Use of weighting methods is crucial for developing composite indicators, as proper variable weightings gives a better illustrative of the outcomes ranks or scores. However, debate continues about the best strategies for weighting variables. The
2. Literature Review
following is a critical review of the most widely used statistical weighting tech-niques:
2.4.2.1 Equal Weighting
Many composite indicators depend on Equal Weighting (EW) or “variance-equal weighting,” where all variables are giving equal weight. Babbie (1995) supports such practise and recommend it to become the standard for setting the weights when constructing CSIs. Also Hopkins (1991) tout EW for its simplistic ap-proach and he justify that in accordance with the Occam’s razor principle of ‘simple is best’. However, in a detailed article Cherchye et al.(2007a) raise many flags against such practise and they argue that, just because we can’t obtain agreement on weights, does not constitute using “fundamentally flawed” method. They also argue that EW is out of the core debate in SCIs development and they show how EW interferes with the basics of normalization process. EW allows for perfect exchange among variables, thus disregards the balancing nature of other variables (Cerulli and Filippetti, 2012). For example the Human Devel-opment Index (HDI) (Bhanojirao, 1991), and the Innovation Union Scoreboard (IUS) (EuropeanCommission, 2011) are using the equal weighting to arrive to the aggregated HDI and IUS scores. This technique basically denotes that all variables are contributing equally in the aggregation, which could mask the lack of an arithmetic or a practical foundation, e.g. when there is inadequate informa-tion of the underlying relainforma-tionships or absence of agreement on the substituinforma-tion. However, equal weighting does not imply ‘no weights’, but indirectly indicates that the variables influences are equal, hence the importance of the underlying variables are the same. This could result in an unbalanced structure in the com-posite index (OECD, 2008a; Grupp and Schubert, 2010). EW has been widely criticized by many more includingPanigrahi and Sivramkrishna(2002);Cherchye et al. (2004,2007b);Hatefi and Torabi (2010);Belhadj(2012). In conclusion and at most, EW offers the easiest solution, but definitely not the best.
2. Literature Review
2.4.2.2 Data Envelopment Analysis and Benefit of the Doubt
Data Envelopment Analysis (DEA) uses linear programming to spot the leaders from a set of countries to be used as a benchmark to measure the progress for the rest of countries in a dataset. A few attempts by Cherchye and Kuosma-nen (2004);Archibugi et al. (2009) were steered towards that direction using the statistical benchmarking or “benefit-of-the-doubt” weighting technique which is an application of DEA. The benchmarking technique was also used by Mahlberg and Obersteiner (2001) as an alternative method to remeasure the HDI and the Sustainable Development Index (SDI) which was used by Cherchye and Kuosma-nen (2004) to identify the benchmark countries. The DEA weighting technique suffers from ‘an over performance’ problem, because it groups the economy to be predicted with highest neighbour and hence giving it a high weight and or what they call the benefit-of-the-doubt weighting, which eventually gives the selected economy a high score and hence a false ‘shiny progress picture’. Other disadvan-tages of the benchmarking technique is that this method is sensitive to the type of normalizations technique and it depends on the benchmark; if any of these changes, the scores are likely to give different weighting, hence, different country ranking (Nardo et al., 2005).
2.4.2.3 Regression Based Weighting
Porter and Stern (1999) collected and used survey data to measure national in-novative capacity. They computed each executive opinion survey as the aver-age reply by respondents for each economy and they used Analysis Of Variance (ANOVA) to assess the dependability of the approach for each survey measure. Regression was used to regress each survey replies on a full set of economy dummy variables, computing the portion of difference between responses that concluded from regular economy-level dissimilarities. This procedure, although appropriate for a large set of variables of diverse natures, assumes that the behaviour is linear and requires focus on the individuality of the independent variables.
2. Literature Review
2.4.2.4 Unobserved Components Model
The Unobserved Components Models (UCM), is similar to the familiar regression analysis, however, the major dissimilarity is in the response variable, which is anonymous in UCM. Weights with UCM are assigned by assessing the maximum likelihood function of the base indices. The UCM suffers from poor dependability and robustness of results which depends on the disposal of large dataset or long time horizons. It works well with independent sub-indicators, but poor with highly correlated sub-indicators (Nardo et al., 2005).
2.4.3
Participatory Weighting Techniques
In addition to the purely statistical methods mentioned in the previous sections, alternatively, there are participatory methods which considers experts, politicians or citizens opinions to assign weights. This approach is very subjective and depends on the people’s beliefs and opinions of how to assign the weights. Below is a brief review of the most famous methods of the participatory weighting techniques:
2.4.3.1 Budget Allocation Process
Also known as Experts Allocation Process (EAP) where experts on a given do-main of expertise (e.g. economy, education, corruptions, etc.) are joined together and given a pool of one hundred points or what is known as a “budget” and they are asked to allocate it to the indicator set. This method relies on the experience and subjective judgement of the relative importance of the respective indicators. Weights are calculated as average budgets. BAP is good if the number of indi-cators is between 10-12. However, if there is many indiindi-cators to consider, then this method can cause mental strain to the people who are expected to assign the weights. The Index of Economic Well-Being (Osberg and Sharpe,2002) used to employ “Expert weighting” BAP, but it has been replaced by equal weighting because of criticisms regarding the weights decided (Sharpe and Andrews,2012).
2. Literature Review
2.4.3.2 Public Opinion
Practically, opinion polls concentrate on the idea of ”concern” where individuals are requested to state their grade of worry (e.g. small or big) about certain issues. As with expert evaluations, the budget allocation process may well also be utilised in public opinion polls. But it is more challenging to request the public to assign a hundred marks to numerous individual indicators to state a grade of worry concerning a certain problem (Mitchell et al., 1995). A study by Mitchell et al. (1995) used the opinion of seventeen industrialized countries citizens to challenge the World Health Organization (WHO) ranking of 191 countries health systems which was based on the advice of health experts. The study concluded that there is insignificant association between WHO scores and the well-being of the citizens who use these health organisations.
2.4.3.3 Conjoint Analysis
This is a segmentation multivariate data analysis technique grounded on scenar-ios. A scenario could be a certain set of scores for individual variables. The first choice is then segmented marked and assigned to the assessment. Even though this practice employ statistical analysis to handle the data, it depends on the opinion of consulted citizens, politicians or experts. Each of these individuals is given a different group of variables to evaluate and then to choose their favourites. (Saltelli et al.,2012).
2.4.3.4 Analytic Hierarchy Process
This is a technique used for multi-attribute decision making, and to establish measures for qualitative and quantitative features of a problem which are in-tegrated into the assessment practice. AHP facilitates the decomposition of a problem into a hierarchical structure. Weights are assigned by the importance of a certain domain. Hence, it represent the trade-off across indicators, where an expert may show willingness to forego a given variable in exchange for another because they are not important coefficients. This method rely on people’s beliefs; however, beliefs are not always consistent. AHP is based on a redundant process, so it is computationally costly, in addition, redundancy allows for a judgement
2. Literature Review
errors, and an inconsistency ratio (OECD, 2008a). Despite these disadvantages, AHP is still popular, and it has been used by British Airways to choose the en-tertainment system vendor for its entire fleet of air planes. Also, the Nuclear Regulatory Commission (NRC) of the US used it to allocate a large budget for their computing requirements and information technology projects (Saaty,2008).
2.4.4
Statistical Aggregation Techniques
The literature of SCI’s offers many examples of aggregation techniques. How-ever, one of two major aggregation techniques is usually used: additive (linear) or multiplicative (geometric or non-linear) techniques. The additive aggregation is basically summing up all weighted indicators and sub-indicator to produce a comparison score or ranks between nations. On the other hand multiplicative aggregation is the product raised to the power of the weighted indicators or sub-indicators. Additive aggregation offer full compensability between aggregated indicators, where poor performance indicators can be covered or “compensated for” by the other indicators which have significantly higher value. Such trade-off could thus result in a biased composite indicator. On the other hand, multiplica-tive aggregation such as the Weighted Geometric Mean (WGM) is less compen-satory and touted as superior to the additive method. However, this technique could inflate the overall scores of a SCI, despite a slight improvement in its vari-ables (Munda and Nardo, 2005). The additive methods especially the weighted sum aggregation are usually the preferred choice for transparency, simplicity and ease of interpretations and use even by novices. However, detailed examination of additive and multiplicative methods by Ebert and Welsch (2004) and Zhou et al.(2006) showed that the WGM method often has better properties than the weighted sum method. The Innovation Union Scoreboard (EuropeanCommission,
2011) was aggregated using the WGM.
Another multiplicative aggregation method proposed by Munda and Nardo
(2009) is known as Non-compensatory Multi-Criteria Approach (NCMCA) which is trying to make a balance between the cases for a certain objective, e.g. moni-toring the level of smog and pollution and at the same time increase the economic well-being of a certain entity. Even though this approach is more advanced,
how-2. Literature Review
ever, it is commonly more complicated to compute and the interpretation of the results is less intuitive (Nussbaumer et al., 2012).
2.5
Computational Intelligence Techniques
As an alternate to the statistical techniques, Computational Intelligence (CI) methods are becoming the trend for their precision in predictions, clustering, modelling and trend analysis; some methods are more popular than others and the proceeding sections presents a review of such used methods.
2.5.1
Artificial Neural Networks
Artificial Neural Networks (ANN) are now considered to be the most popular methods to deal with non-linear and ambiguous cases. For example a recent study byAmin et al.(2009) showed that ANN can act as an aggregator to multi inputs to form a single output. The author applied two ensemble methods; the negative correlation learning and bootstrap aggregating (bagging). Experimental results on a number of real-world benchmark problems showed a substantial performance improvement over other aggregator types. The authors in (Wilson et al., 2002) presented an ANN model, trained using the UK Nationwide House Price Index data to model the projected movements in property prices and to forecast future trends within the housing market. It has been shown that ANN can model any functional linear and non-linear relationship, and that such models are better than regression since regression is essentially a linear technique used to solve non-linear problems. A small scale study by (Sarlin, 2010) used Self Organising Map (SOM) to predict and monitor the financial stability, and sovereign debt for nations. It was concluded that SOM is considered to be a feasible tool for aggregating multiple related variables to visualize and monitor the evolution of economic conditions over time.
2.5.2
Fuzzy Logic
Two related studies carried out by Ammar et al. (2004); Shnaider and Haruvy