1
3
Quantitative analysis of the security performance
4
in wireless LANs
5
Poonam Jindal
*, Brahmjit Singh
6 National Institute of Technology, Faculty of Electronics and Communication Engineering Department, Deemed
7 University, Kurukshetra 136118, India
8 Received 2 August 2014; revised 3 November 2014; accepted 9 December 2014 9 11 KEYWORDS 12 13 Frame loss; 14 Roaming network; 15 Security protocols; 16 Security strength; 17 Throughput; 18 TCP; 19 UDP
Abstract A comprehensive experimental study to analyze the security performance of a WLAN based on IEEE 802.11 b/g/n standards in various network scenarios is presented in this paper. By setting-up an experimental testbed we have measured results for a layered security model in terms of throughput, response time, encryption overheads, frame loss and jitter. Through numerical results obtained from the testbed, we have presented quantitative as well as realistic findings for both security mechanisms and network performance. It establishes the fact that there is always a tradeoff between the security strength and the associated network performance. It is observed that the non-roaming network always performs better than the roaming network under all network sce-narios. To analyze the benefits offered by a particular security protocol a relative security strength index model is demonstrated. Further we have presented the statistical analysis of our experimental data. We found that different security protocols have different robustness against mobility. By choosing the robust security protocol, network performance can be improved. The presented anal-ysis is significant and useful with reference to the assessment of the suitability of security protocols for given real time application.
Ó2015 Production and hosting by Elsevier B.V. on behalf of King Saud University. This is an open access article under the CC BY-NC-ND license (http://creativecommons.org/licenses/by-nc-nd/4.0/).
20
21 1. Introduction
22 There has been tremendous growth of wireless communication 23 services over the last decade due to their ease of accessibility,
24 mobility and flexibility. Due to the release of the restrictions
25 of physical boundaries, Wireless Local Area Networks
26 (WLANs) have been extensively deployed worldwide (Ergen,
27 2002). The universality of these networks ranges from homes,
28 business, online banking, social networking, cafes, military,
29 and research sectors to many more. Due to open access of
30 the shared wireless medium, existing studies reveal that
31 WLANs are susceptible to several attacks such as sniffing,
32 spoofing, eavesdropping, denial of service and man in the
mid-33 dle attack; hence provisioning of the security in these networks
34 is a major research challenge (Sheldon et al., 2012). Such
secu-35 rity issues raise the need of applying strong security
mecha-36 nisms to protect the information over the network.
* Corresponding author.
E-mail addresses: [email protected], poonamjindal81 @nitkkr.ac.in(P. Jindal),[email protected](B. Singh). Peer review under responsibility of King Saud University.
Production and hosting by Elsevier
King Saud University
Journal of King Saud University –
Computer and Information Sciences
www.ksu.edu.sa www.sciencedirect.com
37 Consequently, several security protocols and mechanisms are 38 being developed to enhance the security in WLANs (Feng, 39 2012).
40 However, cryptographic primitives involved in security pro-41 tocols increase the computational overheads. These are associ-42 ated with control messages in authentication mechanisms and 43 also the authentication delay incurred in the verification of cre-44 dentials. Therefore the implementation of security protocols 45 induce additional cryptographic overheads and further the 46 cumulative effect of the cryptographic overheads with basic 47 impairments of wireless network results in a severe obstruction 48 in attaining adequate quality of service (QoS) (Potlapally et al., 49 2006; Jindal and Singh, 2013). Although it is certain that secu-50 rity mechanisms affect the performance of the network in 51 terms of the resultant throughput, packet loss, response time, 52 jitter, encryption cost, and authentication time (Baghaei 53 et al., 2004; Turab and Moldoveanu, 2008; Boulmalf et al., 54 2007). Investigations have not been reported anywhere in 55 much detail as to what extent network performance is affected 56 by security protocols in both roaming and non-roaming sce-57 narios with different applications. Therefore, it is imperative 58 to analyze quantitatively the impact of security protocols on 59 the performance of networks and to study how the QoS 60 degrades in real time networks with the application of security 61 protocols. As security is a constituent of wireless LAN, good 62 comprehension of its implications on WLAN performance is 63 necessary.
64 To achieve a secure wireless communication different secu-65 rity protocols are developed at different network layers. WEP 66 (Wired Equivalent Privacy), WPA (Wi-Fi Protected Access) 67 and WPA2 at MAC layer, IPsec (IP security), SSL (Secure 68 Socket Layer), and RADIUS (Remote access Dial in User Ser-69 vice) exist at the network layer, transport layer and application 70 layer respectively and are the various security protocols to pre-71 vent the network from malicious attacks (Vibhuti, 2008; 72 Lashkari et al., 2009). Most of the previous research has con-73 centrated on the enhancement of cryptographic mechanisms in 74 security protocols, though they are not quantifying the associ-75 ated performance degradation due to security protocols in 76 much detail (Peteriya, 2012; Mitchell, 2005). In this paper we 77 have focused on real time quantitative analysis of security pro-78 tocols and their performance impact in terms of throughput, 79 response time, encryption overheads, frame loss, and jitter in 80 a variety of network scenarios for IEEE 802.11b/g/n 81 standards.
82 To achieve the above goal we have developed a real time 83 experimental testbed and performed the comprehensive exper-84 imental analysis to investigate the performance impact of nine 85 different security protocols including the enterprise security 86 layers. The used testbed is a miniature of existing wireless net-87 works and ensures the consistency of our experimental scenar-88 ios with typical deployment of WLANs. We are using the 89 experimental testbed because testbed results not only give nat-90 uralistic results, but also explore various issues such as com-91 munication in roaming environment and processing delays in 92 wireless devices that cannot be flawlessly formed in simulation 93 and analytical models. In this work, we report on the compar-94 ative analysis of the performance impact of different security 95 protocols (SSID, WEP/64/128, WPA/AES, WPA2/AES, and 96 WPA2/AES/TKIP at MAC layer) including security layers 97 with RADIUS server (WPA/AES, WPA2/AES, and WPA2/
98 AES/TKIP at application layer). We have used our testbed
99 with mobile IP for roaming network. We have made this
100 testbed a heterogeneous network with the help of various
hard-101 ware and mobile devices. Comprehensive experimental
analy-102 sis is carried out in this paper to investigate the performance
103 impact of nine different security policies including the
enter-104 prise security policies in roaming and non-roaming
environ-105 ment. Our obtained experimental results perceive that based
106 upon the network scenario and traffic type, security is always
107 achieved at the cost of network performance. It is observed
108 that very high security protocols are not always a good choice
109 for all network scenarios and also it is found that the stronger
110 the security protocol, the more are the associated overheads.
111 Our study aims to address the following issues:
112 Impact of different security mechanisms on the
perfor-113 mance of wireless LAN (IEEE 802.11b/g/n).
114 Impact of congested and uncongested network on the
per-115 formance of secure WLAN.
116 Impact of different packet lengths on the performance of
117 secure WLAN.
118 Network performance under TCP and UDP traffic streams.
119 Security performance in non-roaming and roaming
120 scenarios.
121
122 Furthermore, security strength of various protocols is
ana-123 lyzed using a relative security strength index model (RSSI)
124 (Luo et al., 2009). It is always presumed that the more the
125 number of security mechanisms or security services provided
126 by any protocol, more is the protocol strength. On evaluating
127 the security strength using RSSI it is observed that the stronger
128 the security service provided by security algorithm the stronger
129 will be the security protocol. A detailed view of the benefits
130 offered by a particular security protocol is provided by the
131 RSSI model that helps the system designers to choose a
secu-132 rity protocol with the desired strength. The security
perfor-133 mance observed through experimental analysis validates our
134 results obtained from the RSSI model. Further a descriptive
135 statistical analysis is performed to analyze the robustness
136 related with each security protocol. It is revealed that each
137 security protocol varies in robustness against mobility.
Analy-138 sis of variance is performed and it is found that all the network
139 scenarios and performance metrics taken under consideration
140 are significant. All the factors (security protocols, traffic type,
141 and network load) affect the performance of wireless networks.
142 Our experimental results provide a wide quantitative vision of
143 the impact of various security protocols on network
perfor-144 mance. Including this, our analysis is useful in understanding
145 the applicability of security protocols in real time applications
146 and design challenges of future security protocols.
147 The remainder of the paper is organized as follows. Existing
148 studies are discussed in Section2. A brief summary of WLAN
149 standard and WLAN security protocols is described in
Sec-150 tions 3 and 4respectively. Section5details the experimental
151 testbed along with different security layers and the system
152 modeling considered in the testbed. A RSSI model is presented
153 in Section6. Performance metrics under consideration is
dis-154 cussed in Section7. Numerical results for different security
lay-155 ers in different network environments are explained in
156 Section8. Statistical analysis is done in Section9. Conclusion
157 is drawn in Section10.
158 2. Related work
159 To determine the realistic view of the performance impact of 160 security mechanisms, measurements play an important role. 161 Therefore to gain the fundamental understanding of the 162 impact of various security mechanisms on the network perfor-163 mance, a number of research papers have appeared in the lit-164 erature reporting the security performance of IEEE 802.11b/ 165 g based wireless local area networks. In (Baghaei et al., 166 2004) authors have performed throughput and response time 167 analysis for IEEE 802.11b wireless LAN in a non-roaming 168 environment. It was found that the stronger the security mech-169 anism the more is the performance degradation. An experi-170 mental study to analyze the performance overheads 171 associated by different security protocols was done by authors 172 in (Nayak et al., 2005; Agarwal and Wang, 2007) for IEEE 173 802.11b/g based network. Further in (Begh et al., 2009; 174 Ahmad et al., 2012), impact of security protocols on the per-175 formance of TCP and UDP traffic streams has been analyzed 176 and was found that security protocols negatively affect the net-177 work performance. A more detailed analysis to study the secu-178 rity performance on IEEE 802.11g based wireless network by 179 integrating cross layer security protocols was demonstrated 180 in (Agarwal and Wang, 2007). Another experiment was per-181 formed in (Vibhuti, 2008) to calculate the security impact on 182 end-to-end delay and packet delivery fractions. The impact 183 of cryptographic primitives used in WEP and WPA on 184 throughput and delay over WLAN IEEE 802.11g was investi-185 gated in (Boulmalf et al., 2007). The performance impact of 186 secure IEEE 802.11g WLAN using Open VPN is done in 187 (Likhar and Yadav, 2011). Experiments were performed on a 188 wireless test-bed to analyze throughput, delay and jitter for 189 four security settings: disabled security, WEP, WPA1, and 190 WAP2 for multimedia applications in (Hayajneh et al., 191 2012). WPA2 security-bandwidth trade-off in 802.11n WLAN 192 for IPv4 and IPv6 using different operating systems is studied 193 in (Kolahi et al., 2012). Impact of transmission power on the 194 performance of secure IEEE 802.11n wireless local area net-195 work was reported in (Singh and Jindal, 2014a,b). The avail-196 able literature revealed that a number of researchers have 197 carried out numerous experiments to quantify the security per-198 formance but with several limitations. Firstly the past 199 researches have focused on the improvement of cryptographic 200 aspects of security mechanisms in a small range of network 201 scenarios (Begh et al., 2009). Secondly the previous work 202 brings out the qualitative analysis and does not provide the 203 complete quantitative results in terms of QoS and encryption 204 cost (Hayajneh et al., 2012; Ahmad et al., 2012). The literature 205 survey reveals that most of the research has focused on quali-206 tative security performance of IEEE 802.11b and IEEE 207 802.11g standards but not considering IEEE 802.11n (Likhar 208 and Yadav, 2011). Also the impact of different implementa-209 tions of enterprise security layers on the performance of wire-210 less LAN has not been taken much into consideration in the 211 previous work. The past research was carried out to explore 212 the pros and cons of individual security protocols, but security 213 protocols exist at different network layers (Nayak et al., 2005; 214 Begh et al., 2009; Hayajneh et al., 2012; Ahmad et al., 2012; 215 Likhar and Yadav, 2011; Bhatia et al., 2013; Agarwal and 216 Wang, 2007). It is certain and instinctive to study the effects 217 of security protocols in a cross layer architecture. We aim to
218 provide comparative experimental analysis to study the impact
219 of security mechanisms on the performance of IEEE 802.11b/
220 g/n standard in a variety of network scenarios at different
221 packet lengths.
222 3. IEEE 802.11 WLAN standards
223 WLANs based on IEEE 802.11 standard have been extensively
224 deployed worldwide for information access through wireless
225 medium. However, the communication being in broadcast
226 mode is highly vulnerable to security threats. It is therefore
227 of utmost importance to analyze the security performance of
228 wireless networks based on different versions of the IEEE
229 802.11 standard. In this section, we briefly introduce different
230 IEEE 802.11 standards.
231 Institute of Electrical and Electronics Engineers (IEEE) has
232 developed 802.11 and 802.11x, referred to as a group of
stan-233 dards/specifications for WLANs (Bhoyar et al., 2013). The
234 standard IEEE 802.11 specifies an over-the-air interface
235 between a wireless client and an access point or between two
236 or more wireless clients. These WLAN standards were
devel-237 oped with the focus of increasing transmission speeds, range,
238 improving QoS, and adding new amendments. All the
amend-239 ments made in the specifications define the maximum speed of
240 operation, the radio frequency band of operation, encoding of
241 the data for transmission, and the characteristics of the
trans-242 mitter and receiver. A number of versions of the standards
243 have been developed including, IEEE 802.11a, IEEE
244 802.11b, IEEE 802.11e, IEEE 802.11f IEEE 802.11g, IEEE
245 802.11h, IEEE 802.11i, IEEE 802.11j, IEEE 802.11k, IEEE
246 802.11n, IEEE 802.11s, IEEE 802.11ac, IEEE 802.11ad and
247 IEEE 802.11f. However, the most widely used standards are
248 802.11b, 802.11g, and 802.11n and 802.11i (security protocol).
249 These network bearer standards operate in ISM (Industrial,
250 Scientific and Medical) frequency bands. The band being
251 license-exempt makes it economical and easy to deploy
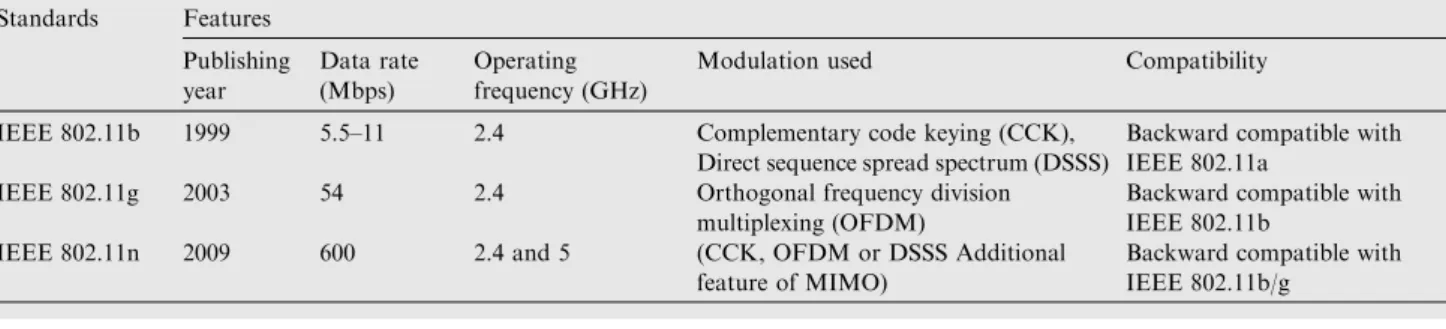
tech-252 nology for common use. The respective features of these
stan-253 dards are shown inTable 1.
254 4. WLAN security protocols
255 To protect the wireless network from illegitimate users and to
256 achieve data confidentiality, integrity and authentication,
var-257 ious WLAN security protocols were developed (Liu et al.,
258 2010). The most popularly adopted security protocols are:
259
Wired Equivalent Privacy (WEP):WEP was the first secu-260 rity protocol developed to obtain security equivalent to the
261 wired network. It provides data privacy using RC4 encryption
262 with 64/128 bit key, initialization vector and integrity check
263 value (ICV) and provide confidentiality, simple integrity and
264 shared key authentication. The weak implementation of RC4
265 and the proliferation of readily available hacking tools led to
266 WEP being insecure and also not popular for enterprise wide
267 distributed processing environments.
268
Wi-Fi Protected Access (WPA)is a security protocol that 269 removes almost all the vulnerabilities of WEP. It is also known
270 as WPA personal. WPA uses RC4 encryption along with
tem-271 poral key integrity protocol (TKIP) which includes message
272 integrity check, initialization vector (IV), key mixing and key
273 management algorithms. Since security mechanisms associated
274 with WPA are more, hence it provides confidentiality and
275 authentication (based on 802.1x and EAP) with enhanced 276 strength as compared to WEP. WPA is intended to work with 277 existing 802.11-based products and offers forward compatibil-278 ity with 802.11i (security standard).
279 WPA2is an enhanced version of WPA where AES is used 280 as an encryption algorithm. It is also known as WPA2 per-281 sonal. Like WPA, WPA2 use 802.1x based authentication. It 282 also includes a Robust Security Network Association (RSNA). 283 RSNA provides two protocols TKIP and AES-CCMP (Coun-284 ter Mode CBC MAC protocol) for data confidentiality. WPA2 285 uses key lengths of 128,192, 256 along with dynamic key distri-286 bution. Altogether these protocols deliver improved confiden-287 tiality, data integrity and authentication as compared to WPA. 288 5. Experimental testbed
289 In order to study the impact of different security layers on the 290 performance of WLAN in different network scenarios, an 291 experimental testbed is developed in a roaming and non-292 roaming environment while considering the users mobility. 293 In this section hardware and software configuration of the 294 experimental testbed, which is miniature of WLAN is illus-295 trated. Although we have shown a simple WLAN architecture; 296 with the use of different hardware and software configurations, 297 a heterogeneous environment can be created that captures the 298 mobile aspects of WLANs. The existing testbed offers itself to 299 be mapped to large scale wireless networks. We have also per-300 formed a comparative analysis of the performance in non-301 roaming and roaming WLAN scenarios. The two network sce-302 narios and the corresponding hardware and software configu-303 rations, security protocols used in the setup are as discussed 304 below:
305 5.1. Non-roaming network scenario (NR)
306 Non-roaming network scenario, represented as NRS, deals 307 with the situation when mobile node (MN) (a wireless node)
308 is communicating with its home agent (HA) (a server who is
309 giving services to client) in the network and the
communica-310 tion path is wireless. This scenario aims to study the impact
311 of security layers only in one domain when nodes are
commu-312 nicating over a secure network. Experimental architecture and
313 used hardware and software configurations for non-roaming
314 network are shown inFig. 1andTable 2respectively.
315
5.2. Roaming network scenario (RS)
316 The roaming scenario, represented asRSdeals with the
situa-317 tion when any of the communication mobile users is in a
for-318 eign domain. In our testbed we have taken roaming scenario
319 as, a client (A) from its home network is moving in the foreign
320 network and gets connected with AP in the foreign network
321 and is communicating with HA which is an application server
322 (A) in the home network. Experimental architecture and used
323 hardware and software configurations for non-roaming
net-324 work are shown inFig. 2andTable 3respectively.
325
5.3. Security policies
326 Experiments are performed on a layered security model.
Per-327 formance analysis with nine security layers is carried out. First
328 six security layers are; SSID (no security layer), WEP/64 (WEP
329 used with 64 bit key), WEP/128 (WEP used with 128 bit key),
330 WPA/AES (WPA used with Advanced Encryption Standard
331 algorithm), WPA2/AES (WPA2 used with AES encryption
332 algorithm), WPA2/AES/TKIP (WPA2 mixed with both AES
333 and TKIP). These are MAC layer security protocols and
pro-334 vide confidentiality, integrity and authentication and are
con-335 sistent with IEEE 802.11 standard (Holt and Huang, 2010).
336 Security layers from 7 to 9 are enterprise security layers;
337 WPA/AES Enterprise, WPA2/AES Enterprise, WPA2/AES/
338 TKIP Enterprise (in all the cases authentication is performed
339 using RADIUS server) and exist at the application layer,
340 which make use of the RADIUS (Remote Authentication Dial Table 1 WLAN standards.
Standards Features Publishing year Data rate (Mbps) Operating frequency (GHz)
Modulation used Compatibility
IEEE 802.11b 1999 5.5–11 2.4 Complementary code keying (CCK),
Direct sequence spread spectrum (DSSS)
Backward compatible with IEEE 802.11a
IEEE 802.11g 2003 54 2.4 Orthogonal frequency division
multiplexing (OFDM)
Backward compatible with IEEE 802.11b
IEEE 802.11n 2009 600 2.4 and 5 (CCK, OFDM or DSSS Additional
feature of MIMO)
Backward compatible with IEEE 802.11b/g
Server: 192.168.1.10 Cisco Access Point WAP4140n Client 1:192.168.1.20
192.168.1.245
RJ-45 Cable
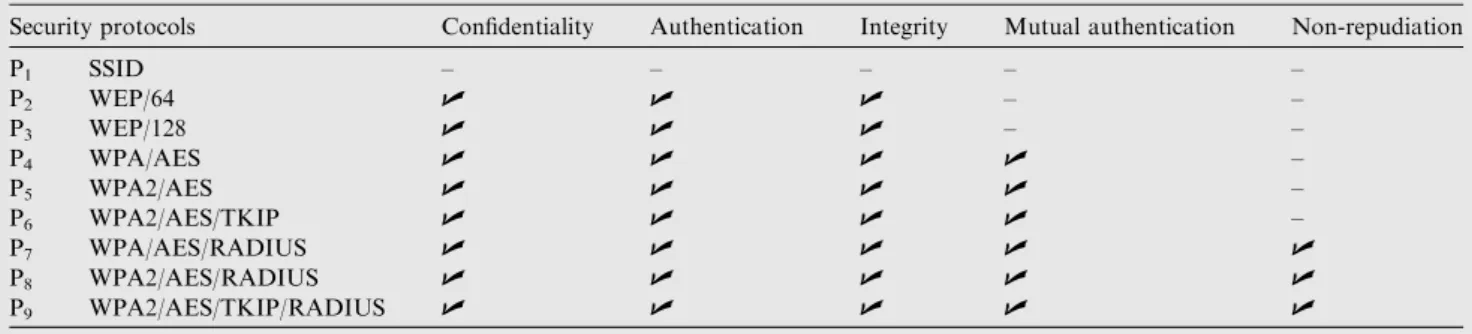
341 in User Service) server. It provides advanced authentication 342 through digital signatures and provides more security as 343 compared to layer 1-6. Table 4shows the security protocols
344 and their associated security services. We have studied these
345 nine security protocols because of their prevalent use in many
346 networks for security provisioning.
347
5.4. System modeling
348 To carry out experimental analysis we have selected different
349 system parameters. Table 5 presents the system parameters
350 selected for system modeling during the experiments.
351 6. Relative security strength index (RSSI)
352 To analyze the security strength offered by various security
353 protocols is known to be one of the most challenging issues.
354 A simple measurement for the analysis of security strength
355 referred to as relative security strength index is presented in
356 this section. All the security protocols including WEP, WPA,
357 WPA2, make use of different encryption and authentication
358 mechanisms and offer security services, like confidentiality,
359 integrity, access control, authentication, mutual authentication
360 and non-repudiation. On the basis of security services provided
361 by a security protocol in the network, it is very difficult to
362 make any statement on the strength of the security protocol.
363 For example, a security protocol SP1 is having features of
364 integrity and non-repudiation (2 features) and another
proto-365 col SP2 is having features of confidentiality, access control,
366 authentication (3 features but weak as compared to SP1). On
367 the comparison of SP1and SP2with respect to 2 strong
secu-368 rity services of SP1 it can be deduced that SP1 gives more
369 strength as compared to SP2. Similarly on the comparison of
370 both protocols SP1and SP2, on the basis of the features not
371 present in SP1but present in SP2. We will interpret that SP2
372 is stronger than SP1. Hence, it is not an easy task to quantify
373 the absolute dissimilarities between the strength of the two Table 2 Network configurations in a non-roaming network
scenario.
Network configuration in non-roaming network scenario Hardware
configuration
- A server (Window server 2008 with 3.20 GHz processor, 4 GB RAM was used as a RADIUS server)
- A client (Windows 7 professional, I3 second generation processor, 3.2 GHz, 4 MB of RAM)
- An access point (Cisco WAP4140n) - RJ45 Ethernet cable for wired connectivity - The experiments were based on windows 7
(both clients and server) as it has built in implementation of 802.1x authentication protocol
Software configuration
-The Etherealis a packet analyzer and is used to capture live network statistics and mea-surements were obtained from the server (Ethereal,http://www.ethereal.com/) -IP Traffic Generatoris windows based
soft-ware testing tool designed for both fixed and wireless networks that can run on any system with windows 98, 2000 or XP window 7. It can generate, receive, capture, replay IP traffic, measure end-to-end performance and quality of service over any fixed or mobile network. (IP traffic,www.zti-telecom.com/) -RADIUSserver functionality is provided by
FreeRadius and is installed on all machines (RADIUS,http://www.freeradius.org)
374 protocols. The confirmation of which one is the better security 375 protocol between the two protocols depends upon several 376 parameters like ‘what are the network requirements?’, ‘which 377 security protocol and features are enabled in the network?’ 378 Various studies have been reported in the past to define the 379 quality of protection of a system (QoP). Different security 380 models to evaluate the QoP of a system are discussed in 381 (Luo et al., 2009; Chen et al., 2011) and it is found that it is 382 very hard to differentiate the strength offered by two protocols 383 with similar status.
384 Another approach to analyze the security strength of VoIP 385 is shown in (Casola et al., 2005). In this method weights are 386 assigned to each security feature and are framed in a matrix 387 form. It is observed that though this matrix approach is effi-388 cient but incurs more processing time and power consumption. 389 For the analysis of mobile multimedia applications a different 390 framework is given in (Ong et al., 2003) which defines QoP
391 parameters. A similar study to analyze the security strength
392 provided by various security protocols is demonstrated in
393 (Agarwal and Wang, 2007), where security strength is
evalu-394 ated by defining utility function and reward model and
395 obtained the cumulative strength offered by security protocols.
396 In this paper the same approach as described by the author in
397 (Agarwal and Wang, 2007) is adopted to quantify the security
398 strength provided by security protocols. In this paper, we
ana-399 lyze the security strength by measuring RSSI, which is
deter-400 mined by utilizing associated weights derived from the
401 security services offered by each protocol.
402 To measure RSSI the first step includes weight assignment.
403 Weights are assigned in a manner such that two security
pro-404 tocols provide the same number of security features, higher
405 weights are assigned to the protocol with stronger security
fea-406 tures. It ensures that the protocol with stronger security
ser-407 vices is given a higher security strength index relative to
408 security protocols with weak strength. Security index defined
409 in the past (Agarwal and Wang, 2007) quantified different
410 ranges of security protocols as compared to the protocols Table 3 Network configuration in a roaming network
scenario.
Network configuration used in roaming network scenario Hardware
configuration
- A mobile node is a wireless node, which is able to change its position
- The test bed is placed in two subnets includ-ing four laptops (HP laptops (dual 2 core pro-cessor 2.4 GHz), HCl laptops (dual 2 core processor 2.4 GHz), HCl laptop with i3 pro-cessor 2.4 GHZ)
- Two access points (Cisco WAP4140n) to con-figure a traditional client/server architecture in a wireless connection
- A switch (D-Link) to provide connectivity between subnets
- RJ-45 cable for connectivity between switch, access points and a server
- Two laptops with one configured as a server (Home Agent (HA)) and the other as a client (A) in a home network. Third laptop config-ured as a server station (Foreign Agent (FA)) and the fourth as a client (B) in a for-eign network
Software configuration
Software installed in the server and client machines used in roaming scenarios are similar to the one used in non-roaming network scenarios
Table 5 Security protocols implemented on the testbed. System parameters
Bandwidth For IEEE 802.11b/g/n the nominal bandwidths are 11 Mbps/54 Mbps/72 Mbps respectively For IEEE 802.11b, 12 Mbps for congested and 5 Mbps for uncongested network
For IEEE 802.11g, 55 Mbps for congested and 30 Mbps for uncongested network
For IEEE 802.11n, 75 Mbps for congested and 50 Mbps for uncongested network
Traffic type TCP and UDP traffic streams
Packet length 500, 1000, 1500, and 2000 bytes Total number of
packets
The choice of number of packets did not affect the performance observed in the results. Thus we have selected this parameter as 0. As long as our session is ‘on’, packets are transmitted continuously
Traffic generation
IP traffic generator tool has been used to generate WLAN traffic. IP packets are transferred in a predefined number, size, content and bandwidth in order to measure the performance impact of security algorithms in the wireless LAN
Table 4 Security protocols implemented on the testbed.
Security protocols Confidentiality Authentication Integrity Mutual authentication Non-repudiation
P1 SSID – – – – – P2 WEP/64 U U U – – P3 WEP/128 U U U – – P4 WPA/AES U U U U – P5 WPA2/AES U U U U – P6 WPA2/AES/TKIP U U U U – P7 WPA/AES/RADIUS U U U U U P8 WPA2/AES/RADIUS U U U U U P9 WPA2/AES/TKIP/RADIUS U U U U U
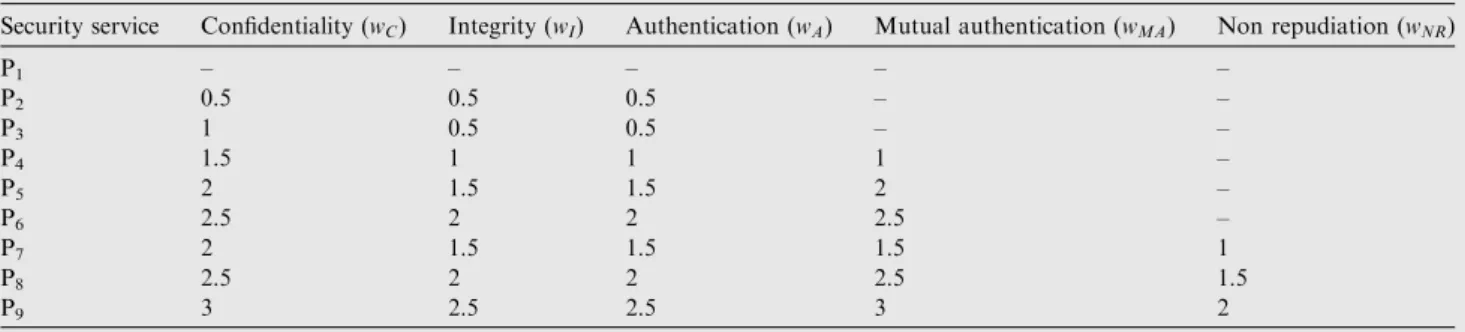
411 presented in this paper. So to accommodate security protocols 412 used in this paper, weight assignment is done on the basis of 413 the strength of associated security services of these protocols 414 which in turn depends upon the parameters like length of 415 key used, hash functions, message authentication code, digital 416 signatures and so on. This weight assignment only gives com-417 parative strength of one protocol with respect to another but 418 not the absolute strength measurement. It can be illustrated 419 as, if two distinct mechanisms supply the same service of integ-420 rity but are assigned weights of 3 and 2 respectively, it doesn’t 421 mean that the service with weight 3 is 3 times stronger than the 422 service with weight 2. It simply infers that the service with 423 weight 3 has more strength as compared to service with weight 424 2. The weights assigned to each security service associated with 425 each security protocol are shown inTable 6and weight assign-426 ment criteria is detailed below:
427 Service set identifier (SSID):is a network identifier number 428 and is usually broadcasted by access point (AP) so that a sta-429 tion (STA) can access the network. SSID does not provide any 430 security and is known to be a ‘No Security’ layer. No security 431 features are provided by SSID, hence no weights are assigned 432 to any feature in SSID.
433 Wired Equivalent Privacy (WEP): WEP/64/128is used in 434 our experimental testbed. WEP/128 employs a 128 bit key 435 which provides more strong confidentiality as compared to 436 WEP/64 due to long key. So weights assigned to WEP/64 437 are lowest as compared to other protocols and weight values 438 assigned to WEP/128 have higher values as compared to 439 WEP/64.
440 Wi-Fi Protected Access (WPA): In the experimental
441 testbed WPA is used with TKIP disabled and Advanced 442 Encryption Standard (AES) (as it is optional in WPA) enabled 443 (WPA/AES). Since security mechanisms associated with WPA/ 444 AES are more, it provides confidentiality and authentication 445 (based on 802.1x and EAP) with enhanced strength as com-446 pared to WEP. The security features are assigned with more 447 weight values as compared to WEP/64/128.
448 WPA2:WPA2 is used in two ways one with TKIP disabled 449 and Advanced Encryption Standard (AES) (as it is optional in 450 WPA) enabled (WPA2/AES), and another when both TKIP 451 and AES are enabled(WPA2/AES/TKIP).Mechanisms used 452 in WPA2/AES are more in number and strong enough as com-453 pared to WPA/AES and WEP, so weights assigned to the secu-454 rity features associated with WPA2/AES are higher than 455 WPA/AES. WPA2/AES/TKIP is using a number of mecha-456 nisms even more than WPA2/AES, resulting in higher weight 457 values.
458
WPA and WPA2are also used with RADIUS server and 459 are called as enterprise security layers. WPA/AES and
460 WPA2/AES explained above are not making use of Radius
461 server to hold per user key. It is generally used in large
net-462 works to control the individual access. It supports all the
fea-463 tures of WPA/AES and WPA2/AES personal thus providing
464 the same security features. Including this, digital certificates
465 are used in the RADIUS server to authenticate each user,
466 hence enhancing the strength of the protocol. Based on the
467 security mechanisms used (as discussed above for WPA/AES
468 and WPA2/AES) along with digital signatures, weights are
469 assigned as shown in Table 6. Similarly WPA2 is used with
470 both AES and TKIP enabled along with the RADIUS server
471 and provides the maximum number of strong security features
472 and the weights assigned to the associated features are having
473 highest value.
474 After weight assignment, the second step during the
mea-475 surement of RSSI is to find out the cumulative effect of all
476 the security features provided by the individual protocol or
477 hybrid protocol (WPA/TKIP/AES). The cumulative effect of
478 security services associated with security protocols is evaluated
479 by finding the linear sum of the weights associated security
ser-480 vices. Weights are obtained as defined in the step one. With the
481 assumption that a security protocolSPxis having Nsecurity
482 mechanisms then Relative security strength (RSSI) is measured
483 as: 484 RSSIðSPxÞ ¼ XN n¼1 wAjsAþwCjsCþwIjsIþwMAj sMAþwNRj sNR ð1Þ 486486 487 where,wAj is the assigned weight of an algorithm on
authenti-488 cation,wCj is the assigned weight of an algorithm on
confiden-489 tiality,wIjis the assigned weight of an algorithm on integrity,
490
wMAj is the assigned weight of an algorithm on mutual authen-491 tication and wNRj is the assigned weight of an algorithm on
492 non-repudiation. S(.)is a service function that indicates if a
493 particular security service is supplied by the algorithm j or
494 not. If yes then its value is 1 otherwise zero. Now if RSSI of
495 security protocol P9 (WPA2/TKIP/AES/RADIUS) is
evalu-496 ated, the weights with all the security services given inTable 6
497 arewAj ¼3,wCj ¼3,wIj¼2:5,wMAj ¼3:5,wNRj ¼2 and service
498 function S(A)= 1, S(C)= 1, S(I)= 1, S(MA)= 1, S(NR)= 1
499 (represents that all the security features are provided by
500 security protocol). RSSI value for security protocol P9 is
501 3 * 1 + 3 * 1 + 2.5 * 1 + 3.5 * 1 + 2 * 1 = 14 (highest value).
502 Similarly RSSI for P2= 0.5 * 1 + 0.5 * 1 = 0.5 * 1 + 0
Table 6 Weights assigned to the implemented security protocols.
Security service Confidentiality (wC) Integrity (wI) Authentication (wA) Mutual authentication (wMA) Non repudiation (wNR)
P1 – – – – – P2 0.5 0.5 0.5 – – P3 1 0.5 0.5 – – P4 1.5 1 1 1 – P5 2 1.5 1.5 2 – P6 2.5 2 2 2.5 – P7 2 1.5 1.5 1.5 1 P8 2.5 2 2 2.5 1.5 P9 3 2.5 2.5 3 2
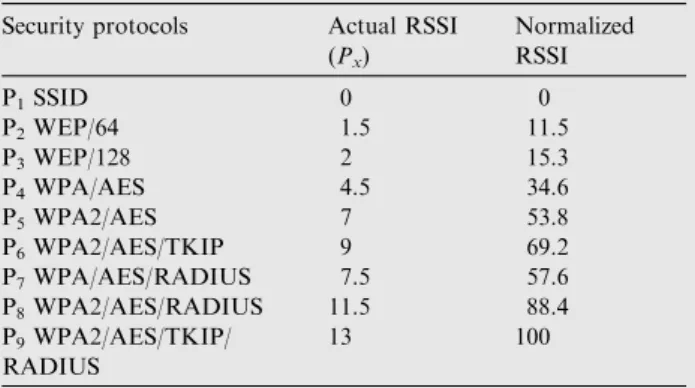
503 + 0 = 1.5 and for P1= 0 (lowest value). To study the security
504 strength of various protocols comparative analysis is done by 505 normalizing RSSI values of all the protocols on the basis of 506 the highest value of P9and actual RSSI value and normalized
507 values are tabulated inTable 7. From the obtained RSSI val-508 ues it is observed that the security protocol with stronger secu-509 rity services is obtaining the highest security strength value. 510 Security protocols P4–6are having the same number of security
511 features but have variable RSSI values based on the strength of 512 security services provided by security protocols. Hence the 513 RSSI model maps the security strength to a quantifiable 514 numerical value and provides a clear view of the security 515 strength provided by each protocol. Thus by looking into these 516 security strength values provided by each protocol, application 517 users or designers can access the security protocol and then 518 make the decision if a particular protocol meets their require-519 ments or not.
520 7. Performance metrics
521 We have measured the performance of wireless local area net-522 work in terms of throughput, response time, encryption over-523 heads, jitter, and frame loss. These parameters can be defined 524 as:
525 (a) Throughput (TP) (Megabits/s): is the measure of total 526 number of bytes transmitted over the network in a given 527 time. TP is measured as follows:
528 529 530 TP¼ I TlðPxÞ TfðPxÞ ð2Þ 532 532
533 where,Iis the total amount of data exchanged between 534 two participating nodes.TlðPxÞandTfðPxÞrepresent the
535 last and first data packet sent per unit time between the 536 sender and receiver with security protocolðPxÞ.
537
538 (b) Response Time (RT) (msec): is defined as the total time 539 required for the data stream to travel between two 540 points which includes connection establishment and 541 security negotiation time. We have measured the 542 response time between the server (server is sending the 543 traffic) and the access point. RT is calculated as the time 544 interval between the moment the server sends a traffic 545 stream to access point and the moment the access point 546 acknowledges the server under various conditions. The 547 obtained numerical values are measured in milliseconds. 548
549 (c) Encryption overheads:on configuring different security
550 protocols into the network, it has been found that different
551 security protocols have different impacts on the
perfor-552 mance of wireless networks. We have analyzed the
over-553 heads associated with each security layer. Overheads
554 incurred by each security layer have been evaluated as
fol-555 lows (Hayajneh et al., 2012):
556 Let P1denote the security layer with almost zero security
557 level. Overheads caused by this layer are zero and thus this
558 ‘No Security’ layer is used to compare the other security
pro-559 tocols with some security level.Pxdenotes the security policy
560 with some security level (with some encryption and
authentica-561 tion operations) wherex= {1, 2, 3. . .. . ..9}.
562
Ts(n,Px) is the time required to process thenth packet by a
563 senderiwith security policyPx.
564
Tr(n,Px) is the time required to process the nthpacket by a
565 receiverjwith security policyPx.
566
Tt(n,P
x) is the time taken by thenth packet to travel in the
567 network between the sender and the receiver with security
pol-568 icyPx.
569 Total time taken in the processing of thenth packet to
tra-570 vel between the sender and the receiver with security policyPx
571 is represented byT(n,Px) and is equal to
572
Tðn;PxÞ ¼Tsðn;PxÞ þTrðn;PxÞ þTtðn;PxÞ ð3Þ 574574
575 Assume thatkpackets have been sent from clientito client
576
j. Therefore the total time required for processingKpackets 577 between clients using security policies Pxis represented as a
578 sum of time involved in processing allKpackets:
579 Xk n¼1 ðTðn;PXÞÞ ¼ Xk n¼1 ðTSðn;P XÞ þTrðn;PXÞ þTtðn;PXÞÞ ð4Þ 581 581 582 If we assume that the size of thenth packet islnbits, and
583 then the total number of bits inkpackets, denoted byBk, is:
584 Bk¼ Xk n¼1 ln ð5Þ 586 586 587 Using Eqs.(2) and (3), bit rate with security policiesPxcan
588 be represented as: 589 BRðPXÞ ¼ Bk Pk n¼1ðTðn;PXÞÞ ¼P k n¼1ðT S ðn;PXÞ þTrðn;PXÞ þTtðn;PXÞÞ ð6Þ 591591 592 where BR (Px) denotes the bit rate (bits/s), that can be
593 obtained with each security policyPx.
594 BRðP1Þ ¼ Bk Pk n¼1ðTðn;P1ÞÞ ¼ Pk n¼1ðT Sðn; P1Þ þTrðn;P1Þ þTtðn;P1ÞÞ ð7Þ 596 596 597 whereBR(P1) is the bit rate (bits/s), achieved by configuring
598 the security policy with zero security level P1.
599 Now assume that OðPXÞ refers the encryption overheads
600 associated with different security policiesðPXÞand is defined
601 as the difference between the bit rate for security layers ðPXÞ
602 andðP1Þ. Encryption overheadsOðPXÞcan be calculated as:
603
OðPXÞ ¼BRðPXÞ BRðP1Þ ð8Þ 605605
606 (d) Jitter (J) (msec): is the measure of variation in the time
607 between the data packets caused by the network.
608 (e) Frame Loss (FL): is the measure of loss of the data
609 frames, that is, frame transmitted over the wireless
net-610 work but not received at the destination. Frame loss is
611 measured as
612 Table 7 Normalized RSSI values.
Security protocols Actual RSSI
(Px) Normalized RSSI P1SSID 0 0 P2WEP/64 1.5 11.5 P3WEP/128 2 15.3 P4WPA/AES 4.5 34.6 P5WPA2/AES 7 53.8 P6WPA2/AES/TKIP 9 69.2 P7WPA/AES/RADIUS 7.5 57.6 P8WPA2/AES/RADIUS 11.5 88.4 P9WPA2/AES/TKIP/ RADIUS 13 100
%Frame Loss¼LoadðMbpsÞ through put across the load LoadðMbpsÞ
ð9Þ 614
614
615 8. Experimental results and analysis
616 Experimental results are obtained for analyzing the impact of 617 security protocols on the performance of wireless networks in a 618 class of network scenarios for three IEEE 802.11b/g/n stan-619 dards. Experiments are performed in both roaming and non-620 roaming environments. A total of nine security protocols are 621 implemented over the testbed. Detailed specifications/parame-622 ters settings of traffic generator, system configurations, Flow 623 rates for congested and uncongested networks, two different 624 traffic streams, packet number, and packet length used during 625 the experiment is mentioned in Section5. Performance metrics 626 as defined in Section7has been used for the evaluation of the 627 security performance of a secure wireless local area network. 628 First set of experiment was performed for analyzing the secu-629 rity performance of IEEE 802.11b/g/n WLAN standards in the 630 roaming environment. Second set of experiment was per-631 formed in non-roaming environment. Though we have per-632 formed experiments for all the network scenarios with 633 different packet lengths for the sake of simplicity and due to 634 space constraints we have presented elaborate results for the 635 TCP congested network with 1000 bytes of packet length. 636 However similar trends are observed in all network scenarios. 637 8.1. Throughput analysis in the roaming scenario
638 Experiments were performed to study the impact of security 639 protocols on the throughput of IEEE 802.11b/g/n WLAN 640 standards in the roaming network in different network scenar-641 ios. The obtained experimental results are elaborated below. 642 8.1.1. Throughput measurement on the basis of applied security 643 protocol
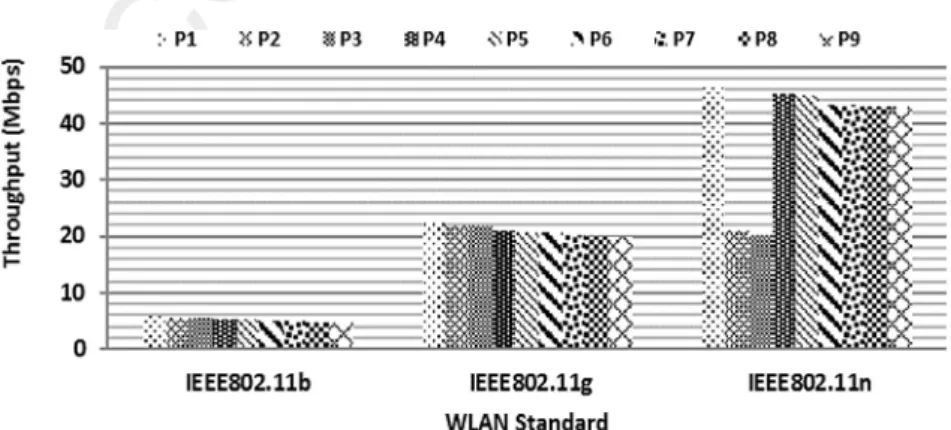
644 Variation in the throughput in response to the particular secu-645 rity protocol in roaming scenario for three standards IEEE 646 802.11b/g/n is shown inFig. 3. For IEEE 802.11b and IEEE 647 802.11g the data rate was set to 12 Mbps and 55 Mbps respec-648 tively. It is observed that different security protocols have dif-649 ferent impacts on the throughput of the network. As shown in 650 Fig. 3throughput is highest for Service set identification (SSID
651 (P1)), which is known to be a ‘No Security’ layer as it provides
652 almost zero level of security. P1is also used as a reference for
653 comparison with other security protocols. It is observed that
654 on increasing the complexity of security mechanisms,
through-655 put decreases significantly. Taking average of all the nine
pro-656 tocols P1–9it is found that throughput decreases by 2.36% and
657 1.36% in IEEE 802.11b and IEEE 802.11g respectively. This
658 throughput degradation is due to an increase in computations
659 of the security protocols, which in turn consume more system
660 resources. As discussed above in Section5.3experiments are
661 performed for security protocols at the MAC layer (P1–6)
662 and the Application layer (enterprise security P7–9). From the
663 obtained numerical results, it is demonstrated that throughput
664 degradation with P7–9 is more than P1–6. It is due to an
665 increased number of messages in the authentication phase.
666 These obtained numerical values however confirmed the
gen-667 eral trends reported in (Baghaei et al., 2004; Turab and
668 Moldoveanu, 2008; Boulmalf et al., 2007).
669 It is verified from the throughput analysis of two IEEE
670 802.11b/g standards that the stronger the security mechanism
671 the more is the throughput degradation. But throughput
672 results for IEEE 802.11n (75 Mbps) are dispelling these
obser-673 vations. As shown in Fig. 3 it is depicted that throughput
674 degradation with protocols P2–3 (WEP64/128) is approx.
675 55% higher than that of P1, 4-9, though these are the security
676 protocols with less complexity. This is due to the fact that
677 IEEE 802.11n requires AES to be enabled on its WLAN used
678 by its client but the WEP protocol uses RC4 encryption
679 instead of AES. It prohibits the use of high throughput with
680 WEP and drop data rates to 54Mbps as reported in (http://
681 www.intel.com/support/wireless/wlan). From security
proto-682 cols P1, 4–9 (P4, WPA/AES) throughput decreased to about
683 1.31% with an increase in the security strength of protocols,
684 also throughput degradation of P7-9is more than that of P4–6
685 but less than P2–3.
686
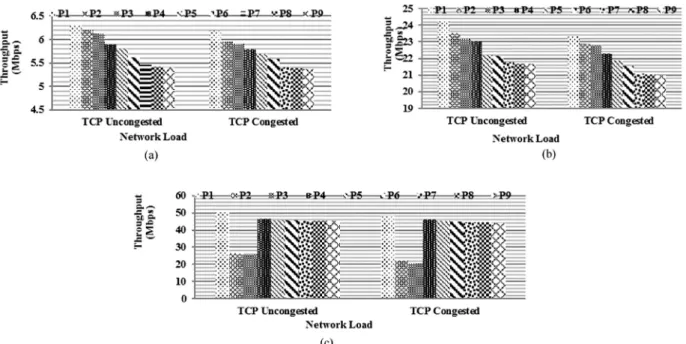
8.1.2. Throughput on the basis of congested and uncongested
687
network
688 Experiments are performed to analyze the impact of security
689 protocols on the throughput of network in both congested
690 and uncongested networks by selecting the data rates for
691 access point as 11 Mbps, 54 Mbps and 72 Mbps for IEEE
692 802.11b/g/n respectively. The obtained experimental results
693 are shown in Fig. 4(a–c). For IEEE 802.11b uncongested
694 and congested networks the traffic was generated at a rate of
695 5 Mbps and 12 Mbps respectively. The obtained experimental 696 numerical values for uncongested and congested IEEE 802.11b 697 with TCP traffic streams are plotted inFig. 4(a). It is revealed 698 that for the uncongested network the maximum throughput 699 obtained for P1is 6.31 Mbps, which is close to its data flow
700 value. Thereafter throughput decreased gradually depending 701 upon the complexity of the implemented security protocols 702 (P1–9), where as in the congested network throughput obtained
703 for P1is 6.19 Mbps, very low as compared to its traffic flow
704 value (12 Mbps). Throughput degradation in the TCP con-705 gested network is 1.7% higher than the TCP uncongested net-706 work Fig. 4(a). From the obtained numerical values it is 707 depicted that throughput in the congested network is less as 708 compared to the uncongested network and this is due to the 709 congestion caused in the network by high traffic generation 710 rates. There is not enough bandwidth available in the network 711 and packets can be dropped at the access point. Further 712 throughput decreased significantly with an increase in the 713 strength of the implemented protocol. The traffic was gener-714 ated at a rate of 30 Mbps and 55 Mbps to make the network 715 uncongested and congested respectively in IEEE 802.11g net-716 work. For security protocol P1maximum throughput obtained
717 for the TCP uncongested network is 24.2 Mbps and through-718 put obtained for the TCP congested network is 23.37 Mbps. 719 From the obtained numerical values it is depicted that 720 throughput for the TCP uncongested network is higher than 721 the congested network. Experimental results plotted inFig. 4 722 (b) demonstrate that average throughput degradation in the 723 TCP congested network is 2.7% more than the TCP uncon-724 gested network. In IEEE 802.11n based network the traffic 725 was generated at a rate of 50 Mbps and 75 Mbps to make 726 the network uncongested and congested respectively. From 727 the experimental results plotted inFig. 4(c) it is depicted that 728 average throughput decreased about 2.01% for security proto-729 cols P1, 4–9in the TCP congested network as compared to the
730 TCP uncongested network. For security protocols P2–3, similar
731 trends are obtained as described in Section8.1.1, throughput
732 degradation is maximum for P2–3.
733
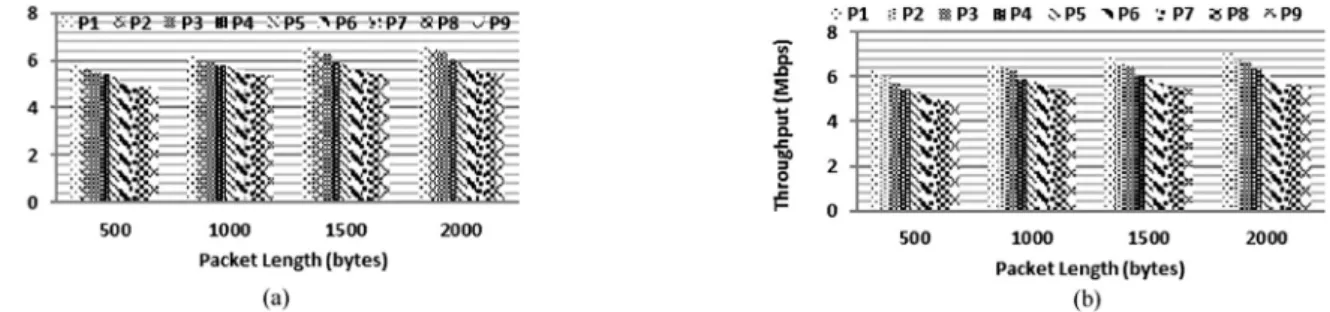
8.1.3. Throughput with variable packet length
734 Experiments are performed to study the impact of different
735 packet lengths (500/1000/1500/2000 bytes) on the throughput
736 of secure wireless network in three WLAN standards IEEE
737 802.11b/g/n in roaming scenarios. The obtained experimental
738 values are plotted inFigs. 5–7. Throughput plots with different
739 packet lengths for IEEE 802.11b in different network scenarios
740 for all the security protocols are shown inFig. 5(a, b). Average
741 throughput increased to about 4.01% with an increase in
742 packet length for TCP in the congested network whereas
743 throughput increased to about 4.1% for the UDP congested
744 network with an increase in packet length. Experimental
745 results are obtained for the IEEE 802.11g network, in the
sim-746 ilar manner as for IEEE 802.11b WLAN network. Obtained
747 experimental numerical values are plotted inFig. 6(a, b). From
748 the obtained numerical values it is demonstrated that with
749 increase in packet length throughput increased by 1.2% and
750 2.6% in TCP and UDP congested networks respectively.
751 Throughput increased to about 1.3% and 2.4% for TCP and
752 UDP congested networks respectively with an increase in
753 packet length in IEEE 802.11n WLAN as given inFig. 7(a, b).
754
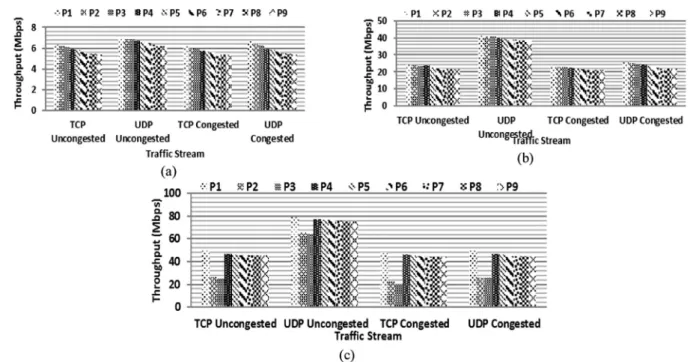
8.1.4. Throughput with TCP and UDP traffic streams
755 Experiments are performed to study the impact of traffic
756 streams on the throughput of a secure wireless network in
757 three WLAN standards IEEE 802.11b/g/n and the obtained
758 experimental results are plotted inFig. 8(a–c). In the
uncon-759 gested network TCP throughput is 11.6%, 42.8% and 44%
760 more than that of UDP throughput whereas in the congested
761 network TCP throughput is 2.9%, 6.01% and 4.4% more than Figure 4 Throughput in roaming scenario IEEE 802.11n network with TCP uncongested and congested (a) IEEE 802.11b, (b) IEEE 802.11g (c) IEEE 802.11n.
762 UDP throughput averaged over the security layers P1–9 for
763 IEEE 802.11b, IEEE 802.11g and IEEE 802.11n WLAN 764 respectively. It is due to the fact that TCP is associated with 765 retransmission of the packets, lost due to congestion and error. 766 Percentage throughput variation averaging over the nine secu-767 rity protocols with all the network scenarios in three WLAN 768 standards is shown inTable 8.
769 8.2. Response time in roaming scenario
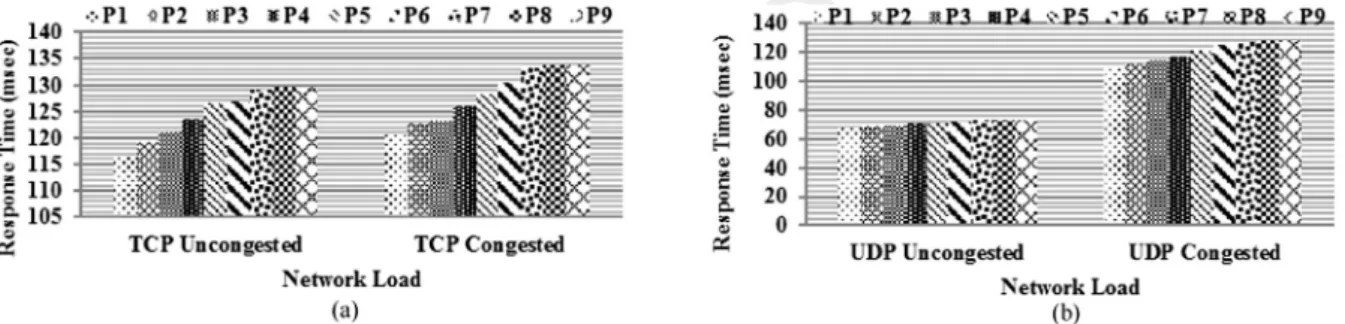
770 Next set of experiments was performed to study the impact of 771 security protocols on the Response time of IEEE 802.11b/g/n 772 WLAN standards in the roaming network in different network 773 scenarios. Response time (RT) is defined as the total time 774 required for the data stream to travel between two points 775 which includes connection establishment and security negotia-776 tion time. We have also investigated how the quality of wire-777 less link affects the response time of secure WLAN. We have 778 measured the response time between the server (server is send-779 ing the traffic) and the access point, and is defined as the time 780 interval between the moment the server sends a traffic stream
781 to the access point and the moment the access point
acknowl-782 edge the server under various conditions. The obtained
numer-783 ical values are measured in milliseconds. The obtained
784 experimental results are elaborated below:
785
8.2.1. Response Time measurement on the basis of applied
786
security policy
787 Response time variation in response to the particular security
788 policy in the roaming scenario for three standards- IEEE
789 802.11b/g/n is shown in Fig. 9. It is depicted that different
790 security policies differ from each other in their impact on
791 response time of the network. Response time is lowest for
secu-792 rity layer SSID (P1). With an increase in complexity of security
793 mechanisms and the time involved in initial negotiation during
794 the authentication phase, response time increases significantly
795 as shown inFig. 9. It is observed that on average response time
796 increased by 1.8% and 1.32% from the security layers P1-9for
797 IEEE 802.11b and IEEE 802.11g respectively. For IEEE
798 802.11n response time for protocols P2-3 (WEP64/128) is
799 approx. 48% higher than that of its no security layer. Average
800 increase in RT for security protocols P1, 4-9is 1.6%.
Figure 5 Throughput for different packet lengths in IEEE 802.11b with (a) TCP congested (b) UDP congested.
Figure 6 Throughput for different packet lengths in IEEE 802.11g with (a) TCP congested, (b) UDP congested.
801 8.2.2. Response Time on the basis of congested and uncongested
802 network
803 Experiments are performed to analyze the impact of security 804 protocols on the response time of network in congested and 805 uncongested network for IEEE 802.11b/g/n and are shown 806 in Figs. 10–12. The obtained experimental numerical values 807 of RT for uncongested and congested IEEE 802.11b and IEEE 808 802.11g network with TCP and UDP traffic streams are plot-809 ted inFigs. 10 and 11(a, b), it is revealed that response time for 810 TCP congested network is 2% and 3.04% more than that of 811 TCP uncongested network and RT for the UDP congested net-812 work is 10.5% and 41% more than that of UDP uncongested 813 network for IEEE 802b and IEEE 802.11g respectively. Secu-814 rity protocols in IEEE 802.11n followed similar trends as 815 detailed for throughput in Section8.1. From the experimental 816 results plotted inFig. 12(a, b) it is depicted that average RT 817 increased by about 2.02% for security protocols P1, 4–9in the
818 TCP congested network as compared to the TCP uncongested 819 network. For the UDP congested network RT is 40.2% more 820 than in the UDP uncongested network for P1, 4–9. It is found
821 that RT for security protocols P2–3is highest in both congested
822 and uncongested networks.
823 8.2.3. Response time with TCP and UDP traffic streams 824 Experiments are performed to study the impact of traffic 825 streams on the response time of the secure wireless network 826 in three WLAN standards IEEE 802.11b/g/n and the obtained 827 experimental results are plotted inFig. 13(a–c). In the con-828 gested network TCP response time is 3.2%, 5.9%, and 829 0.98% more than UDP averaged over the security layers 830 P1–9in all IEEE 802.11b, IEEE 802.11g and IEEE 802.11n
net-831 works respectively.
832 We have obtained RT values at different packet lengths in 833 various network scenarios. Due to the space limitation we have 834 not discussed here the results for analysis of the impact of
835 packet length on RT. Average percentage variation in response
836 time in all the network scenarios is presented inTable 9.
837
8.3. Encryption overheads in roaming scenario
838 Third set of experiments was performed to study the
encryp-839 tion overheads incurred due to the implemented security
pro-840 tocols in IEEE 802.11b/g/n WLAN standards in roaming
841 network in different network scenarios. Overheads are
evalu-842 ated in the manner as described in Section 5. The obtained
843 experimental results are elaborated below:
844
8.3.1. Encryption overheads on the basis of applied security
845
protocols
846 With an increase in complexity of the security algorithm, the
847 number of computations also increases which further increase
848 the associated overheads. In security protocols overheads are
849 associated in encryption and decryption of information. From
850 the experimental analysis it is found that overheads are
mini-851 mum for P1and maximum for P9. This is because P1provides
852 zero security and no encryption and decryption are performed
853 whereas P9 provides multilayer security including RADIUS
854 server authentication which enhances the complexity of the
855 security protocol and hence the associated overheads. It is
856 observed that on taking the average over the security protocols
857 P1–9overheads incurred are increased by 15.4% and 18.9% for
858 IEEE 802.11b and IEEE 802.11g respectively as shown in
859 Fig. 14. For IEEE 802.11n, EO for protocols P2-3
860 (WEP64/128) are very high. Average increase in EO for
secu-861 rity protocols P1, 4–9is 11.3%.
862
8.3.2. Encryption overheads on the basis of congested and
863
uncongested network
864 Experiments are performed to analyze the overheads
associ-865 ated in congested and uncongested secure networks. The Figure 8 Impact of TCP and UDP traffic stream on throughput with uncongested and congested network (a) IEEE 802.11b, (b) IEEE 802.11g, (c) IEEE 802.11n.
866 obtained experimental numerical values for uncongested and
867 congested IEEE 802.11b/g network with TCP and UDP traffic
868 streams are plotted inFigs. 15 and 16(a, b). It is revealed that
869 overheads incurred with TCP congested network are 16.4%
870 and 22% more than that of the TCP uncongested network
871 and EO for the UDP congested network is 41.7% and
872 14.2% more than that of the UDP uncongested network for
873 IEEE 802.11b and IEEE 802.11g respectively. From the
exper-874 imental results plotted inFig. 17(a, b) it is depicted that for
875 IEEE 802.11n average EO increased by about 22.4% for
secu-876 rity protocols P1, 4–9 in the TCP congested network as
com-877 pared to the TCP uncongested network Fig. 17(a). For the
878 UDP congested network RT is 28% more than in the UDP
879 uncongested network for P1, 4–9.
880
8.3.3. Encryption overheads with TCP and UDP traffic streams
881 Experiments are performed to study the encryption overheads
882 incurred due to different traffic streams in a secure wireless
net-883 work in three WLAN standards IEEE 802.11b/g/n and the
884 obtained experimental results are plotted inFig. 18(a–c).
Over-885 heads are more in TCP than in UDP only for P2and the
over-886 heads incurred are 28.2% and 32.1% more in the UDP
887 congested network for P3–9as compared to TCP traffic stream
888 for IEEE 802.11b and IEEE 802.11g respectively. For IEEE
889 802.11n WLAN overheads are 11.9% more in TCP than in
890 UDP for P2–5and the overheads incurred are 3.7% more in
891 the UDP congested network for P6–9 as compared to the
892 TCP traffic stream.
893
8.4. Frame loss
894 Another set of experiments is performed for the measurement
895 of frame loss for all the three standards at different load
val-896 ues. We have plotted percentage frame loss versus load only
897 for four security protocols because similar observations are
898 made for the rest of the security protocols. Load is varied from
899 low to high values i.e. from congested to uncongested range.
900 Frame loss is calculated using Eq.(9). Following observations
901 are made:
902
8.4.1. Frame loss in IEEE 802.11b/g/n WLAN
903 The experimental results presented inFigs. 19–24and
numer-904 ical values shown in Tables 10–15 indicate that percentage
905 frame loss increases with an increase in load for both TCP
906 and UDP traffic stream. It is found that frame loss is less in
907 the uncongested network and is very high in the congested
net-908 work. Frame loss with UDP traffic stream is more than that of
909 the TCP stream. Similar trends are observed in all the three
910 WLAN standards IEEE 802.11b/g/n. Further it is revealed
911 that FL increases with an increase in security strength.
912
8.5. Jitter
913 Experimental results are also obtained to study the impact of
914 different security protocols on jitter in different network
sce-915 narios. It is observed that different security implementations
916 have no impact on jitter values in all the network scenarios.
917 It is found that for IEEE 802.11b jitter value varies from 0
918 to 2 ms. For IEEE 802.11g/n jitter is almost zero at the
Table 8 Percentage variation of throughput in a secure wireless network in different network scenarios. Decrease in TP with increase in complexity of sec urity policy (avera ging ove r all the security protocols) IEEE 802.11b IEEE 802.11g IEEE 802.1 1n 2.36% 1.36% 1.31% Incr ease in TP of uncongest ed netw ork as com pared to the conges ted network (avera ging over all the sec urity protocols) IEEE 802.11b IEEE 802.1 1g IEEE 802.1 1n TCP UD P TCP UDP TCP UDP 1.7% 10.5% 2.7% 41% 2.01% 47.2% Incr ease in TP with UDP traffi c st ream as com pared to the TCP strea m (avera ging over all th e sec urity protoc ols) IEEE 802.11b IEEE 802.1 1g IEEE 802.11n Conge sted Un congeste d C ongest ed Uncon gested Conge sted Uncon gested 2.9% 11.6% 6.01% 42.8% 4.4% 44% Incr ease in TP with an incr ease in pac ket leng th (av eraging over all the security protoc ols) TCP co ngested TCP unco ngested UDP co ngested UD P unco ngested IEEE 802.11b IEEE 802.1 1g IEEE 802.1 1n IEEE 802.11b IEEE 802.1 1g IEEE 802.11n IEEE 802.1 1b IEEE 802.11g IEEE 802.11n IEEE 802.1 1b IEEE 802.11g IEEE 80 2.1 1n 4.01% 1.2% 1.3% 3.1% 4.3% 2.1% 4.1% 2.6% 2.4% 2.02% 3.5% 2.5%
919 application layer and this value reaches 1 ms at enterprise secu-920 rity layers.
921 8.6. Performance analysis in the non-roaming scenario
922 Experiments are performed to study the impact of imple-923 mented security protocols on the performance of WLAN in 924 the non-roaming environment where the access point and
925 client are in same domain. Results are obtained in a class of
926 network scenarios similar to the scenarios used for the roaming
927 network. It is observed that performance variations in the
non-928 roaming network are similar to the roaming network in all the
929 network scenarios but the performance degradation in the
930 non-roaming network is less than that of the roaming network.
931 Because of the similar trends followed by all the network
sce-932 narios for all the performance parameters we have presented Figure 9 Impact of security protocols on response time.
Figure 10 Response time in roaming scenario for IEEE 802.11b uncongested and congested network for (a) TCP, (b) UDP.
Figure 11 Response time in roaming scenario IEEE 802.11g network for uncongested and congested (a) TCP, (b) UDP.
Figure 12 Response time in roaming scenario IEEE 802.11n network for (a) TCP uncongested and congested, (b) UDP uncongested and congested.
933 results only for throughput and response time. Further for 934 numerical analysis, TCP congested and UDP congested 935 network with a packet length of 1000bytes are considered 936 for all network scenarios. Throughput and response time 937 values obtained from the experimental analysis of 938 IEEE 802.11b/g/n WLAN standards depict that variations in 939 throughput and response time for the non-roaming network 940 are similar to the roaming network in all network scenarios. 941 Throughput decreases and response time increases with an 942 increase in security strength. Also a decrease in TP is more 943 in the congested network as compared to the uncongested net-944 work whereas response time increases with an increase in secu-945 rity strength. Percentage decrease or increase in throughput
946 and response time in different network scenarios is shown in
947 Table 16. The comparative analysis of performance
degrada-948 tion in both roaming and non-roaming scenarios is presented
949 inTable 17.
950 Experiments are performed to study the impact of
imple-951 mented security protocols on the performance of WLAN in
952 the non-roaming environment where the access point and
cli-953 ent are in same domain. Results are obtained in a class of
net-954 work scenarios similar to the scenarios used for the roaming
955 network. It is observed that performance variations in the
956 non-roaming network are similar to the roaming network in
957 all the network scenarios but the performance degradation in
958 the non-roaming network is less than that of the roaming net-Figure 13 Impact of TCP and UDP traffic stream on response time with congested network (a) IEEE 802.11b, (b) IEEE 802.11g, (c) IEEE 802.11n.
Table 9 Percentage variation of response time in a secure wireless network in different network scenarios. Increase in RT with an increase in complexity of security policy (averaging over all the security protocols)
IEEE 802.11b IEEE 802.11g IEEE 802.11n
1.8% 1.3% 1.6%
Decrease in RT of uncongested network as compared to congested network (averaging over all the security protocols)
IEEE 802.11b IEEE 802.11g IEEE 802.11n
TCP UDP TCP UDP TCP UDP
2% 10.5% 3.04% 41% 2.02% 40.2%
Decrease in RT with UDP traffic stream as compared to the TCP stream (averaging over all the security protocols)
IEEE 802.11b IEEE 802.11g IEEE 802.11n
Congested Congested Congested
3.2% 5.9% 0.98%
Decrease in RT with an increase in packet length (averaging over all the security protocols)
TCP congested UDP congested
IEEE 802.11b IEEE 802.11g IEEE 802.11n IEEE 802.11b IEEE 802.11g IEEE 802.11n
959 work. Because of the similar trends followed by all the network 960 scenarios for all the performance parameters we have pre-961 sented results only for throughput and response time. Further 962 for numerical analysis, TCP congested and UDP congested 963 network with a packet length of 1000bytes are considered for 964 all network scenarios. Throughput and response time values 965 obtained from the experimental analysis of IEEE 802.11b/g/
966 n WLAN standards depict that variations in throughput and
967 response time for the non-roaming network are similar to
968 the roaming network in all network scenarios. Throughput
969 decreases and response time increases with an increase in
secu-970 rity strength. Also a decrease in TP is more in the congested
971 network as compared to the uncongested network whereas
972 response time increases with an increase in security strength. Figure 14 Impact of security protocols on encryption overheads.
Figure 15 Encryption overheads in the roaming scenario for IEEE 802.11b for an uncongested and congested network (a) TCP, (b) UDP.
Figure 16 Encryption overheads in roaming scenario IEEE 802.11g uncongested and congested network for (a) TCP, (b) UDP.
Figure 17 Encryption overheads in the roaming scenario IEEE 802.11n network for (a) TCP uncongested and congested, (b) UDP uncongested and congested.
973 Percentage decrease or increase in throughput and response 974 time in different network scenarios is shown in Table 16. 975 The comparative analysis of performance degradation in both 976 roaming and non-roaming scenarios is presented inTable 17. 977 From the above analysis it is found that different security 978 layers behave differently in various network scenarios. Every 979 layer has a different security strength and different perfor-980 mance impact in terms of throughput, response time, encryp-981 tion overhead, and frame loss. Including the encryption all 982 the network parameters, type of traffic stream, network load,
983 packet size, also affect the performance of the wireless local
984 area network. Encryption overheads increases, throughput
985 decreases, and response time increases continuously with an
986 increase in strength of security. Security layers 7–9 are
enter-987 prise security layers. These are more complex, highly secure
988 layers and have more performance degradation as compared
989 to layers 1–6. These trends are followed in IEEE 802.11b/g
990 WLAN standards. It is observed that IEEE 802.11n behaves Figure 18 Impact of TCP and UDP traffic stream on encryption overheads with the congested network (a) IEEE 802.11b, (b) IEEE 802.11g, (c) IEEE 802.11n.
Figure 21 TCP frame loss percentage with different security protocols in IEEE 802.11g.
Figure 20 UDP frame loss percentage with different security protocols in IEEE 802.11b.
Figure 22 UDP frame loss percentage with different security protocols in IEEE 802.11g.
Figure 19 TCP frame loss percentage with different security protocols in IEEE 802.11b.
991 differently as compared to two other standards where maxi-992 mum performance degradation is observed with WEP64/128. 993 The results presented in the paper reveal that security and net-994 work performance work in contrast to each other. An attempt
995 to make a wireless application more secure, often results in
996 performance degradation. Our comprehensive numerical
anal-997 ysis recommends the appropriate security algorithm in every Figure 24 UDP frame loss percentage with different security
protocols in IEEE 802.11n.
Table 11 Frame loss with UDP traffic stream in IEEE 802.11b.
Network load (Mbps) Security protocols
P1 P3 P4 P7 7 0 0 0 4 8 5 7.1 10.87 13.5 9 13.89 14.77 18 21.78 11 35.63 37.36 42.82 45.27 12 42.5 44.08 48.58 50 13 50.61 52.15 53.15 55.08
Table 12 Frame loss with TCP traffic stream in IEEE 802.11g.
Network load (Mbps) Security protocols
P1 P3 P4 P7 30 6.3 8.76 17.26 23.73 35 22.68 23.17 30.88 36.48 40 31.46 32.13 38 42.17 45 36.64 37.28 44.27 46.2 50 44.64 45.06 53.8 55.6 55 55.72 56.18 58.76 59.78 60 60.08 60.16 63.15 64.2
Figure 23 TCP frame loss percentage with different security protocols in IEEE 802.11n.
Table 10 Frame loss with TCP traffic stream in IEEE 802.11b.
Network load (Mbps) Security protocols
P1 P3 P4 P7 7 1.5 3.4 8.5 14.57 8 6 10.62 14.13 21.13 9 18.1 21.56 22.11 24.88 11 36.5 38.73 45 45.82 12 45.83 48 50.66 51 13 53.93 54.69 56.93 57.92
Table 13 Frame loss with UDP traffic stream in IEEE 802.11g.
Network load (Mbps) Security protocols
P1 P3 P4 P7 30 0 0 0 0 35 0 0 0 0 40 0 0 0 1.1 45 4.64 6.5 7.4 11.22 50 40.36 41.28 42.68 44.94 55 51.47 53.07 55.83 57.94 60 56.38 57.48 60.41 62.63
Table 14 Frame loss with TCP traffic stream in IEEE 802.11n.
Network load (Mbps) Security protocols
P1 P3 P4 P7 70 5.6 22.66 7.32 24.11 75 14.8 26.33 14.46 27.4 80 22.26 28.38 20.15 28.85 85 23.34 30.44 26.53 31.68 90 28 32.85 31.56 33.14 95 30.4 46.52 33.52 34.02 100 32.74 49.8 35.39 36.84
Table 15 Frame loss with UDP traffic stream in IEEE 802.11n.
Network load (Mbps) Security protocols
P1 P3 P4 P7 70 0 4.3 0 0 75 0 11.4 0 0 80 4.6 18.03 1.6 2.4 85 7.6 24.32 6.44 6.88 90 16.45 29.4 10.54 10.95 95 15.98 42.14 14.12 14.49 100 20.04 46.74 18.11 18.41