theRepository at St. Cloud State
Culminating Projects in English Department of English
8-2017
Implications for CALL: Teachers’ Perceptions and
Use of CALL in the Classroom
Benjamin J. Stonehocker
St. Cloud State University
Follow this and additional works at:https://repository.stcloudstate.edu/engl_etds
This Thesis is brought to you for free and open access by the Department of English at theRepository at St. Cloud State. It has been accepted for inclusion in Culminating Projects in English by an authorized administrator of theRepository at St. Cloud State. For more information, please contact [email protected].
Recommended Citation
Stonehocker, Benjamin J., "Implications for CALL: Teachers’ Perceptions and Use of CALL in the Classroom" (2017).Culminating Projects in English. 101.
Implications for CALL:
Teachers’ Perceptions and Use of CALL in the Classroom
by
Benjamin Joseph Stonehocker
A Thesis
Submitted to the Graduate Faculty of St. Cloud State University
in Partial Fulfillment of the Requirements for the Degree of
Master of Arts
in Teaching English as a Second Language (TESL)
August, 2017
Thesis Committee: John Madden, Chairperson
Jim Robinson Sharon Cogdill
Abstract
The goal of this study was to ascertain graduate students’ perceptions of technology use in language learning classroom. More specifically it sought to find out how the graduate students perceived technology, how technologically savvy they felt they were, and how they actually use technology and Computer Assisted Language Learning in their classrooms. A survey was conducted with 14. From those 14 participants, 4 individuals volunteered to take part in an interview to answer questions pertaining to their philosophy about technology, when it is beneficial to language learning, when it is detrimental to language learning, and how
technologically adept they feel they are concerning technology and how that drives their use of it in their classroom.
The survey is broken down into three sections. Section I focused on the collection of demographic information through 11 open questions and 5 closed Yes/No questions. Section II was comprised of two closed yes/no questions as well as 4 open questions pertaining to whether the participants have used a computer to learn a language. Section III consists of 94 Likert questions that participants can mark their answer as 1-6 with 1=Strongly Agree, 2=Agree, 3=Slightly Agree, 4= Slightly Disagree, 5= Disagree, 6=Strongly Disagree. Within Section III the questions can be attributed to three different categories: Perception of computers and technology, instructor affinity for computers and technology, and instructor’s use of computers and technology in the classroom. Results show that instructors have a favorable view of
technology, a slightly lower view of their personal affinity for technology, and a favorable view of technology use within their classrooms.
Keywords: CALL, CAI, Computer-assisted language learning, teacher perceptions, technology use in the classroom.
Table of Contents Page List of Tables ...5 List of Figures ...6 Chapter I: Introduction ...7 Problem Statement ...8
Aim of the Study ...9
II: Literature Review ...10
The Start of Technology Assisted Learning: Radio ...10
Early Computer Aided Instruction ...14
Technology of Today’s Classroom ...15
Issues Present in CAI and CALL ...21
The Three Philosophies...26
Research Questions ...30 III: Methodology ...31 Participants ...31 Instruments ...37 Procedures ...39 IV: Results ...40
Perceptions of Computers and Technology ...46
Participants’ Philosophy ...49
Chapter Page
Affinity for Computers and Technology...51
Use of Computers and Technology in the Classroom ...52
When Technology is Detrimental to Language Learning ...56
When Technology is Beneficial to Language Learning ...58
Summary of Findings ...59
V: Discussion ...68
Restatement of the Issue and Research Questions ...68
Implications...69 Practical Implications...72 Limitations ...73 Further Research ...74 References ...75 Appendix I: Survey ...80
List of Tables
Table Page
I: Demographics: Age of Participants ...32
II: Demographics: Computer & Internet Use (in years) ...34
III: Positive & Negative Paired Questions Sorted by Category ...38
IV: Reported Computer and Internet Use Activities by Number of Participants ...40
V: Reported Technology Participants Used in Their Classroom ...41
VI: Reported Languages Learned With a Computer ...42
VII: Internet and Computer Programs Used to Learn a Language ...42
VIII: What Participants Reported Enjoying While Using Computers and Technology to Learn a Language ...43
IX: What Participants Reported Not Liking About Using Computers or Technology to Learn a Language ...43
X: Perceptions of Computers and Technology Paired Question Scores ...48
XI: Affinity for Computers and Technology Paired Question Scores ...52
List of Figures
Figure Page
I: Demographics: Native Country of Participants ...32
II: Demographics: Participant Gender ...33
III: Demographics: Teaching Experience ...34
IV: Demographics: Years of Computer Use ...35
V: Demographics Years of Internet Use ...35
VI: Demographics: Participants’ First Language ...36
VII: Survey Section III Initial Breakdown of Responses ...44
VIII: Post Weight Breakdown of Survey Section III ...45
Chapter I: Introduction
In the technology community, an observation commonly known as Moore’s Law exists. First introduced in a paper he wrote in 1965, Gordon Moore (co-founder of Intel) made a
hypothesis stating that, due to the observed increases in technology, falling costs of production, and general need, every two years the number of transistors in an integrated circuit would double (Moore, 1965). Gordon Moore’s prediction and observation has held relatively true for the last 40 years (Takahashi, 2005). It explains why today’s cell phone, which can fit into your pocket, holds more processing power than the original Apollo Lander (Takahashi, 2005). Nearly 20 years ago in October, 1997 only 26.6 percent of households had computers and further back in 1984, only 8.2 percent had a home computer (U.S. Census Bureau, 1997). As of 2013, that number has risen to 83.8 percent of U.S households reporting computer ownership (File & Ryan, 2014). This huge jump in computer use and access to information has had a large impact in all areas of our lives. These technological jumps and increased access to information do present a problem to the Second Language Acquisition community. How do we effectively utilize the changes in technology, and even culture, due to this technology in the language learning classroom?
In her 2016 article, Dorothy Chun suggests that “technology in SLA research will assume an increasingly greater role” (p.98). Bax’s concept of normalization and technology’s
advancement further supports this notion (Bax, 2011; Bax, 2003). Normalization as defined by Bax (2003), is a concept that can be related to technological innovation of any kind “and refers to the stage when technology becomes invisible, embedded in everyday practice and hence
would include a pen (or pencil), paper, and books. These technologies are relatively invisible and often taken for granted in not only the classroom but also everyday life and can be deemed as “normalized”. Bax (2003) argued that the goal of CALL should be in fact to move toward a point where the computer, “Probably very different in shape and size from their current
manifestations”, will reach an eventual state of normalization (p. 23). The computer would eventually be used “without fear or inhibition, and equally without an exaggerated respect for what they can do.” (p. 24). Instead, the computer will be fully integrated into aspects of the classroom life, appearing mostly unnoticed, alongside other normalized technologies (Bax 2003; Bax 2011).
Problem Statement
However, with education research focusing on technology and its advancements; it seems to rarely focus on teacher perceptions of the use and efficacy of that technology. If any
mentions of teachers’ perceptions exist within research, it seems to be a minor addition. While figuring out which types of Computer Assisted Language Learning (CALL) are effective, it should be equally important to find out instructor perceptions, and opinions, concerning types of CALL as well. In their 1997 article, Chun and Plass pointed out that “the primary research question is not whether multimedia instruction is effective, but rather under what conditions and for whom.” (p. 69). Instructors act as not only as porters of knowledge but also as mediators, evaluators, and guides in the quest to help students identify relationships among ideas as well as identify any errors of language to aid the English Language Learner.
Aim of the Study
With a role this large, instructors’ input into not only what works, but how they perceive CALL and technology in the classroom is essential, and could be an aid into where further research should be focused. The goal of research is to shed some light into the perceptions that (relatively) newer teachers have concerning technology and its use in the language learning classroom. Hopefully this will aid further research by inspiring other researchers and institutions to work with teachers when generating goals pertaining to the use of technology and their
educational goals. This could help reduce needless expenditures by institutions for technology that is not fully developed, implemented, or utilized. More importantly, this cooperation could help our future students in achieving their language learning goals through a more effective use of technology in the language learning classroom.
Chapter II: Literature Review
This literature review will discuss how technology developed in today’s classroom. It will begin with radio and how it was implemented for distance learning and language learning and how it paved the way for early Computer Aided Instruction utilizing the PLATO system with centralized computers and terminals. Technology present and in use in today’s classroom including online courses, social media, and gamification in the classroom will also be discussed. Issues present within Computer Aided Instruction and Computer Assisted Language learning as well as the three philosophies and relative time periods that each one was most relevant despite major overlaps among the three will be covered.
The Start of Technology Assisted Learning: Radio
When examining Computer Assisted Language Learning, it is important to look at how it developed. One of the earlier uses of technology in the aid of language learning was used by Bolinger. Bolinger held bi-weekly Spanish classes on the radio in the early 1930s. In Bolinger’s 1934 paper for The Modern Language Journal titled “Spanish on the air in Wisconsin,” he cited some opinions of listeners that oddly enough sound the same as some learners today. One learner wrote about radio that, “[it] is the most efficient way possible for the study of language for all those not in attendance at the university … time saved from tedious trips back and forth to classes only to listen … to the inaccurate and halting recitations by students no better prepared than oneself” (Bolinger, 1934, p. 217). Bolinger’s (1934) study of the delivery of instruction (although through a different medium) via distance learning showed benefits for students in not only rural locations but also for those students who have been “spurred to do additional work on their own initiative” (Bolinger, 1934, p. 218).
Radio was sought as a medium due to its relative ease of accessibility and presence within most homes. On the other hand, some learners and rural educators, felt that the
broadcasts were set at a time slot (afternoon) that does not guarantee all interested individuals would have access (Bolinger, 1934). While they had accessibility to a radio itself, due to the demands of their schedules, the programs may not be convenient. The early research into radio and technology itself as a medium often overlooked teacher input. Many studies often used teachers as a means to gather information as to the efficacy of their program rather than soliciting instructor’s constructive input. Rothney and Hansen (1947) conducted an evaluation of radio programs’ viability as a means of instruction for inter-cultural communication. More
specifically, their program sought to teach students about stereotypes and conflict resolution through various broadcast programs (Rothney & Hansen, 1947). Like much of the research of the time period, the main input solicited from the teachers in Rothney and Hansen’s (1947) study was evaluating how well the program worked. However, they also sought the teachers’ input and judgement concerning the value of the program as well as suggestions for its improvement in their classroom (Rothney & Hansen, 1947). By meeting with the teachers and students who listened to their radio broadcasts, Rothney and Hansen were able to elicit information about their program that a simple survey, or a study of the program’s effectiveness, would have otherwise missed. Teachers and students both pointed out that some of the characters in the shows were far too fabricated and they were not relatable (Rothney & Hansen, 1947). On the other hand, very relatable characters existed in other programs (Rothney & Hansen, 1947). The opinions about the programs’ characters varied among the schools that took part in the study.
Rothney and Hansen’s (1947) evaluation showed a resounding agreement that the program fostered better thinking and action in the students concerning racism and classism. However, negative opinions from instructors were expressed such as “radio programs are a burden” and “excessive use of the program would involve an excessive amount of work”
(programs (Rothney & Hansen, 1947, p. 112). Of particular interest are teachers’ suggestions on what would make the programs better. Various teachers voiced that the programs need to
address the real-life situations that the students at their schools faced, characters should be more authentic and genuine, and despite being a positive the program could use some form of
interaction (Rothney & Hansen, 1947). While the researchers at the time may have regarded the feedback as constructive, it almost seems prophetic looking at it now from 2016. In this age, efficacies of programs are based on exactly what some of those teachers suggested nearly 70 years ago: programs should be relatable, authentic, and should have some form of interaction focused on the learner.
Along the same lines of research, Henderson (1968) sought to teach mathematics via radio instruction. The broadcast instructed teachers on what to do at the chalkboard thereby utilizing them as pseudo-assistants (Henderson, 1968). After the broadcast, teachers were asked to fill out a questionnaire consisting of five questions, four of which were simply demographic information concerning the classrooms, difficulty in following the instructions outlined, and number of students reached by the broadcast. For the fifth question, Henderson (1968) went on to simply ask a yes or no question to the teachers :”Do you feel that future radio broadcasts can be of value to you during your teaching high school students the subject matter of mathematics” (p. 56). Every teacher (59/59) answered yes to the question. Interestingly, miscellaneous
(unsolicited) comments came in with the questionnaire as well. Some of the teachers from Henderson’s (1968) survey seemed positive about the experience, “students liked broadcast very much,” and “different, interesting, explained well” were a couple of the responses (p. 58). Others offered suggestions such as requesting copies of script ahead of time, knowledge of the topic prior to the broadcast, and taped and stored programs to be played at the correct time within their schedule. One teacher respondent from Henderson’s (1968) survey answered positively to the questionnaire yet pointed out “there is so much material to cover in regular work, I just don’t have time for anything else” (p.58). These unsolicited suggestions and comments were key to the radio broadcast programs, as they outlined both positive aspects of the program and deficiencies that the teachers saw and encountered. Yet, the suggestions and comments were referred to in the study as merely a matter of interest or simply a footnote.
In an effort to direct other researchers toward the uses of radio, Garfinkel (1972) wrote a review of resources pointing to a few of the studies used in radio. He opined that little was still relatively known about this “potentially valuable learning aid” (p. 158), and despite a few studies done, some of which had flawed experimental designs, greater research was needed to allow a better exploitation of a medium that can provide a classroom with a “wealth of stimuli from all over the world” (p. 162). Of the same mindset, Wipf (1984) provided a list of thirteen major benefits to radio broadcasts. He argued that the uses of a shortwave radio to listen to broadcasts from around the world of the target language would be beneficial. Some of the benefits included were relevant “cultural information ... and current models of language use,” grammar can be acquired though the context of real language, increases in listening comprehension due to “hearing target language at normal speed,” students can be exposed to different regional
language variations, accessibility to less available or less commonly taught languages, and an increase of motivation can be had by learning with authentic and original broadcasts (p. 7).
However, Wipf pointed out though that the use of a shortwave radio can have pitfalls. Among these pitfalls are issues with signal strength, differences in time zone, being only able to hear the broadcast once, and being constrained by the topics that are broadcast in the target language country (Wipf, 1984). Echoed within Wipf’s (1984) study as well are teachers possible increased workload needed to create lessons that effectively utilize the broadcasts used in their classroom.
Early Computer Aided Instruction
There is no specific date and time that educators switched over from researching radio broadcasts and education to computer aided instruction. In fact, large overlaps of the
technologies exist, even today. Computer Aided Instruction came about much earlier than one would think. In the days when computers required a full room, Universities and some businesses would set up time-sharing of the terminals. One of the earlier research studies was performed in 1968 by Adams, Morrison, and Reddy. In an effort to set up a new type of language laboratory, they wrote a program that students would use on terminals. The students were faced with questions, pictures, and audio clips and prompted to give the correct answer. If the student was unable to get the correct answer, another question or prompt of the same type was given until the student achieved a passing score and was then allowed onto the next module. Some parts of the exercise with the terminal required the student to self-assess as well.
Although computers were relatively rare in 1968, Adams, Morrison, & Reddy (1968) saw promise in its use “as an education tool CAI has potential in its capability both to supervise
student performance and to monitor, record, analyze, and summarize data about that
performance” (p. 3). However, in outlining the program the only mention of teachers were two brief explanations of the teacher’s responsibility, that of mainly a goal setter and coder. In their research the only other mention of the teachers referenced that “both teachers and students liked the laboratory on the whole” (p. 15). As was the case in aforementioned studies, no focus was directed at the teacher and their perceptions of the program, merely description of and an analysis if the program as a whole worked.
It was not until the advent of the Programmed Logic for Automatic Teaching Operations (PLATO) system was developed that most of the early computer aided instruction programs were available. Much of the designs were like Adams, Morrison, and Reddy of 1968, instruction on the PLATO system which provided students with questions. In the event the student provided a wrong answer the system would provide feedback or allow the student to select <Help> in this system promoting the student to find the correct answer. Curtin, Clayton, Finch, Moor, and Woodruff’s (1972) study used the PLATO system to instruct students in Russian. Through their use of PLATO to quiz the students on questions, providing timed drills, and gradual increases in difficulty Curtin et al (1972) felt that the “PLATO system permits each student a great degree of individual instruction” (p. 354). Students were able to face the material at their own pace and were able to repeat sections they felt necessary to not only meet instructor requirements but their own personal satisfaction (Curtin, Clayton, Finch, Moor, & Woodruff, 1972).
Technology of Today’s Classroom
No one can argue that today’s technology has grown by leaps and bounds. Among the technologies that are utilized today are Online Only classes, Social networks, Mobile Assisted
Language Learning (MALL), and Online Gaming. One study done by Pew Research Center shows that 68% of Americans have a smartphone and 67% have broadband internet at home, with a joint 56% reporting having both a smartphone and home internet (Horrigan, 2016). It is no wonder that educators have sought to utilize the tools that both they and learners possess. One of the earlier concepts that came with the advent of the internet was distance learning (online courses). In the same Pew Research Center study, 14% of Americans reported being very familiar with distance learning and 24% reported being somewhat familiar (Horrigan, 2016).
In terms of online learning and face-to-face learning, educators in Wray, Lowenthal, Bates, & Stevens’ (2008) study reported that certain aspects of learning worked better in face to face settings versus online education and vice versa. Among the different strategies for
instruction, the educators felt that presentations and group discussions were, and should be, used more often in a traditional face to face classroom (Wray, Lowenthal, Bates, & Stevens, 2008). One instructor put it plainly that “you just don’t get that good old-fashioned interface” when commenting on having presentations created (such as PowerPoint) by students and having them posted online without any ability to have the presentation’s creators engaged in discussion by other students (p. 246). Other instructors opined that they feel “debates and brainstorming was not effective outside of a face-to-face environment because they believed these strategies require students to respond immediately” (p. 246). It is interesting to note that among the instructors, some reported in Wray et al’s (2008) study that teaching online helped instructors to think about the ways they taught and “broadened their awareness of student needs and methods to engage
them” and has also led the instructors to “integrate technology in face-to-face classrooms more than ever” (p. 246).
An interesting bit of research by McKeon (2014) compared learner and instructor attitudes towards online learning. The results published showed 80% of learners reported more enjoyment with online learning versus 64% instructors reporting the same (p. 66). At the same time, both instructors (85%) and learners (96%) reported liking the accessibility of online learning (p. 66). The instructors tended to prefer face to face classroom learning more than the learners. McKeon’s (2014) study showed that instructors felt that they were available when students needed guidance only 64% of the time, but at the same time 80% of learners felt that when guidance was needed, their instructor was available (p. 68). This divergence in numbers is interesting to note as it could be indicative of underlying issues that may explain why instructors feel they personally weren’t readily available for guidance, yet learners felt that the instructors were.
Another addition to instructors’ tools for teaching is Web Based Learning Tools
(WBLT). WBLTs are integrated online components that can be used in a traditional classroom to add an online element or even in online only courses. Among the types of WBLTs are
course/topic specific tools (that are far too numerous to list) as well as institutional type WBLTs such as Blackboard, Desire2Learn, and WebCT which are able to be adapted to fit the course and material as the instructor sees fit. Kay, Knaack, and Petrarca’s (2009) study sought to find teachers’ perceptions of these WBLTs, and found that 78% of teachers felt that students learned effectively with WBLTs. Among the findings, WBLTs were used 53% of the time for review of a previous concept (p. 34). Conversely, 6% of teachers rarely used WBLTs for use in teaching a
new concept (p.34). According to Kay, Knaack, and Petrarca (2009) these numbers could be attributed to instructors being cautious and indicative of teachers’ uncertainty of WBLT’s value or an unwillingness/inability to develop strategies to integrate WBLTs into their classroom (Kay, Knaack, & Petrarca, 2009). The reasoning behind this possible attribution is due to a correlation found between teachers’ perceptions of the engagement level WBLTs possess and student’s actual learning performance, “in other words, if a teacher thought a WBLT was engaging, students achieved significantly higher gains from pre- to post-tests” (p. 40).
Mobile Learning, or Mobile Assisted Language Learning, has been around since electronic devices became capable of being carried freely. At first, cassette players were utilized, which led to CD players and eventually MP3 players as well to be used for recorded lessons that a listener could play back at their discretion. Presently, our personal cell phones have become “smart phones” and are able to not only hold language dictionaries, flashcard programs, and various e-books, but also a whole gamut of applications exist from which both learners and instructors can use for language learning. Godwin-Jones (2011) points out that the significant enhancements of the mobile phone’s web browser, larger high-resolution screens, more powerful processors, more internal RAM, and faster internet connectivity have allowed the phones to act much the same as a computer, but it rests in your hand and offers nearly the same abilities as tablet PC’s. This has allowed previously used phrase e-books to have extended ability to hold more content, include audio and video functions, and allow integration with online sites (Godwin-Jones, 2011). The days of traditional flashcard programs are also over, as today’s flashcard programs can offer a wider range of support such as card editing, adaptation to the user
or content, and synchronization with desktop or online elements as well to save user progress (Godwin-Jones, 2011).
With the development of technology came Social Networks. At first, presented as text based sites, they have since evolved to allow pictures, videos, and even live broadcasts. As Lomicka and Lord (2016) point out, sites such as these “can offer learners the opportunity to observe native spoken language” (p. 262). Perhaps defined as a subset of Mobile Assisted Language Learning, Social Networking for use in the language learning classroom is just now gaining traction in the education field. Lomicka and Lord (2016) point out despite the potential that Social Networking (SN) presents in the field of education and its relative widespread popularity, it has simply not been embraced in education. In fact, according to Lomicka and Lord (2016), “Although there are an increasing number of academic studies related to various social media tools, many of them are not empirically based, nor offer strong theoretical
advances” (p. 256). Adding to that, articles exploring teachers’ perceptions of social networking appear extremely rare.
One such social network site that has expanded its utility is Facebook. Besides connecting with friends, Facebook has widespread uses from finding roommates, books, and items for sale to even groups in which individuals with similar interests can connect. Another module, named Courses, allow individuals to create a specific course page that others within the academic course can join in order to exchange knowledge, collaborate, set up study groups, and further discuss key concepts covered within the class. Facebook’s expanded ability to share videos and pictures allows both instructors and students the ability to use multimedia within the aforementioned activities (Blattner & Fiori 2009). It is not difficult to see the benefits that a
language learning classroom can reap from the use of a social networking site such as Facebook. Lin, Warschauer, & Blake (2016) point out that because these social networks have an inherent peer-review built directly into them, they “may promote mutual engagement, as users
collectively engage in discussion to achieve their goals (p.124).
Another avenue that educators have begun to explore involves Gamification. Deterding, Dixon, Khaled, and Nacke (2011) outlined a working definition of Gamification despite
widespread contestation with the term. Their proposal defines Gamification as “the use of game design elements in non-game contexts” (p. 9). The main idea behind Gamification is that the primary purpose of video games is entertainment, and so under this direction the video games actually offer motivation for users, or players, to interact with them. Researchers and developers have since looked at ways to take the entertainment value of a game and direct it towards a goal with a more complex purpose than simple entertainment (Deterding, Dixon, Khaled, & Nacke, 2011).
Some have taken this idea, and using preexisting games, opted to incorporate them into their classroom mechanics. Others have created an entirely new game to meet their classroom needs. In July of 2016, a new game was released on Steam (a popular Online PC gaming store) in which an RPG (Role Playing Game), called “Learn Japanese To Survive! Hiragana Battle”, was showcased. The game takes an RPG (a popular game genre) and replaces enemies with Japanese Hiragana; the player has to select the correct responses in order to progress in the battle. As the player progresses with the storyline they learn vocabulary, punctuation, and the proper responses within the Japanese language. Little research has been done as to teachers’ perceptions of games and Gamification for language learning. Of the few studies, Baek (2008)
looked at teachers’ inhibitions and hindrances towards their use of games in the classroom. Teachers’ responses to the survey led Baek (2008) to opine several factors which limited the teachers, such as “inflexibility of current curricula” (p. 666), “teachers believe that games have negative effects and may harm students learning”, “teachers think students behave differently while gaming”, “lack of supporting materials”, and “teaching with games requires expanded costs” (p. 668).
Issues Present in CAI and CALL
Not everyone was enamored with the use of computers for language instruction. Proponents of CAI and CALL had some push-back when it came to implementation into their own language programs. Olsen (1980) published research concerning instructors’ and language departments’ views of CAI and CALL. That research survey identified issues about CAI and CALL and why language departments felt discouraged to integrate computers into their current curriculums. Some of the issues pertained to a high cost of technology both for the hardware and software, limited access to terminals, lack of funding, and a lack of knowledge pertaining to computers and software (Olsen, 1980). While some of the statements and reasoning were merely based on impressions, prejudice, and uninformed opinion, they also held fact within them as well. Some instructors and language programs held a fear that a human instructor would be replaced or the technology could even erode their current position. Olsen’s (1980) study pointed out a real lack of technical knowledge; even programs that are complete “require modification to suit local needs” (p. 343). At this point in time, modifications required knowledge of computer programming as well, which would entail further teacher training. Some of the commenters who
were proponents of CAI pointed out though that microprocessors are gaining some traction and the days of centralized computing systems with terminals may be numbered (Olsen, 1980).
Despite today’s advances in technology, some of the past issues still exist today.
Utilizing the Delphi method to properly identify what an optimal classroom needs for technology integration, Dillon-Marable & Valentine and their expert panel found four classroom
characteristics needed (2006). The Delphi method entails selecting a panel of experts and having them answer a series of questions. From that point, the researcher acts as a moderator, compiles the information from each of the experts, and provides an anonymous summary of the findings back to the expert panel (Dillon-Marable & Valentine, 2006). After the panel reviews the findings, each expert is presented with another series of questions, while bearing in mind the answers from other members of the panel reported anonymously (Dillon-Marable & Valentine, 2006). This method is utilized because the expert panel’s answers will gradually form a relative consensus toward a correct answer (Dillon-Marable & Valentine, 2006). The characteristics outlined included that a classroom with computer use needed to be “seamless” when moving between mediums such as books, computers, and discussions (p. 106). In essence, a classroom needs to take advantage of how every-day life has now integrated technology. Other
characteristics found by Dillon-Marable and Valentine’s (2006) Delphi study included a
classroom in which computer use is appropriate, computer use is facilitated, and computer use is empowering (p. 108). This called for greater integration of technology into the classrooms.
Prensky (2001) defined students in this technological age as “Digital natives”. Prensky argued that individuals that have grown up with technology such as computers, the internet, and video games may, in fact, be more technologically knowledgeable than their instructors. Many
feel that instructors have to take the difference between the language and culture of themselves and their students into mind when developing a classroom with integrated technology. However, dissent is common in reference to Prensky’s description and definition of Digital Natives and Digital Immigrants. Apostolos Koutropoulos’ (2011) article pointed out that Prensky and others who use the digital immigrant and digital native mindset are overgeneralizing traits of digital natives. Some of these overgeneralizations fail to take into account that individuals’ minds and thought processes do not imprint at a certain time and date, but instead continually evolve and adapt to fit their surroundings (Koutropoulos, 2011). Not only do some feel that labeling students and instructors as overgeneralizing but also failing to take into account certain factors that may affect students’ use of technology. Factors include the socioeconomic status of the students, whether they come from an underdeveloped country or culture, the degree of use of technology, how the tools and technology are used, and how the skills and behaviors learned would transfer over into an educational setting (Koutropoulos, 2011).
Some of the major disadvantages of early CALL actually still exist today. The financial obligation to both the school and the student is one such disadvantage. Language programs are moving to where computers have become a basic requirement. This can act as a barrier for schools with an inadequate budget or even students who have a relatively low-income (Lai & Kritsonis, 2006). Students and instructors both can lack the computer or technological literacy needed to effectively take advantage of programs and software available (Lai & Kritsonis, 2006; Tan & McWilliam, 2009). In their research, Tan and McWilliam (2009) found that despite user-friendliness and introduction to common web based tools and technologies, “the teachers to
whom the technologies were being demonstrated were struggling to see how they operated, let alone how they might be incorporated” (p. 222).
This could possibly relate back to Prensky’s (2001) theory that today’s students are “digital natives” having grown up with today’s technology while today’s instructors are better defined as “digital immigrants” who have not benefited from being immersed in technology from an early age, but have instead grown accustomed to it. It could also simply be a symptom of inadequate training of teachers on current and new technological systems implemented in the classroom. It is important to note that some of the teachers in Tan and McWilliam’s (2009) study were concerned with programs that may require too much (technologically) from disadvantaged migrants in order to guard against failure. Yet, the students referred to in the study were observed using current technology such as iPods to transfer and share music between each other within their first language.
This difference in technological culture adds a barrier to the learning process and could even be defined further as differences in technological accents; such as printing off emails (Prensky, 2001). The “digital immigrants” can retain prior knowledge and practices from earlier technologies that act as technological communicative barriers between themselves and their students. Perhaps supported and seen within Murray’s (2008) research that found that teachers tend to limit their use of technologies to emails, web searches, word processing, and PowerPoint presentations. However, many of the learners were unfamiliar with these technologies and teachers found they needed to also teach the learners computer and electronic literacy as well. In fact, teachers were often “ignorant of the factors that increase or decrease readability of
webpages” and did not take those facts into account when selecting websites for learners. Instead they focused solely on the objectives outlined in their curriculum (p. 27).
Additionally, some schools still hold to old ideals and cultures related to technological use within the classroom. This “rigidity of a school’s programming” (p. 222) and its “long term entrenched educational culture in paper- based [learning]” (p. 219) act as a barrier (Tan & McWilliam, 2009). Indeed, education institutions and instructors tend to hold out on
incorporating new technologies and theories for fear of failure. Students in Murray’s (2008) research had similar struggles in which they typically felt an inner conflict between being “digital students” and “diligent students”. Tan and McWilliam’s (2009) paper echoes the
sentiments held in Murray’s research. Students often took the safer route in learning and instead opted to “guard against failure rather than look for innovative ways,” (p. 219) to produce
language skills and expand their own personal capacities (Tan & McWilliam, 2009). Likewise, one instructor in Wray et al’s (2008) study reported “in online I get a lot more students who are hesitant in their answers in the questions I pose.” (p. 246).
Another issue that exists within the educational community is perhaps best outlined in Larry Cuban’s book Oversold and Underused: Computers in the Classroom. In the book, Cuban described one institution, in this case Stanford, who invested millions of dollars for a fully furnished television studio that was “State of the Art” as well as a large group instruction room. In the case of the large group instruction room, students each had control panels at their desk in which they could manually depress buttons to answer yes, no, or a particular number in answer to a professor’s question (Cuban, 2001). However, Cuban found that in essence the button on the student desks acted as a mere gimmick in which it was grossly underutilized. In fact, when it
was in use, professors used it mainly as a means to check the pulse of the class and ensure that material was not being covered overly fast. This multimillion dollar investment was outdated, and mainly unused in less than 10 years from its initial build. When researching what caused the facility to decline and be underutilized, Cuban found through communications with staff and faculty that few, if any, were a part of the design process, and that a very minor amount of the staff actually used the technology when it was available and running (Cuban, 2001). In essence, the administration spent all of this time and money on what they saw as a “state of the art” facility, and then told the faculty to use it. However, when it came to the faculty, no training was provided, the initial support staff that was hired on for the equipment was soon let go due to budgetary issues, the technology often broke down, and the technology quickly became outdated (Cuban 2001).
The Three Philosophies
Since the 1960s, the use of CALL and research performed can roughly be divided into three philosophies in which Warschauer and Healey (1998) term: Behavioristic CALL,
Communicative CALL, and Integrative CALL. There are definite overlaps in each of the three schools of thought, but typically they followed the technology available at the time starting with Behavioristic CALL. Behavioristic CALL started around the 1950s, continued on into the 1970s, and followed the behaviorist learning model where language learning and CALL focused on “drill-and-practice” (Warschauer & Healey, 1998). The computer was seen as more of a tutoring tool and ran on the most well-known system at the time PLATO (a mainframe based computer).
As times changed, so did technology and theories concerning language learning. In the late 1970s, and early 1980s, Communicative CALL emerged. Communicative CALL, as outlined by Warschauer & Healey (1998), held to the mindset that the CALL activities “should focus more on using forms than on the forms themselves,” as well as “teach grammar
implicitly,” and “encourage students to generate original utterances rather than manipulate prefabricated sentences” (p. 57). This was directly tied to cognitive theories at the time that promoted learning as a “process of discovery, expression, and development” (p. 57). In this time period, Communicative CALL was focused more on the use of the personal computer.
However, despite many feeling that Communicative CALL was a step forward from Behavioristic CALL, many felt that Communicative CALL did not take full advantage of the language learning process. Teachers began moving towards a more socio-cognitive view of the language learning process and began focusing on language learning, and its use in authentic social situations (Warschauer & Healey, 1998). This new perspective was called Integrative CALL, and came about in the early 1990s. It focused on task, project, and content based
interactions that sought to have learners use, and learn, language within authentic environments. The goal was not simply to have language learners use the technology a finite amount of time but, to instead, impress upon them the use of technological tools as an integrated component of language learning. Integrative CALL sought to take advantage of the versatility that computers had become known for and focused on the various forms of media that networked computers and the internet were able to provide.
Today’s technology use in language learning has come a long way since its inception. Computer systems are able to give immediate feedback on their performances due the
technology’s ability to analyze captured data and present its findings to students. This feedback is both essential and critical for students and instructors. However, Lai and Kritsonis (2006) point out, despite these advances, CALL is still relatively imperfect. In the realm of language learning, unexpected situations are present to which computers and technology are limited (Lai & Kritsonis, 2006). A computer cannot react to unexpected learning problems or address questions or issues that may arise with the learner as effectively, efficiently, or as timely as an instructor (Lai & Kritsonis, 2006). Lai and Kritsonis (2006) point out that only by realizing these advantages and disadvantages, that present themselves in CALL, are we able to “avoid for misemploying CALL programs and get its maximum benefits.” (p. 4). One could argue that, without instructor feedback, the advantages and disadvantages of programs could remain shrouded or even defined incorrectly. A prime example can be found in Tan and McWilliams’ (2009) instructors who felt pushing their students technological use could be detrimental, yet their students were showing their technological capacity at the same time contrary to the teachers’ misgivings. As was the case here, the instructors’ perceptions of technology in the classroom were wrong but also highlighted an issue within their classrooms and their mindsets.
It was not until the late 1970s, or early 1980s, that much thought was given to teachers’ beliefs and how they could shape and mold the classroom. In his 1979 article, Fenstermacher outlined three criticisms of research and teacher work. More specifically, Fenstermacher (1979) focused on the third kind of criticism, “apparently significant [criticism], [that] cannot be heeded because the remedy is unknown or because its implications are the shop must be closed and a new calling found.” (p. 157). He opined that much of the research conducted in education up till then (1979) relied heavily on a philosophy of science, but was inherently limited as it does not
effectively add to the understanding of research in, and on, education (Fenstermacher, 1979). His suggestion of borrowing from the social sciences to more effectively analyze classrooms, and educational systems (which are social systems), was one of the earlier suggestions and predictions that research focus on teacher beliefs in the classroom (Fenstermacher, 1979).
From then on, more educational research was conducted with a social sciences approach not merely a critical analysis of programs and their effectiveness with control and experimental groups. Researchers started looking at other factors within the social system of the classroom that could affect teaching practices. Pajares (1992) states that it is generally agreed upon the educational beliefs of teachers have a tendency to shape and guide their own personal practices. Golombek’s (1998) research echoes this statement as well in which it was pointed out that the beliefs largely determine how, and why, it is that teachers come to adopt new methods in teaching. Kadel (2005), through a review of literature, often found in order for teachers to effectively utilize technology and integrate it into the classroom, teachers must put forth an investment of time and energy, have a belief centered on the premise that what they do as teachers can affect their student outcomes (Kadel, 2005; Ertmer & Ottenbreit-Leftwich, 2014), and hold a general openness to change that technology in the classroom requires. Additionally, teachers must not only have knowledge of technology itself (Ertmer & Ottenbreit-Leftwich, 2014) but must take into account effective ways to use that technology and integrate it into their lesson plans, or vice versa, integrate their lesson plans with the technology. Teachers also generally have two competing mindsets of the classroom: teacher-centered learning and student-centered learning, which can also affect their level of technology integration in the classroom (Kadel, 2005).
However, there are issues with identifying the beliefs themselves. Pajares (1992) found that, often, teachers’ beliefs must be inferred through research. This can be seen by an example within Golombek’s (1998) research where one of the teachers, identified as “Jenny”, felt that she should correct students’ pronunciation, but also felt that such a correction could lead to the effective shut down of said student’s participation. These clashes between beliefs and practice add a sort of difficulty in which teachers, whose beliefs don’t necessarily fall in line with their typical classroom practices, must face. It also adds a difficulty for researchers as well who either observe or solicit opinions of teachers’ belief systems. That clash between belief and practice is a common one faced by teachers. However, it’s also been shown that teacher beliefs and classroom practices can, and are, influenced by other factors: the culture of the school and administration and the subject matter being taught (Ertmer & Ottenbreit-Leftwich, 2014).
Research Questions
The study will address the following research questions.
1. What do MA-TESL Graduate students report about their perceptions of computers and technology
2. What do MA-TESL Graduate students report concerning their affinity towards computers and technology?
3. What do MA-TESL Graduate students report concerning their use of computers and technology?
Chapter III: Methodology
The following chapter contains descriptions of participants who took part in the survey and interview subgroups, the instruments involved in both groups, and the procedures followed for both.
Participants
For this study, the pool of participants was students of a Midwestern university TESL Graduate Program. Some of these graduate students teach for the university as Graduate Assistants. Demographic information of the participants was collected as part of the survey. There were 15 participants who took part in the survey. For hereon forward, this group will be referred to as the “survey group.” Of these 15 participants, 4 took part in an interview on top of the questionnaire. This subgroup will be referred to as “interview subgroup.”
Survey group. There were 15 participants in the survey group. The survey was open for participation from all individuals currently enrolled in the Midwestern university MA-TESL program. All of them listed graduate school as their highest level of education, with one having previously achieved another Master of Arts in a different program. Five of the individuals reported as being from the United States and the remaining 10 reported being from the following countries: Argentina (1), El Salvador (2), Mexico (1), Moldova (1), Puerto Rico (1), Russia (1), Somalia (1), South Korea (1), and South Sudan (1). These numbers are represented in Figure I.
0 1 2 3 4 5 Argentina Mexico Moldova Puerto Rico Russia Somalia South Korea South Sudan El Salvador United States
Participants By Reported Native Country
Number of Participants per Reported Native Country
The participants ranged in age from 24 to 32 years old, with a mean of 27.667 years of age. Female participants outnumbered the males with 12 reported as female and 3 reported as male.
Table I
Demographics: Age of Participants
Youngest
Participant Oldest Participant Mean Age Standard Deviation
24 years of age 32 years of age 27.667 years of age 2.6095 years Figure I. Demographics: Native Country of Participants
12 3
Participant Gender
Female - 12
Male - 3
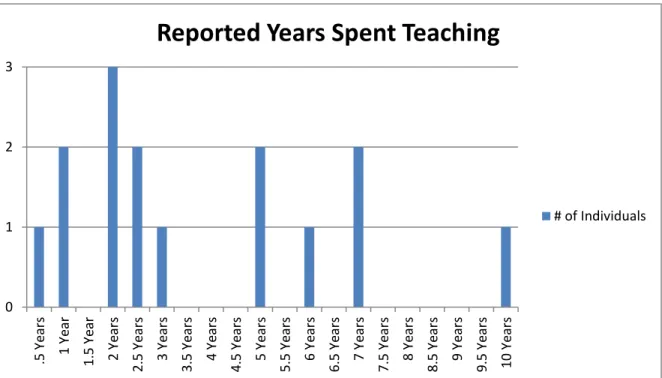
The group ranged in their prior teaching experience. The longest period of time anyone taught was 10 years, and the shortest was 6 months. The mean of years spent teaching was 3.76 years with a standard deviation of 2.76. Figure III shows the dispersal of the participants based on how many years they reported teaching. As can be seen, the one participant who taught 10 years is a definite outlier and aids in the large standard deviation.
For the participants, the years reported as using a computer had a maximum of 20 years and a minimum of 9, with an overall mean of 17 years of computer use, and a 3.84 standard deviation. Internet use was nearly identical with a maximum of 20 years and a minimum of 9. However, the mean number of years using the internet was slightly lower with 15.93 years of internet use and a standard deviation of 3.51.
Table II
Demographics: Computer and Internet Use (in Years)
Maximum Minimum Mean Standard Deviation
Lifetime Computer Use 20 9 17 3.84
Lifetime Internet Use 20 9 15.93 3.51
0 1 2 3 .5 Y ear s 1 Y ear 1.5 Y ear 2 Y ear s 2.5 Y ear s 3 Y ear s 3.5 Y ear s 4 Y ear s 4.5 Y ear s 5 Y ear s 5.5 Y ears 6 Y ear s 6.5 Y ear s 7 Y ear s 7.5 Y ear s 8 Y ear s 8.5 Y ear s 9 Y ear s 9.5 Y ear s 10 Y ear s
Reported Years Spent Teaching
# of Individuals
Figure IV. Demographics: Years of Computer Use
Figure V. Demographics: Years of Internet Use 0 1 2 3 4 5 6 7 8
Number of Indviduals Reported Computer Use
Reported Time Using a Computer (In Years) 0 1 2 3 4 5 6 7
Reported Time Using Internet(In Years)
Reported Time Using Internet (In Years)
4 3 2 2 1 1 0 1 2 3 4 5 Spanish English English/ Somali Russian Hmong Korean
Reported First Language
Number of Participants Participants were asked what they reported as their first language. Figure VI shows the breakdown of participants’ first language. Spanish was the most common first language with 4 reported participants. English was the next first language with 3 reported participants closely followed by two participants who marked English/Somali as their first language. Since both marked English/Somali as their first language and there are bilingual homes, it was decided to consider this as its own first language.
Interview subgroup. Each of the 15 survey participants was invited to take part in the interview. Out of the 15 participants, 4 volunteered to take part in the interview. Three participants of the interview subgroup were female and the other participant male. No identifying information was collected however; there is a possibility that by matching
interviewee with their survey identifying factors could be present. Therefore, in order to protect Figure VI. Demographics: Participants’ First Language
participant anonymity, no further demographics were collected outside of the interview questions. Their surveys were not collated with their interviews as well. Participants of the interview subgroup are identified as: Participant 1, Participant 2, Participant 3, and Participant 4.
Instruments
Survey. The 15 participants all took a paper-based survey. An identical digital based survey was offered as well to online students but saw zero returns. The survey can be found in Appendix I.
The survey is broken down into three sections. Section I focused on the collection of demographic information through 11 open questions and 5 closed Yes/No questions. The information collected included country of origin, gender, age, highest level of education, years spent teaching, years of computer use, years of internet use, computer access in home, internet access in home, familiarity with CALL, interest in CALL, and utilization of CALL in their classroom.
Section II was comprised of two closed yes/no questions as well as 4 open questions pertaining to participants’ possible prior use of a computer to learn a language. This was included as not all individuals within the MA-TESL program at the Midwestern University are native English speakers. Even if English is their native language, participants may have used some form of CALL to aid them in the acquisition of another language. This could conceivably alter their perceptions and/or use of CALL in their own classrooms as instructors.
Section III consists of 94 Likert questions that participants marked their answer as 1-6 with: 1=Strongly Agree, 2=Agree, 3=Slightly Agree, 4= Slightly Disagree, 5= Disagree, 6=Strongly Disagree. Within Section III, the questions can be attributed to three different
categories: Perception of computers and technology, instructor affinity for computers and technology, and instructor’s use of computers and technology in the classroom. Each question has a positive and negative phrasing to aid accuracy. The questions comprised of 47 positively phrased, and their matching 47 negatively phrased counterparts. This was done to reduce acquiescent bias and to reduce extreme response bias. Acquiescent bias is when an individual tends to agree to all statements; in the case of this survey it would be 1 or 2. Extreme response bias is when participants only answer at the extreme ends of each spectrum, in the case of this survey, 1 or 6. Questions were placed randomly so the positive and negative phrasings to each question are not situated one after the other.
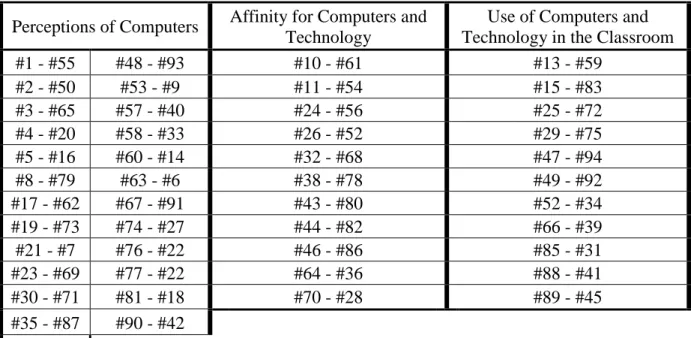
The following table matches the positive and negative questions with each other, as well as sorts the paired questions to the category they belong.
Table III
Positive & Negative Paired Questions Sorted by Category
Perceptions of Computers Affinity for Computers and Technology
Use of Computers and Technology in the Classroom
#1 - #55 #48 - #93 #10 - #61 #13 - #59 #2 - #50 #53 - #9 #11 - #54 #15 - #83 #3 - #65 #57 - #40 #24 - #56 #25 - #72 #4 - #20 #58 - #33 #26 - #52 #29 - #75 #5 - #16 #60 - #14 #32 - #68 #47 - #94 #8 - #79 #63 - #6 #38 - #78 #49 - #92 #17 - #62 #67 - #91 #43 - #80 #52 - #34 #19 - #73 #74 - #27 #44 - #82 #66 - #39 #21 - #7 #76 - #22 #46 - #86 #85 - #31 #23 - #69 #77 - #22 #64 - #36 #88 - #41 #30 - #71 #81 - #18 #70 - #28 #89 - #45 #35 - #87 #90 - #42 #37 - #84
Interview. Individuals who participated in the survey were invited to take part in an interview. It was a semi-structured interview comprised of 6 questions which can be referenced in Appendix III. An interview was chosen for two different reasons. First, due to the relatively low initial starting pool of possible candidates that took part in the survey, and secondly, it has been interesting to see unsolicited comments teachers and instructors have offered in previous studies and questionnaires. Due to the aforementioned unique insights, an interview was also conducted among the graduate students who took part in the survey. The addition of the interview was to allow unique insights into the classrooms and technology use within them.
Procedures
Survey. Participants were invited to take the survey at two different locations throughout a 6 day period in which the researcher reserved rooms. Instructors of the graduate students allowed the researcher access to make an announcement and disseminate information as to the title, goal, and instruments of the research thesis. When a participant entered, they were given a consent form, explained the purpose of the study, and explained the different sections of the survey. Time of completion of the survey ranged between 10-20 minutes and after completion, surveys were collected by the researcher.
Interview. Participants of the interview volunteered earlier during the survey phase of data collection. The participant sat down with the researcher and the audio was recorded on a Sony voice recorder while going over the interview questions in a semi-structured interview. Interviews ranged from 8-17 minutes and no time limit was given on participants’ answers. The semi-structured interview was chosen so that the researcher could ask follow-up questions, or ask for clarification.
Chapter IV: Results
The following chapter contains the results of this research. The chapter is broken into eight sections. The first seven sections are breakdowns of information found while compiling the data. The last section is a summary of the findings found in the research in terms of the research questions.
All 15 participants reported having computer access at home with 13 reporting they had internet access at home. Participants reported using computers and internet for a wide range of activities listed below.
Table IV
Reported Computer and Internet Use Activities by Number of Participants
Research 11 Listen to
Music 2
Online
Dictionary 1
Teaching
Resources 8 Shopping 2 Ted Talks 1
Social
Networking 8 Reading 2 Google Drive 1
Watch Videos/Movies 7 Entertainment 2 D2L 1 Typing Papers and Homework 4 Surfing the Internet 2 Blogging 1
PowerPoint 3 Education 1 Banking 1
News 3 Traveling 1 Errands 1
When asked what they use for programs, technology, and software in the classroom participants’ responses are logged in Table V. PowerPoint, with 9 responses, was the number 1 answer. The second response was “websites”. In many cases, participants actually listed off specific websites they used for teaching, but for the sake of brevity they were combined into one
category. Among the websites listed were: Ted Talks, Blackboard & Learn, Crossword Generator, Kahoot, and Prezi. YouTube was not added into this list. While technically a website, it is generally for audio and video.
Table V
Reported Technology Participants Used in their Classroom
PowerPoint 9 Media Player 3 Smartboard 1
Websites 8 Textbook
Companion 2 CD’s 1
D2L 8 Computer 2 iPad 1
YouTube 5 Projector 2 Speaker 1
Microsoft
Office 5 Audacity 2 Adobe 1
Internet 4 Blackboard
Learn 1 Blogs 1
Google Docs 3 Songs 1
In an effort to gauge their interest and knowledge of the topic, participants were asked if they were familiar with the term CALL (Computer Assisted Language Learning), if they were interested in CALL, and if they utilize CALL in their classroom. Of the participants, 10 were familiar with the term, 14 were interested in it, and 10 reported utilizing CALL in their classroom. Additionally, participants were asked if they have used a computer in the past to learn a language with 11 confirming prior computer use for language learning. The number of participants per reported language follows in Table VI.
Table VI
Participant Reported Languages Learned with a Computer
Participant Reported Languages Learned with a Computer
English 5 Thai 1
Arabic 3 Czech 1
French 3 German 1
Spanish 2
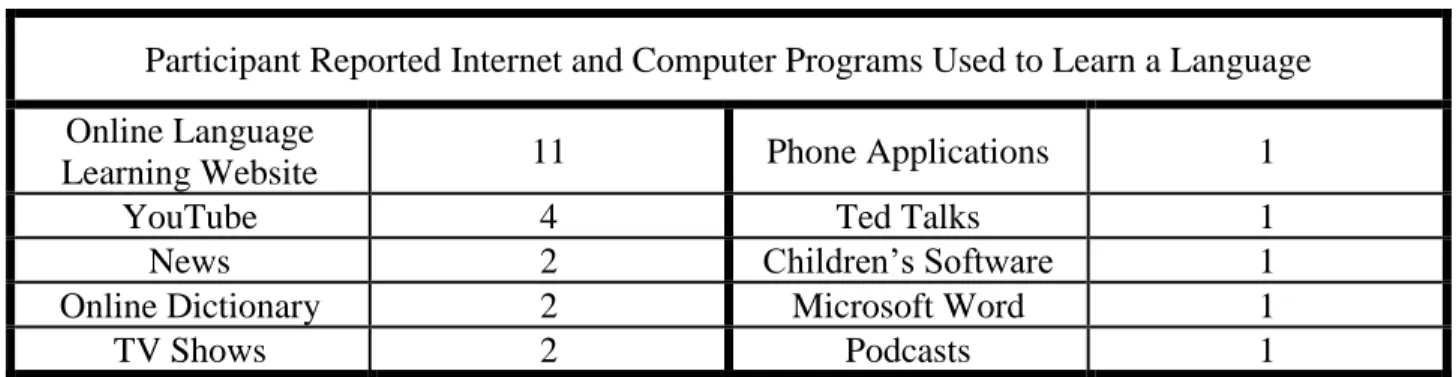
Table VII shows the number of participants per reported internet and computer program that was utilized to learn a language.
For the sake of brevity, Table VII was condensed down into similar categories. For instance, Online Language Learning Websites varied based on which language the participants were learning. Participants listed off the following sites for Online Language Learning
Websites: Goldstone, Rosetta Stone, Madinah Arabic, Language Avatar, Duo Lingo, Mango, Live Mocha, learnquran.com, and Lingua Leo. Of interest, each of the four individuals that listed YouTube mentioned watching the videos with Closed Captioning turned on in order to help them learn a language.
Table VII
Internet and Computer Programs Used to Learn a Language
Participant Reported Internet and Computer Programs Used to Learn a Language Online Language
Learning Website 11 Phone Applications 1
YouTube 4 Ted Talks 1
News 2 Children’s Software 1
Online Dictionary 2 Microsoft Word 1
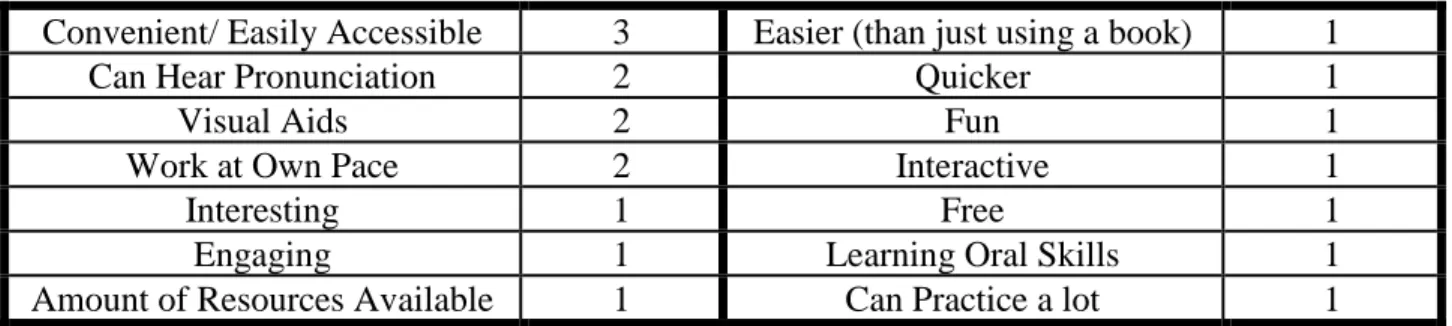
Of those 11 who reported having used a computer to learn a language, 9 of them reported enjoyment while doing so. Table VIII shows how many participants reported, and what they reported, enjoying about using computers and technology to learn a language.
Table VIII
What Participants Reported Enjoying While Using Computers and Technology to Learn a Language
Convenient/ Easily Accessible 3 Easier (than just using a book) 1
Can Hear Pronunciation 2 Quicker 1
Visual Aids 2 Fun 1
Work at Own Pace 2 Interactive 1
Interesting 1 Free 1
Engaging 1 Learning Oral Skills 1
Amount of Resources Available 1 Can Practice a lot 1
Table IX shows how many participants reported, and what they reported, about what they did not enjoy when using computers and technology to learn a language.
Table IX
What Participants Reported Not Liking about Using Computers or Technology to Learn a Language
Technical Difficulties 3 Tedious Repetition 1
Prefer Face-to-Face Interaction 2 Lack of Focus on Specific
Areas 1
No Way to Know if
Pronunciation is Correct 2 Non-linguistic Focus 1
Eyes tire 1 No Accountability 1
Shorter Retention 1 No Communication 1
Too Much Time Spent Online 1 Strictly Receptive Skills not
Productive 1
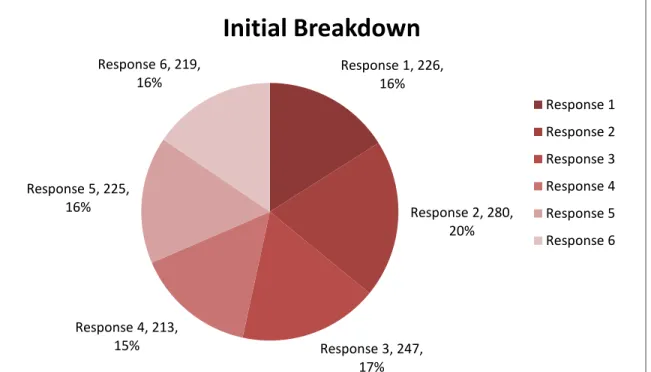
Prior to reverse weighting the negative phrased questions, the number of times
individuals selected a specific response are listed below in Figure VII. This was done to see if the participants had relatively even distribution across their responses. As can be seen, the responses are relatively balanced with Response 2 (Agree) having a slightly larger share of the number of responses.
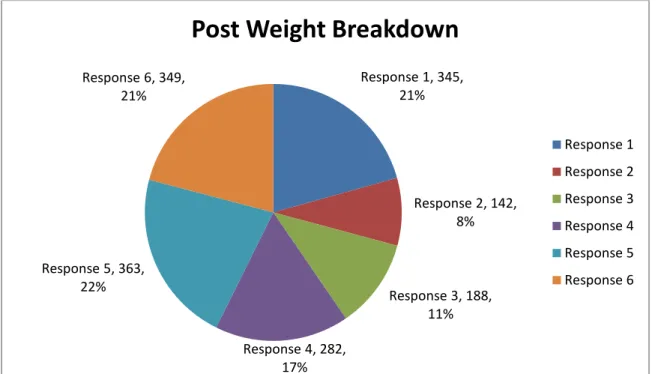
After the negative answers were switched for weighting, the number of times individuals selected specific answers is shown in Figure VIII. The negatively phrased questions were reverse scored. The mean score between the positive and newly weighted negative phrased
Response 1, 226, 16% Response 2, 280, 20% Response 3, 247, 17% Response 4, 213, 15% Response 5, 225, 16% Response 6, 219, 16%
Initial Breakdown
Response 1 Response 2 Response 3 Response 4 Response 5 Response 6questions were then calculated. This shows that Response 5 (Disagree) was the most commonly selected answer on the Likert Scale, covering 22% of the answers from Section III.
This was closely followed by a 21% selection of both Response 6 (Strongly Disagree) and 21% selection of Response 1 (Strongly Agree).
Participants’ responses to each question of the pair were averaged, and then those responses were compiled together with the rest of the participants’ responses in order to get an aggregate mean of the response per category in terms of Perceptions of Computers and
Technology, Affinity for Computers and Technology, and Use of Computers and Technology in the Classroom. As mentioned earlier the scores were on a 6-point Likert where: 1=Strongly Agree, 2=Agree, 3=Slightly Agree, 4= Slightly Disagree, 5= Disagree, 6=Strongly Disagree. In Figure IX, a mean score of less than 3.5 indicates a general positive agreement of the positive
Response 1, 345, 21% Response 2, 142, 8% Response 3, 188, 11% Response 4, 282, 17% Response 5, 363, 22% Response 6, 349, 21%
Post Weight Breakdown
Response 1 Response 2 Response 3 Response 4 Response 5 Response 6
statements within each category. The closer to 1 (Strongly Agree) that participants reported, indicated the stronger level of agreement they had with the statement. The closer to 6 (Strongly Disagree) that participants reported, indicated the stronger level of disagreement they had with the statement.
Figure X. Mean Scores of Survey Section III per Category
Perceptions of Computers and Technology
As stated earlier, the overall mean response to the questions pertaining to Perceptions of Computers and Technology was 2.8 with a standard deviation of 0.42.
Table X shows (post negative weighting) participants mean score, standard deviation, and the range of the answers pertaining to participants’ perceptions of computers and technology. A single participants’ score between the paired questions was computed as a mean after reverse
2.80 2.43 2.99 1 2 3 4 5 6 Perceptions of Computers and Technology
Affinity for Computers and Technology
Use of Computers and Technology in the Classroom
Mean Score
Mean Score Strongly Disagree Strongly Agreeweighting the negatively phrased question, and then aggregate mean across all participants was computed. For example, if a participant answers question #63 with a 1 and question #6 with a 6 the score would be computed as an individual mean of 1. Standard deviation was calculated to show whether participants held a general agreement of their answers to a survey question. Range was also calculated between the answers to show differences between the max score found on a question and the minimum score as well. Range was selected due to the possibility of having a low standard deviation but a long range owed to an outlier.
Of the questions within the Perceptions of Computers and Technology category, paired questions 63 & 6 had the lowest standard deviation. In other words, participants agreed with each other more than any other question when answering this pair of questions. When
accounting for questions 6’s negative phrasing, and flipping the weighting of that question, the mean score is 2.87. Participants Slightly Agree/Agree with the positive phrasing of question 63.
Question 63: Computers and technology make lesson planning easier for teachers.
Conversely, within the Perceptions of Computers and Technology category, paired questions 74 & 27 had the highest standard deviation. In other words, participants mostly disagreed with each other when answering this pair of questions.
Question 74: I prefer the traditional face to face language class versus online language classes.
Interview question number 1 and interview question number 4 were designed to help shed some light on participants’ perceptions as well. As stated earlier, 4 participants took part in the interview section of the research and were asked to describe their personal philosophy of technology in the classroom, as well as how technologically savvy they felt they were.