Effects of Collection and Processing Procedures
on Plasma Circulating Cell-Free DNA from Cancer
Patients
Q33 Bente Risberg,*yzDana W.Y. Tsui,*xHeather Biggs,{Andrea Ruiz-Valdepenas Martin de Almagro,*xSarah-Jane Dawson,*{k Charlotte Hodgkin,5kLinda Jones,{Christine Parkinson,kAnna Piskorz,*xFrancesco Marass,*xDineika Chandrananda,*x Elizabeth Moore,*xJames Morris,*xVincent Plagnol,**Nitzan Rosenfeld,*xCarlos Caldas,*x{k James D. Brenton,*xkand Davina Gale*x
Q1
Q2 Q3From the Cancer Research UK Cambridge Institute,* Li Ka Shing Centre, Robinson Way, University of Cambridge, Cambridge, United Kingdom; the Department of Cancer Genetics,yInstitute for Cancer Research, and the Department of Pathology,zOslo University Hospital, Norway; the Cancer Research UK Major Centre,xCambridge, United Kingdom; the Cambridge Breast Unit{and the Department of Oncology,kCambridge University Hospitals NHS Foundation Trust, Addenbrooke’s Hospital, Cambridge, United Kingdom; and the UCL Genetics Institute,** University College London, London, United Kingdom
Accepted for publication July 26, 2018.
Address correspondence to Dana W.Y. Tsui or Davina Gale, Cancer Research UK Cambridge Institute, Robinson Way, Cambridge CB2 0RE, United Kingdom
Q8 . E-mail:
[email protected]. [email protected].
Circulatingtumor DNA (ctDNA) offers new opportunities for noninvasive cancer management. DetectingQ9
ctDNA in plasma is challenging because it constitutes only a minor fraction of the total cell-free DNA (cfDNA). Pre-analytical factors affect cfDNA levels contributed from leukocyte lysis, hence the ability to detect low-frequency mutant alleles. This study investigates the effects of the delay in processing, storage tempera-tures, different blood collection tubes, centrifugation protocols, and sample shipment on cfDNA levels. Peripheral blood (nZ231) from cancer patients (nZ62) were collected into K3EDTA or Cell-free DNA BCT
tubes and analyzed by digital PCR, targeted amplicon, or shallow whole-genome sequencing. To assess pre-analytic effects, plasma was processed under different conditions after 0, 6, 24, 48, 96 hours, and 1 week at room temperature or 4C, or using different centrifugation protocols. Digital PCR showed that cfDNA levels increased gradually with time in K3EDTA tubes, but were stable in BCT tubes. K3EDTA samples stored at 4C
showed less variation than room temperature storage, but levels were elevated compared with BCT. A second centrifugation at 3000 ggave similar cfDNA yields compared with higher-speed centrifugation. Next-generation sequencing showed negligible differences in background error or copy number changes be-tween K3EDTA and BCT, or following shipment in BCT. This study provides insights into the effects of sample
processing on ctDNA analysis.(J Mol Diagn 2018,-: 1e11;https://doi.org/10.1016/j.jmoldx.2018.07.005)
Supported by Cancer Research UK, University of Cambridge grants A15601 (J.D.B.), A11906 (N.R.), A20240 (N.R.), and A18072 (J.D.B.), National Institute for Health Research, Cambridge Biomedical Research Centre and Cambridge Experimental Cancer Medi-cine Centre (J.D.B.), Cambridge Experimental Cancer MediMedi-cine Centre
Q32
(J.D.B.), European Research Council under the European Union’s Seventh Framework Programme FP/2007-2013/ERC grant 337905 (N.R.), NIHR (C.P.) and Academy of Medical Sciences (C.P.), the Wellcome Trust (C.P.), British Heart Foundation (C.P.), Arthritis Research UK (C.P.), and an Australian National Breast Cancer Foundation and Victorian Cancer Agency Early Career Fellowship (S.-J.D.)
Q4 Q5
Q6 B.R., D.W.Y.T., and H.B. contributed equally to this work..
Disclosures: V.P., N.R., J.D.B., and D.G. are cofounders, shareholders, consultants, and/or employees of Inivata Ltd., a cancer genomics company
focused on ctDNA analysis; D.W.Y.T., F.M., N.R., C.C., J.D.B., and D.G. are co-inventors or contributors on a patent describing methods for analysis of rare DNA fragments; N.R. has received research support from AstraZeneca.
The funders had no rolein study design, data collection and analysis,Q7 decision to publish, or preparation of the manuscript.
Current address of D.W.Y.T., Department of Pathology, Center for Molecular Oncology, Memorial Sloan Kettering Cancer Center, New York, NY; of S.-J.D., Division of Research and Cancer Medicine, Peter MacCallum Cancer Centre, Melbourne, VIC, Australia; of F.M., Department of Biosystems Science and Engineering, ETH Zurich, and SIB Swiss Institute of Bioinformatics, Basel, Switzerland; and of V.P., Inivata Ltd., The Portway Building, Granta Park, Cam-bridge, UK. jmd.amjpathol.org 1 2 3 4 5 6 7 8 9 10 11 12 13 14 15 16 17 18 19 20 21 22 23 24 25 26 27 28 29 30 31 32 33 34 35 36 37 38 39 40 41 42 43 44 45 46 47 48 49 50 51 52 53 54 55 56 57 58 59 60 61 62 63 64 65 66 67 68 69 70 71 72 73 74 75 76 77 78 79 80 81 82 83 84 85 86 87 88 89 90 91 92 93 94 95 96 97 98 99 100 101 102 103 104 105 106 107 108 109 110 111 112 113 114 115 116 117 118 119 120 121 122 123 124
C
Q10 irculating tumor DNA (ctDNA) in plasma offers new opportunities for noninvasive cancer management. Recent studies have demonstrated its potential for molecular strat-ification, monitoring tumor response, identifying resistance mutations, and patients at risk of relapse.1,2 Detecting ctDNA in plasma is challenging because it constitutes only a minor fraction of the total cell-free DNA (cfDNA), partic-ularly in early-stage cancers and in the minimal residual disease setting.3,4 A proportion of background wild-type DNA is believed to originate from lysis of white blood cells.5 Previous studies have highlighted the pre-analytic effects of different processing and collection protocols on plasma ctDNA levels from cancer patients and pregnant women.6e9On the basis of these results, it is recommended to process whole-blood samples for retrieval of plasma as soon as possible after collection, beforein vitrocell lysis. At the same time, a double-centrifugation protocol has been recommended to obtain cell-free plasma, using an initial slow centrifugation speed to separate plasma, then fast centrifugation to clear cellular material.7However, some of these procedures may be difficult to perform in a clinical setting due to lack of appropriate personnel or equipment. To circumvent this, cell-stabilizing blood collection tubes have become available to stabilize cfDNA, enabling a delay in processing, which may be done under more controlled conditions and within centralized laboratories. This study performed a systematic comparison of the effects of different processing protocols and collection tubes on the levels of cfDNA and ctDNA from cancer patients using digital PCR (dPCR). With the growing use of next-generation sequencing (NGS) for the analysis of ctDNA, the effect of different protocols and collection tubes on the performance of targeted amplicon and shallow whole-genome sequencing (sWGS) for quantification of plasma DNA was also investigated.
Materials and Methods
Analysis Modules
The study was designed to include five different modules: Module 1 investigated the effects of delayed processing on the levels of circulating DNA (cfDNA and ctDNA) in plasma collected in K3EDTA tubes (9 mL S-Monovette;
Sarstedt, Nümbrecht, Germany
Q11 ). The separation of plasma
was delayed for different durations: 0, 6, 24, 48, and 96 hours, and 1 week at room temperature
Q12 (19C to 25C).
Module 2 investigated the effects of storage temperature on the levels of circulating DNA in plasma collected in K3EDTA tubes. Samples were stored at room temperature
or at 4C before processing at the following hours post-collection: 0, 24, 48, and 96 hours. Module 3 investigated the effects of collection devices on the levels of circulating DNA. Blood samples from each patient were collected at the same time point into K3EDTA tubes and cell-stabilization
blood collection tubes (10 mL Cell-Free DNA BCT;
Streck, La Vista, NE), respectively. BCTs contain a proprietary formaldehyde-free preservative that stabilizes nucleated blood cells preventing the release of genomic DNA.10,11 The samples were processed at the following times post-collection: 0, 96 hours, and 1 week. Module 4 investigated the effects of different centrifugation protocols on the levels of circulating DNA. Module 5 investigated the effects of shipment on samples collected in BCT tubes at ambient temperature. For modules 1, 2, 3, and 5, plasma was separated from blood using a double-centrifugation protocol (protocol A): a first centrifugation at 820g for 10 minutes in a mega-centrifuge (Thermo Sorvall Legend RT; Thermo Fisher Scientific, Waltham, MA), then subjected to a second centrifugation step of the plasma supernatant at 14,000 g for 10 minutes in a benchtop micro-centrifuge (Heraeus Fresco 21; Thermo Fisher Scientific). For module 4, blood aliquots from the same patients were processed with three different protocols: protocol A as above, protocol B with thefirst centrifugation performed at 1600 g and the second centrifugation at 14,000gfor 10 minutes in a bench top micro-centrifuge, and protocol C with both first and second centrifugations performed in the same mega-centrifuge, initially at 1600gfor 10 minutes, then at 3000gfor 10 minutes.
Patient Samples and DNA Extractions
Peripheral whole blood was collected from 62 patients in total: 47 patients with high-grade serous ovarian cancer and 15 patients with metastatic breast cancer. Informed consent was obtained from each patient with protocols approved by an institutional ethics committee. Fifteen to 30 mL blood from each patient was processed according to each analysis module. DNA from all samples, except module 5, was extracted from an average 1.4 mL (range, 0.3 to 2.76 mL) plasma using the QIAamp Circulating Nucleic Acid Kit (Qiagen, Hilden, Germany) according to the manufacturer’sQ13 protocol, except that 6.2mg of carrier RNA was added per sample. DNA was eluted twice through the column to maximize yield. A nonhuman spike-in PCR product was added to each sample as an internal quality control to assess extraction efficiency.12 In module 5, DNA was extracted from plasma on a QIAsymphony robot (Qiagen) using a 2-mL extraction protocol. Eluted DNA was stored at20C until analysis.
A total of 231 blood samples aliquots were analyzed in this study. Table 1 summarizes the number of plasma ½½T1T1
samples collected for each module. Note that the collection was designed in such a way that each sample from every processing condition (temperature, collection tube, delayed processing duration) had a matched sample that was collected in K3EDTA and processed immediately (denoted
E.RT.0h) using centrifugation protocol A, and was assigned as the reference sample for each condition. The levels of circulating DNA (either cfDNA or ctDNA), were expressed as a ratio of the respective data with the reference sample 125 126 127 128 129 130 131 132 133 134 135 136 137 138 139 140 141 142 143 144 145 146 147 148 149 150 151 152 153 154 155 156 157 158 159 160 161 162 163 164 165 166 167 168 169 170 171 172 173 174 175 176 177 178 179 180 181 182 183 184 185 186 187 188 189 190 191 192 193 194 195 196 197 198 199 200 201 202 203 204 205 206 207 208 209 210 211 212 213 214 215 216 217 218 219 220 221 222 223 224 225 226 227 228 229 230 231 232 233 234 235 236 237 238 239 240 241 242 243 244 245 246 247 248
(E.RT.0h). Therefore, data collected under the same pro-cessing conditions could be grouped together to evaluate the effect of the processing even though they were collected from different patients. A more detailed summary of the distribution of samples involved in each module is given in
Supplemental Table S1.
Quanti
fi
cation of Circulating Plasma DNA by dPCR and
Targeted Amplicon Sequencing
Plasma samples from ovarian and breast cancer patients were first quantified by dPCR (using the Biomark micro-fluidic system (Fluidigm
Q14 , South San Francisco, CA) as
previously described,13using an assay that targets a 65-bp amplicon in RPP30, a nonamplified region in the genome, to estimate cfDNA levels.12,14 ctDNA levels were then determined by dPCR using dual-labelled patient-specific TaqMan assays designed to mutant and wild-type sequences
inTP53 orPIK3CA, or deletions in chromosome 8, 11, or
17. A summary of the samples analyzed is provided in
Supplemental Table S1, and sequences of primers and fluorescent probes, amplicon sizes, and amplification con-ditions used in dPCR are detailed inSupplemental Table S2. The levels of cfDNA and ctDNA were calculated from the number of observed amplifications above a set threshold, and Poisson statistics were used to convert the number of observed amplifications to estimated targets, assuming independent segregation of DNA molecules into the microfluidic reaction chambers. The total number of amplifiable copies of DNA molecules per mL of plasma (copies/mL) were calculated, taking into account the relative fraction of the extracted DNA loaded and the proportion of sample lost during the loading process through the micro-fluidic channels. The levels of ctDNA were calculated as mutant allele fraction (ie, the fraction of mutant DNA copies divided by the total cfDNA copies) expressed as a percentage or as mutant copies/mL plasma. For the purpose of comparing different protocols in the modules, the data are
expressed at each processing condition as a ratio from the E.RT.0h reference sample that was collected in K3EDTA
and immediately processed according to protocol A, unless otherwise specified.
To investigate the effects of different collection devices and processing protocols on the performance of NGS, plasma samples from all modules were analyzed by Tagged Amplicon deep sequencing (TAm-Seq), as previously described.13 TAm-Seq is a targeted amplicon sequencing method that allows identification and quantification of low-frequency mutant alleles in plasma across sizable genomic regions. Sequencing was performed using an Illumina HiSeq 2500 sequencer (Illumina, San Diego, CA) to anQ15 average of greater than 1000sequencing depth. Mutations were identified and quantified as previously described.13To assess the effect of collection and processing procedures on the background error rates during NGS, the allelic read ratio (reference/alternative) was generated at each position within R software version 3.1.215 from the BAM files, using theQ31 Bioconductorsoftware packages Rsamtools and Biostrings.Q16 All positionsflagged as polymorphic by the 1000 Genomes Project (http://www.internationalgenome.org, last accessed)Q17 or the COSMIC database (https://cancer.sanger.ac.uk/
cosmic, last accessed), werefiltered out.
To investigate the effects of shipping on global somatic copy number alterations, samples in module 5 were also subjected to sWGS.16Briefly, a DNA library was prepared from 2 to 10 ng of cfDNA from each sample using the ThruPLEX DNA-seq Kit (Rubicon Genomics, Ann Arbor,Q18 MI) and sequenced on an Illumina HiSeq 4000 to 0.1average depth using single-end sequencing. Sequence data were analyzed using a pipeline that involved the following: single-end sequence reads were aligned to the human reference genome (GRCh37) using BWA-mem software version 0.7.1717 after removing any contaminant adapter sequences. SAMtools software version 1.7 (https://
sourceforge.net/projects/samtools/files/samtools/1.7) wasQ19
used to convert files to BAM format. PCR and
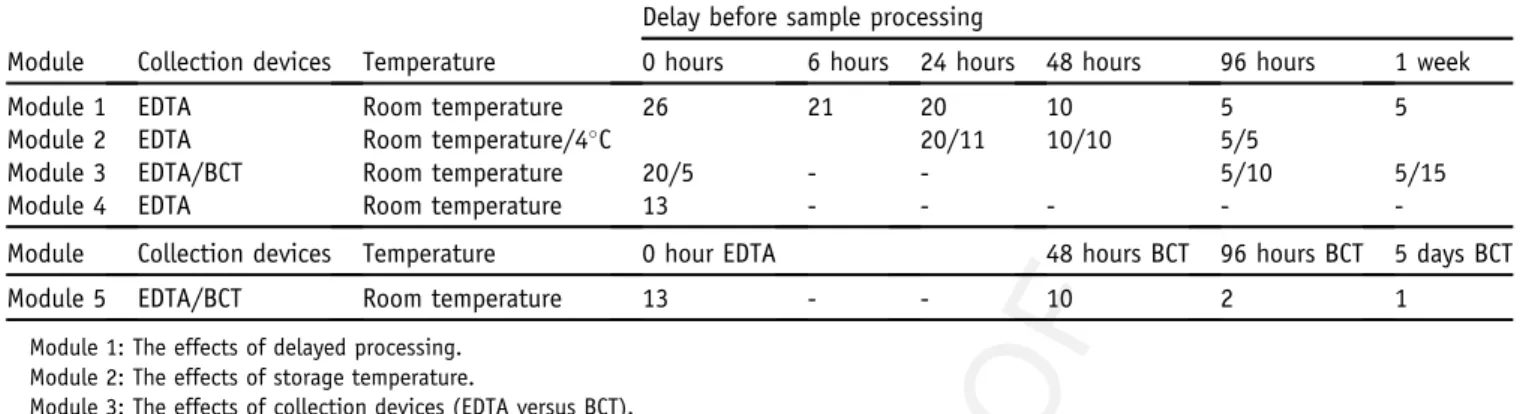
Table 1 Summary of the Number of Samples Analyzed in Each Module Q28 Q29
Module Collection devices Temperature
Delay before sample processing
0 hours 6 hours 24 hours 48 hours 96 hours 1 week
Module 1 EDTA Room temperature 26 21 20 10 5 5
Module 2 EDTA Room temperature/4C 20/11 10/10 5/5
Module 3 EDTA/BCT Room temperature 20/5 - - 5/10 5/15
Module 4 EDTA Room temperature 13 - - - -
-Module
Q30 Collection devices Temperature 0 hour EDTA 48 hours BCT 96 hours BCT 5 days BCT
Module 5 EDTA/BCT Room temperature 13 - - 10 2 1
Module 1: The effects of delayed processing. Module 2: The effects of storage temperature.
Module 3: The effects of collection devices (EDTA versus BCT). Module 4: The effects of different centrifugation speeds. Module 5: The effects of shipment in BCT.
For module 2, samples were stored both in room temperature and at 4C. 20/11 indicates that 20 tubes were stored at room temperature and 11 at 4C, and so on. 249 250 251 252 253 254 255 256 257 258 259 260 261 262 263 264 265 266 267 268 269 270 271 272 273 274 275 276 277 278 279 280 281 282 283 284 285 286 287 288 289 290 291 292 293 294 295 296 297 298 299 300 301 302 303 304 305 306 307 308 309 310 311 312 313 314 315 316 317 318 319 320 321 322 323 324 325 326 327 328 329 330 331 332 333 334 335 336 337 338 339 340 341 342 343 344 345 346 347 348 349 350 351 352 353 354 355 356 357 358 359 360 361 362 363 364 365 366 367 368 369 370 371 372
optical duplicates were marked using Picard-Tools’ Mark
Q20 Duplicates software feature version 2.17.6 (https://
broadinstitute.github.io/picard), and these were excluded
from downstream analysis along with reads of low mapping quality and supplementary alignments. Reads in each sample were down-sampled to approximately 3 million reads to have similar coverage between patients and conditions. Subsequently, copy number analysis was performed in R15 using the R package CNAclinic version 1.0 (https://github.com/sdchandra/CNAclinic, last accessed December 21, 2017; manuscript under review
Q21 ), a software
suite that allows for robust copy number analysis of sWGS data. Briefly, sequence reads were allocated into equally sized (100 Mb) nonoverlapping bins throughout the length of the genome. Read counts in each bin were corrected to account for sequence GC content and mappability, and regions corresponding to artifacts and probable germline changes were excluded from downstream analysis utilizing a cohort of 45 healthy controls. After median normalization, binned counts were segmented using both the Circular Binary Segmentatione and Hidden-Markov Modelebased algorithms, and an averaged log2R value per bin was calculated.
Statistical Analysis
The difference in circulating DNA levels between different subgroups in each module was analyzed using nonpara-metric ManneWhitney rank sum test unless specified, and
P<0.05 was considered statistically significant. To assess the noise of sWGS data, values corresponding to the median of the absolute values of all pairwise differences were calculated between log2 R copy numbers. This metric
provides a measure of the noise of the sample that is less dependent on true biological copy number variation and more on technical variation.18 To compare the three collection methods in all patients, pairwise Spearman correlations were calculated between the binned copy number segments of the three collection methods. Further-more, a nonparametric Wilcoxon signed rank test was applied on these values to test the similarity of the copy number profiles between all pairwise samples.
Results
Module 1: The Effects of Delayed Processing on the
Levels of Circulating DNA in Plasma Collected in EDTA
Tubes
In this module, all samples (n Z 26) were collected in K3EDTA tubes. One tube from each collection was
pro-cessed immediately. The other tubes were stored at room temperature and processed at different prolonged time points: 6, 24, 48, 96 hours, and 1 week. Analysis by dPCR showed that the levels of cfDNA in the plasma samples increased gradually with increasing delay in the processing
(Figure 1A), whereas the fraction of ctDNA decreased ½½F1F1
(Figure 1B). In particular, the levels of cfDNA increased significantly after 48, 96 hours, and 1 week of delay, whereas the mutant allele fraction of ctDNA decreased significantly after 96 hours and 1 week of delay (ManneWhitney rank sum test,P<0.05). Previous reports have indicated that in analysis of circulating cell-free DNA from maternal plasma, despite changes in total cfDNA, the levels of fetal DNA are relatively stable in different storage and processing conditions.8,19 Indeed, our results confirm that the numbers of mutant molecules, expressed as copies/ mL of plasma, were relatively stable across the different processing time points with no statistically significant dif-ference observed compared to samples that were processed immediately (Figure 1C and Supplemental Figure S1).
Module 2: The Effects of Storage Temperature on the
Levels of Circulating DNA in Plasma Collected in
K
3EDTA Tubes
In this module, all samples (n Z 26) were collected in K3EDTA tubes and either processed to plasma immediately
or after 24, 48, and 96 hours. The individual tubes were stored in two conditions: at room temperature (19C to 25C) or at 4C. If kept at room temperature, dPCR showed that the levels of cfDNA significantly increased after 48 hours. If kept at 4C, the levels increased after 48 hours but were significantly lower than those observed at room temperature (Figure 2A). If delayed for 96 hours, samples ½½F2F2
kept at room temperature and 4C all increased significantly. The changes in mutant allele fraction showed an inverted similar trend, although the amount of available data were too low for statistical analysis (Figure 2B).
Module 3: The Effects of Collection Devices (K
3EDTA
versus Cell-Free DNA BCT) on the Levels of Circulating
DNA
In this module, one K3EDTA tube for each collection was
processed immediately (E.RT.0h) and served as a reference sample (nZ20). The other K3EDTA tubes were stored for
96 hours (nZ5) and 1 week (nZ5) at room temperature. Cell-free DNA BCT’s were stored at room temperature and processed immediately (n Z 5) or delayed for 96 hours (nZ10) and 1 week (nZ15). The cfDNA levels increased significantly after 1 week if kept in K3EDTA tubes, but
remained at similar levels if kept in BCT (Figure 3A). The ½½F3F3
changes in the mutant allele fraction showed an inverted similar trend, but the amount of data available were too low for statistical analysis (Figure 3B). The mutant allele frac-tion from six patients that were collected in K3EDTA and
processed immediately, versus the matched samples that were collected in BCT was compared and processed after 1 week’s delay. The levels of ctDNA were similar for four patients but decreased twofold for two patient samples (Supplemental Figure S2). There was no statistically 373 374 375 376 377 378 379 380 381 382 383 384 385 386 387 388 389 390 391 392 393 394 395 396 397 398 399 400 401 402 403 404 405 406 407 408 409 410 411 412 413 414 415 416 417 418 419 420 421 422 423 424 425 426 427 428 429 430 431 432 433 434 435 436 437 438 439 440 441 442 443 444 445 446 447 448 449 450 451 452 453 454 455 456 457 458 459 460 461 462 463 464 465 466 467 468 469 470 471 472 473 474 475 476 477 478 479 480 481 482 483 484 485 486 487 488 489 490 491 492 493 494 495 496
Figure 1 The effectsof delayed processing on the levels of circulating DNA in plasma collected in K3EDTA tubes. Blood samples were collected into K3EDTAQ26 tubes and stored at room temperature for 0, 6, 24, 48, and 96 hours, and 1 week before plasma separation. Cell-free DNA (cfDNA) copies/mL plasma (A), mutant allele fraction (B).C:Circulating tumor DNA (ctDNA) copies/mL plasma in samples processed at different time of delay. The bottom and top of the box represent thefirst and third quartiles, respectively, and the band inside the box represents the median. Data are expressed as the ratio from E.RT.0h of each patient’s immediately processed K3EDTA sample. *P<0.05 versus E.RT.0h (ManneWhitney rank sum test).
497 498 499 500 501 502 503 504 505 506 507 508 509 510 511 512 513 514 515 516 517 518 519 520 521 522 523 524 525 526 527 528 529 530 531 532 533 534 535 536 537 538 539 540 541 542 543 544 545 546 547 548 549 550 551 552 553 554 555 556 557 558 559 560 561 562 563 564 565 566 567 568 569 570 571 572 573 574 575 576 577 578 579 580 581 582 583 584 585 586 587 588 589 590 591 592 593 594 595 596 597 598 599 600 601 602 603 604 605 606 607 608 609 610 611 612 613 614 615 616 617 618 619 620
significant difference in the numbers of mutant copies/mL plasma between storage in the two tube types (Supplemental Figure S1).
The effects of collection and processing procedures on the background error rates during NGS analysis were next assessed using targeted amplicon sequencing. As previously
described, different A/C/G/T base substitutions are associ-ated with different error rates.13The distribution of the ratio of nonreference/reference alleles was plotted as box plots, shown according to mutation types. No difference was observed using different collection devices and processing conditions (Figure 3C).
Figure 2 The effects of storage temperature on the levels of circulating DNA in plasma collected in K3EDTA tubes. Blood samples collected into K3EDTA
tubes were stored at room temperature and at 4C for 24, 48, and 96 hours, and 1 week before plasma was separated. Cell-free DNA (cfDNA) copies/mL plasma (A) and mutant allele (B) fraction. The bottom and top of the box represent thefirst and third quartiles, respectively, and the band inside the box represents the median. Data are expressed as the ratio from E.RT.0h of each patient’s immediately processed K3EDTA sample. *P<0.05 versus E.RT.0h (ManneWhitney
rank sum test. 621 622 623 624 625 626 627 628 629 630 631 632 633 634 635 636 637 638 639 640 641 642 643 644 645 646 647 648 649 650 651 652 653 654 655 656 657 658 659 660 661 662 663 664 665 666 667 668 669 670 671 672 673 674 675 676 677 678 679 680 681 682 683 684 685 686 687 688 689 690 691 692 693 694 695 696 697 698 699 700 701 702 703 704 705 706 707 708 709 710 711 712 713 714 715 716 717 718 719 720 721 722 723 724 725 726 727 728 729 730 731 732 733 734 735 736 737 738 739 740 741 742 743 744
Module 4: The Effects of Different Centrifugation
Speeds on the Levels of Circulating DNA
In this module, all samples (n Z 13) were collected in K3EDTA tubes and processed immediately. Aliquots
from the same patients were processed using three different centrifugation protocols (A to C) as defined in
Materials and Methods. There were no statistically
significant differences across the three protocols on the total circulating DNA levels as measured by dPCR (Figure 4
½F4
½F4 , A and B), or in mutant allele fraction as measured by targeted amplicon sequencing (Figure 4, C and D).
Module 5: The Effects of Shipment of cfDNA BCT on
Mutant Allele Fraction and Global Copy Number
Changes
In this module, three tubes of blood were drawn from each patient (n Z13). K3EDTA tubes were processed
immedi-ately (E.RT.0h), one cell-free DNA BCT was collected and stored at room temperature within the same centralized processing laboratory, whereas the other BCT was packaged and shipped back to the same laboratory. All shipped samples, apart from three, were received and processed within 48 hours from the time of collection. Of these, two BCTs were processed after 96 hours and one was processed Figure 3 The effects of collection device (K3EDTA versus BCT) on the levels of circulating DNA. Blood samples collected into K3EDTA tubes were processed
immediately, after 96 hours or 1 week at room temperature. Blood samples in BCT were stored at room temperature for 96 hours and 1 week before plasma separation. Cell-free DNA (cfDNA) copies/mL plasma (A) and mutant allele (B) fraction.C:The distributions of the ratio of nonreference/reference alleles as generated by targeted amplicon sequencing shown in boxplots. The bottom and top of the box represent thefirst and third quartiles, respectively, and the band inside the box represents the median. Data are expressed as the ratio from E.RT.0h of each patient’s immediately processed K3EDTA sample (AandB) or
log10scale (C). *P<0.05 versus E.RT.0h (ManneWhitney rank sum test).
745 746 747 748 749 750 751 752 753 754 755 756 757 758 759 760 761 762 763 764 765 766 767 768 769 770 771 772 773 774 775 776 777 778 779 780 781 782 783 784 785 786 787 788 789 790 791 792 793 794 795 796 797 798 799 800 801 802 803 804 805 806 807 808 809 810 811 812 813 814 815 816 817 818 819 820 821 822 823 824 825 826 827 828 829 830 831 832 833 834 835 836 837 838 839 840 841 842 843 844 845 846 847 848 849 850 851 852 853 854 855 856 857 858 859 860 861 862 863 864 865 866 867 868
after 5 days. The stored BCTs were processed at the same time as the matched shipped sample. There was no statis-tically significant difference in cfDNA levels between the three collection methods (Figure 5
½F5
½F5 , A and B).TP53
muta-tions were identified by amplicon sequencing in four patients, and there were no statistically significant differ-ences in mutant allele fraction using the different collection methods (Figure 5, C and D).
To further investigate the effects of collection methods on global copy number changes, sWGS analysis was performed on four patients with detectableTP53mutations (P161, P227, P479, P488) and four without (P615, P489,
P464, P450). Data from one patient (P464) were excluded from further analysis because the total read count generated for one of the collection methods was below 1 million. This is below the threshold recommended for inference when analyzing shallow coverage.20The segmental copy number profiles among the three collection methods were highly similar, showing an average Spearman correlation of 0.76, range Z 0.44 to 0.98 (Supplemental Figure S3 and
Supplemental Table S3). The paired Wilcoxon testPvalues indicated no significant differences in all 21 copy number distributions comparisons (P > 0.001). Supplemental
Figure S4 shows an example of the copy number
Figure 4 The effects of different centrifugation speeds on the levels of circulating DNA. Blood samples were collected into K3EDTA tubes and processed to
plasma with three different protocols. All protocols included two 10-minute centrifugation steps, thefirst on whole blood, and the second on plasma aliquots. Protocol A (820 and 14,000g), protocol B (1600 and 14,000g), Protocol C (1600 and 3000g). Cell-free DNA (cfDNA) copies/mL plasma (AandB) and mutant allele (CandD) fractions (%) in samples processed by different protocols. The bottom and top of the box represent thefirst and third quartiles, respectively, and the band inside the box represents the median.
869 870 871 872 873 874 875 876 877 878 879 880 881 882 883 884 885 886 887 888 889 890 891 892 893 894 895 896 897 898 899 900 901 902 903 904 905 906 907 908 909 910 911 912 913 914 915 916 917 918 919 920 921 922 923 924 925 926 927 928 929 930 931 932 933 934 935 936 937 938 939 940 941 942 943 944 945 946 947 948 949 950 951 952 953 954 955 956 957 958 959 960 961 962 963 964 965 966 967 968 969 970 971 972 973 974 975 976 977 978 979 980 981 982 983 984 985 986 987 988 989 990 991 992
alterations in plasma samples processed with and without shipping. The same gains and losses in chromosomal arms were identified in all three protocols. Supplemental Figure S5 depicts the estimation of noise in the sWGS data using values that were the median of the absolute values of all pairwise differences. All patients showed very similar noise levels between the different tubes and protocols.
Discussion
Multiple research studies have demonstrated the potential of using plasma as a tool for noninvasive cancer management. There is increasing interest in incorporating ctDNA as a liquid biopsy in both clinical and research settings. Because the frequency of mutant alleles in plasma may be low, particularly in early-stage disease, it is crucial to optimize and standardize pre-analytic sample processing procedures to maintain the quality of samples for accurate quantification of rare mutant molecules. In this study, the pre-analytic effects of blood sample processing procedures, including the use of different blood collection tubes, storage conditions, and centrifugation speeds, were examined on downstream analysis of cfDNA using different molecular technologies
including dPCR, targeted amplicon, and genome-wide sequencing. Our results show that levels of cfDNA are stable in K3EDTA tubes at room temperature for up to 24
hours. If delayed beyond 24 hours, storage of K3EDTA
blood at 4C appeared to delay the increase in background cfDNA. It is worth noting that a recent study demonstrated that storing the samples in K2EDTA tubes at 4C kept the
cfDNA levels stable for a course of 3 days.21 This agrees with the observations that storing K3EDTA tubes at 4C
improved the stability of cfDNA compared with room temperature storage. Alternatively, collection into cell-free DNA BCT tubes at room temperature maintained stable cfDNA levels for at least a week. These tubes can facilitate delayed and centralized blood processing, circumventing issues arising with delayed plasma processing. Other re-searchers have evaluated alternative cell-stabilization tubes such as CellSave (CellSearch system; Menarini SiliconQ22 Biosystems, Huntington Valley, PA) and PAXgene Blood ccfDNA tubes (Qiagen) and demonstrated similar stability when sample processing was delayed.9,22 New cell-free stabilization tubes have recently become available [eg, Cell-free DNA Collection tube (Roche, Basel, Switzerland), cf-DNA Preservation tube (Norgen Biotek, Thorold, ON, Canada), Blood STASIS 21-ccfDNA, (MagBio Genomics, Gaithersburg, MD), and LBgard Blood tubes, Biomatrica, Figure 5 The effects of shipping using cell-free DNA BCT on the levels of circulating DNA. Blood samples were collected in K3EDTA tubes and
cell-free DNA BCT, and processed immediately except for one cell-free DNA BCT from each collection that was shipped by mail back to the same collection center [BCT (posted)]. Cell-free DNA (cfDNA) levels (AC/mL) (A and B) andQ27 mutant allele (CandD) fractions. The bottom and top of the box represent thefirst and third quar-tiles, respectively, and the band inside represents the median. 993 994 995 996 997 998 999 1000 1001 1002 1003 1004 1005 1006 1007 1008 1009 1010 1011 1012 1013 1014 1015 1016 1017 1018 1019 1020 1021 1022 1023 1024 1025 1026 1027 1028 1029 1030 1031 1032 1033 1034 1035 1036 1037 1038 1039 1040 1041 1042 1043 1044 1045 1046 1047 1048 1049 1050 1051 1052 1053 1054 1055 1056 1057 1058 1059 1060 1061 1062 1063 1064 1065 1066 1067 1068 1069 1070 1071 1072 1073 1074 1075 1076 1077 1078 1079 1080 1081 1082 1083 1084 1085 1086 1087 1088 1089 1090 1091 1092 1093 1094 1095 1096 1097 1098 1099 1100 1101 1102 1103 1104 1105 1106 1107 1108 1109 1110 1111 1112 1113 1114 1115 1116
San Diego, CA)], and it will be important to test these thoroughly to assess their performance for optimal sample processing procedures before next-generation sequencing and dPCR analysis of ctDNA.
These findings have addressed a few of the practical challenges in the blood-to-plasma sample processing workflow in a hospital setting. For example, in the clinic, processing may be delayed due to shortage of staff to enable immediate processing, or collection outside office hours. In some scenarios, when conducting multicenter clinical trials, many individual centers do not have access to the full spectrum of centrifuges with the higher second centrifugation speeds required to perform the recom-mended double-centrifugation procedures. The ability to delay processing by collecting into cell-stabilization tubes, or theflexibility to perform the centrifugation in a range of different types of centrifuges, or storing at 4C after collection for a short period, will greatly improve the feasibility of collecting high-quality specimens. For sam-ples collected across a wide geographical area, shipment may be necessary before central processing to standardize pre-analytic factors and maximize cost-effectiveness. This study showed no statistically significant difference in NGS background noise with or without shipment. However, other studies have shown that the shipping temperature of cell-free DNA BCT was deemed to be a critical factor to ensure delivery of high-quality specimens for downstream ctDNA analysis.23 In these studies, variable results were observed at extreme temperatures, at 10C and 40C, which affected the cellular interface, resulted in an elevated ratio of long/short genomic DNA fragments, and a decrease in plasma volume. These studies indicate that shipment temperature should be carefully controlled by the use of insulated packages, gel blocks, or temperature log-ging devices to maintain stability.
Previous studies have mainly focused on locus-specific analysis using quantitative PCR or dPCR that examined one locus at a time. With technology advances, an increasing number of molecular profiling strategies have been devel-oped using NGS,24which provides a higher resolution and larger genomic coverage than a locus-specific approach. It is therefore important to also understand the effects of cfDNA sample processing on the analytical performance of NGS-based analysis. It is particularly important to test whether using a collection tube containing a preservative has the potential to introduce DNA sequence modifications, which may be misinterpreted as true patient-specific genomic alterations. A recent study examined the influence of sample collection in CellSave tubes on the analysis of global copy number variations using NGS technology, and did notfind differences in allele frequencies compared with EDTA blood.9 In this study with BCT and K3EDTA tubes, the
effects of processing on the background error rates during targeted amplicon sequencing and sWGS were evaluated. As expected, different error rates were observed in different base substitutions, but there was no difference in
background error rate regardless of the type of collection device and sample processing schedule. The sWGS analysis results agreed with previous findingsin that copy numberQ23 data were consistent across conditions.
All of these findings provide important insights for the potential incorporation of routine NGS technology in plasma-based molecular diagnostics. Beyond the analysis of ctDNA, it is crucial to also understand the impact of pre-analytical factors on other nucleic acids or genomic variants, such as tumor-specific RNA (ctRNA), microRNA, or DNA methylation, some of which have been studied,25but more evidence is required. Their quantification would likely be affected by the levels of total RNA or methylated DNA that is derived from the blood cells. It is important to understand whether the effects of sample processing procedures could be addressed in a similar manner to the effects on circulating DNA.
With the increasing understanding of genomic alterations and matched targeted treatment options, the demand for a non-invasive molecular profiling tool is growing. Analyzing cell-free nucleic acids presents a unique opportunity for longitudinal follow-up during treatment of cancer patients. Initiatives have begun to pursue the standardization of methods for cell-free DNA analysis. Understanding the impact of different pre-analytic factors will help accelerate the process and drive large-scale cross-center validation studies to provide robust evidence for clinical utility of circulating tumor DNA and its integration into routine clinical practice.
Acknowledgments
We thank the patients for consenting to participate, the Human Research Tissue Bank at Addenbrooke’s Hospital, which is supported by the NIHR Cambridge Biomedical Research Center, Frank Diehl for discussions about method standardization, and Irena Hudecova for help preparing figures. The Genomics Core of the Cancer Research UK Cambridge Institute provided sequencingQ24 support.
D.W.Y.T., H.B., S.-J.D., C.P., A.P., N.R., C.C., J.D.B., and D.G. conceived and designed the study; D.W.Y.T., H.B., S.-J.D., C.H., L.J., C.P., and A.P. processed samples, collected clinical data, and managed samples; B.R., D.W.Y.T., A.R.-V.M.A., S.-J.D., E.M., and D.G. performed NGS and dPCR experiments; F.M., D.C., J.M., and V.P. analyzed NGS data; B.R., D.W.Y.T., D.C., and D.G. wrote the manuscript; all authors approved thefinal version.
Supplemental Data
Supplemental material for this article can be found at
https://doi.org/10.1016/j.jmoldx.2018.07.005. 1117 1118 1119 1120 1121 1122 1123 1124 1125 1126 1127 1128 1129 1130 1131 1132 1133 1134 1135 1136 1137 1138 1139 1140 1141 1142 1143 1144 1145 1146 1147 1148 1149 1150 1151 1152 1153 1154 1155 1156 1157 1158 1159 1160 1161 1162 1163 1164 1165 1166 1167 1168 1169 1170 1171 1172 1173 1174 1175 1176 1177 1178 1179 1180 1181 1182 1183 1184 1185 1186 1187 1188 1189 1190 1191 1192 1193 1194 1195 1196 1197 1198 1199 1200 1201 1202 1203 1204 1205 1206 1207 1208 1209 1210 1211 1212 1213 1214 1215 1216 1217 1218 1219 1220 1221 1222 1223 1224 1225 1226 1227 1228 1229 1230 1231 1232 1233 1234 1235 1236 1237 1238 1239 1240
References
1. Wan JCM, Massie C, Garcia-Corbacho J, Mouliere F, Brenton JD, Caldas C, Pacey S, Baird R, Rosenfeld N: Liquid biopsies come of age: towards implementation of circulating tumour DNA. Nat Rev Cancer 2017, 17:223e238
2. Siravegna G, Marsoni S, Siena S, Bardelli A: Integrating liquid bi-opsies into the management of cancer. Nat Rev Clin Oncol 2017, 14: 531e548
3. Garcia-Murillas I, Schiavon G, Weigelt B, Ng C, Hrebien S, Cutts RJ, Cheang M, Osin P, Nerukar A, Kozarewa I, Garrido JA, Dowsett M, Reis-Filho JS, Smith IE, Turner NC: Mutation tracking in circulating tumor DNA predicts relapse in early breast cancer. Sci Transl Med 2015, 7:302ra133
4. Bettegowda C, Sausen M, Leary RJ, Kinde I, Wang Y, Agrawal N, et al: Detection of circulating tumor DNA in early- and late-stage human malignancies. Sci Transl Med 2014, 6:224ra24
5. Lui YY, Chik KW, Chiu RW, Ho CY, Lam CW, Lo YM: Predominant hematopoietic origin of cell-free DNA in plasma and serum after sex-mismatched bone marrow transplantation. Clin Chem 2002, 48: 421e427
6. El Messaoudi S, Rolet F, Mouliere F, Thierry AR: Circulating cell free DNA: preanalytical considerations. Clin Chim Acta 2013, 424: 222e230
7. Chiu RWK, Poon LLM, Lau TK, Leung TN, Wong EM, Lo YMD: Effects of blood-processing protocols on fetal and total DNA quanti-fication in maternal plasma. Clin Chem 2001, 47:1607e1613 8. Barrett AN, Zimmermann BG, Wang D, Holloway A, Chitty LS:
Implementing prenatal diagnosis based on cell-free fetal DNA: accu-rate identification of factors affecting fetal DNA yield. PLoS One 2011, 6:e25202
9. Rothwell DG, Smith N, Morris D, Leong HS, Li Y, Hollebecque A, Ayub M, Carter L, Antonello J, Franklin L, Miller C, Blackhall F, Dive C, Brady G: Genetic profiling of tumours using both circulating free DNA and circulating tumour cells isolated from the same pre-served whole blood sample. Mol Oncol 2016, 10:566e574 10. Fernando MR, Chen K, Norton S, Krzyzanowski G, Bourne D,
Hunsley B, Ryan WL, Bassett C: A new methodology to preserve the original proportion and integrity of cell-free fetal DNA in maternal plasma during sample processing and storage. Prenat Diagn 2010, 30: 418e424
11. Norton SE, Lechner JM, Williams T, Fernando MR: A stabilizing reagent prevents cell-free DNA contamination by cellular DNA in plasma during blood sample storage and shipping as determined by digital PCR. Clin Biochem 2013, 46:1561e1565
12. Dawson SJ, Tsui DW, Murtaza M, Biggs H, Rueda OM, Chin SF, Dunning MJ, Gale D, Forshew T, Mahler-Araujo Rajan S, Humphray S, Becq J, Halsall D, Wallis M, Bentley D, Caldas C, Rosenfeld N: Analysis of circulating tumor DNA to monitor metastatic breast cancer. N Engl J Med 2013, 368:1199e1209
13. Forshew T, Murtaza M, Parkinson C, Gale D, Tsui DW, Kaper F, Dawson SJ, Piskorz AM, Jimenez-Linan M, Bentley D, Hadfield J, May AP, Caldas C, Brenton JD, Rosenfeld N: Noninvasive identifi -cation and monitoring of cancer mutations by targeted deep sequencing of plasma DNA. Sci Transl Med 2012, 4:136ra68
14. Wang J, Ramakrishnan R, Tang Z, Fan W, Kluge A, Dowlati A, Jones RC, Ma PC: Quantifying EGFR alterations in the lung cancer genome with nanofluidic digital PCR arrays. Clin Chem 2010, 56: 623e632
15. R-Core-TEAM: R: A Language and Environment for Statistical Computing. Vienna, Austria, R Foundation for Statistical Computing, 2015
16. Heitzer E, Ulz P, Belic J, Gutschi S, Quehenberger F, Fischereder K, Benezeder T, Auer M, Pischler C, Mannweiler S, Pichler M, Eisner F, Hauesler M, Riethdorf S, Pantel K, Samonigg H, Hoefler G, Augustin H, Geigl JB, Speicher MR: Tumor-associated copy number changes in the circulation of patients with prostate cancer identified through whole-genome sequencing. Genome Med 2013, 5:30 17. Li H, Durbin R: Fast and accurate short read alignment with
Burrows-Wheeler transform. Bioinformatics 2009, 25:1754e1760
18. Affymetrix: Median of the Absolute Values of all Pairwise Differences and Quality Control on Affymetrix Genome-Wide Human SNP Array
6.0 White Paper; 2008 Q25
19. Wong D, Moturi S, Angkachatchai V, Mueller R, DeSantis G, van den Boom D, Ehrich M: Optimizing blood collection, transport and storage conditions for cell free DNA increases access to prenatal testing. Clin Biochem 2013, 46:1099e1104
20. Gusnanto A, Wood HM, Pawitan Y, Rabbitts P, Berri S: Correcting for cancer genome size and tumour cell content enables better estimation of copy number alterations from next-generation sequence data. Bio-informatics 2012, 28:40e47
21. Parpart-Li S, Bartlett B, Popoli M, Adleff V, Tucker L, Steinberg R, Georgiadis A, Phallen J, Brahmer J, Azad N, Browner I, Laheru D, Velculescu VE, Sausen M, Diaz LA Jr: The effect of preservative and temperature on the analysis of circulating tumor DNA. Clin Cancer Res 2017, 23:2471e2477
22. Warton K, Yuwono NL, Cowley MJ, McCabe MJ, So A, Ford CE: Evaluation of Streck BCT and PAXgene stabilised blood collection tubes for cell-free circulating DNA studies in plasma. Mol Diagn Ther 2017, 21:563e570
23. Medina Diaz I, Nocon A, Mehnert DH, Fredebohm J, Diehl F, Holtrup F: Performance of streck cfDNA blood collection tubes for liquid biopsy testing. PLoS One 2016, 11:e0166354
24. Katsanis SH, Katsanis N: Molecular genetic testing and the future of clinical genomics. Nat Rev Genet 2013, 14:415e426
25. Page K, Guttery DS, Zahra N, Primrose L, Elshaw SR, Pringle JH, Blighe K, Marchese SD, Hills A, Woodley L, Stebbing J, Coombes RC, Shaw JA: Influence of plasma processing on re-covery and analysis of circulating nucleic acids. PLoS One 2013, 8:e77963 1241 1242 1243 1244 1245 1246 1247 1248 1249 1250 1251 1252 1253 1254 1255 1256 1257 1258 1259 1260 1261 1262 1263 1264 1265 1266 1267 1268 1269 1270 1271 1272 1273 1274 1275 1276 1277 1278 1279 1280 1281 1282 1283 1284 1285 1286 1287 1288 1289 1290 1291 1292 1293 1294 1295 1296 1297 1298 1299 1300 1301 1302 1303 1304 1305 1306 1307 1308 1309 1310 1311 1312 1313 1314 1315 1316 1317 1318 1319 1320 1321 1322 1323 1324 1325 1326 1327 1328 1329 1330 1331 1332 1333 1334 1335 1336 1337 1338 1339 1340 1341 1342 1343 1344 1345 1346 1347 1348 1349 1350 1351 1352 1353 1354 1355 1356 1357 1358 1359 1360 1361 1362 1363 1364