Power-Saving in Storage Systems for Cloud Data Sharing Services with Data Access Prediction
11
0
0
Full text
(2) HASEBE et al.: POWER-SAVING IN STORAGE SYSTEMS FOR CLOUD DATA SHARING SERVICES WITH DATA ACCESS PREDICTION. 1745. standby mode without degrading performance. For this objective, we first traced the access patterns of 50,000 randomly selected public photographs on Flickr for 7,000 hours (around 10 months). In this preliminary study, we observed that potential future accesses correlate strongly with the combination of elapsed time after upload and the total number of accesses in the past. Our method uses this correlation, and periodically rearranges data according to potential future accesses, instead of simply sorting the data by the order of the latest number of accesses. Moreover, in this paper we investigate a method that further increases the utilization efficiency even when files are removed by clients. To evaluate the effectiveness of our method, we measured the performance in both simulations and an implementation of a prototype using the real access traces of public photographs on Flickr. In the experiments, we observed that our method reduced energy consumption by 12.2% when compared with the static configuration (in which all disks are always in active mode). At the same time, our method maintains a preferred response time, where 0.23% of all accesses involved disks in standby mode. This paper is an extended version of the paper [19], and includes the following new results. First, we evaluate the proposed method using a power-consumption model of disk drives. We thus evaluate the results according to the estimated power consumption, instead of measuring the total running time of the active disks. Second, we consider file deletion and improve the data rearrangement algorithm. Third, we improve the data access prediction function using data access tracing over a longer period. The remainder of this paper is organized as follows. Section 2 presents related work. Section 3 gives the results of our preliminary investigations into the access patterns of public photographs on Flickr. Section 4 describes the proposed method and Sect. 5 introduces the power model. Sections 6 and 7 present our simulation results and an evaluation of our prototype. Finally, Sect. 8 concludes the paper and presents future work. 2. Related Work There have been a number of studies on saving power in storage systems (cf. also the paper [2] for a comprehensive survey of this research area). The key idea in these studies is to gather the workload into a subset of disks, thereby enabling other disks to be in standby mode. These techniques can be classified into the following three categories according to variations in their approach. The first category focuses on popularity and concentrates popular data on specific disks. Massive Array of Idle Disks (MAID) [4] provides specific disks that are used as a cache to store frequently accessed data, thereby reducing accesses to other disks. PDC [20] periodically reallocates data in the storage array according to the latest access frequencies. The second category uses NVRAM to extend the standby mode period by caching data to a write store. A. typical example is Pergamum [24], which uses NVRAM to buffer write accesses and store data signatures and thus reduce the number of direct accesses to the disks. The final category considers redundancy (i.e., data replication). In DIverted Accesses (DIV) [21], original and redundant data are separated onto different disks, thereby allowing I/O requests to be concentrated onto the disks that contain the original data. Hibernator [30] applies the idea of PDC to RAID and Dynamic Rotations Per Minute (DRPM) [10]. RIMAC [29] provides two-layered caches, one for storing data and the other for parity conservation. Power-Aware RAID (PARAID) [28] is another powersaving technique for RAID. It allocates the replicas in a specific way so that data are collected or spread to adapt to changes in operational workloads. Many of these studies have restricted their scope to storage systems with a specific kind of central controller to manage the data access or storage systems consisting of a relatively small number of disks. However, in recent years, researchers have shifted their target to large storage systems. Harnik et al. [11] attempted to apply the idea of DIV to a large distributed storage system. Kaushik et al. [14] proposed dividing disks in the Hadoop Distributed File Systems (HDFS) [22] into hot and cold zones. Verma et al. [26] proposed Sample-Replicate-Consolidate Mapping (SRCMap), which gathers accesses to the replicas on active disks, whereas Vrbsky et al. [27] proposed a replication approach called the Sliding WINdow replica strategy (SWIN). In our previous studies [12], [13], we proposed power-saving methods based on the Distributed Hash Table (DHT) technique, such as Chord [23]. These methods skew the workload by migrating virtual nodes in the storage array. The present paper investigates an effective technique for skewing the workload in large-scale distributed storage systems, taking an approach from the first category of techniques. In particular, the proposed method can be considered to be a direct successor to PDC. However, our main motivation is to explore power saving in an environment where a vast amount of data is continuously uploaded, whose prime target is cloud data sharing services. Additionally, we explore a technique for predicting future access patterns and apply it to PDC-based systems to reduce the accesses to disks in standby mode. 3.. Data Access Tracing on Flickr. As a preliminary study, we traced access patterns of photographs uploaded to Flickr, which is one of the largest photo-sharing services in the world. In this study, we randomly selected 50,000 photographs and traced the cumulative number of accesses for each file every hour for 7,000 hours, using APIs provided by the website. Owing to limitations on observable data, all the selected photographs were publicly available, although the website supposedly has around four times as many private photographs as public photographs (according to a Flickr’s report and our observations)..
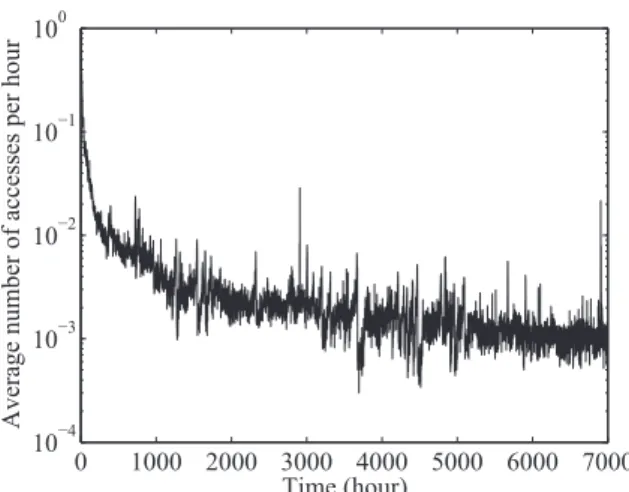
(3) IEICE TRANS. INF. & SYST., VOL.E98–D, NO.10 OCTOBER 2015. 1746. Fig. 1. Hourly average number of accesses of photographs on Flickr.. Fig. 2. Distributions of the popularities of all photographs.. In the remainder of this section, we first present our observations and characteristics of the photographs on Flickr, and then discuss why PDC cannot be directly applied in our target environment. We also show that potential future accesses correlate strongly with a combination of the elapsed time after upload and the total number of past accesses. Our proposed system uses this measure to sort data according to potential future accesses. Next, we present other characteristics that were revealed during this study. Finally, we discuss the advantages and limitations of our prediction method. Figure 1 shows the change in the hourly average number of accesses of all files over the 7,000 hours, where the horizontal and vertical axes indicate the elapsed time after upload and the average number of accesses of all photographs. This figure shows a strong negative correlation between the access frequency and elapsed time. The number of accesses rapidly decreases immediately after the upload and eventually reaches, on average, 2.0 · 10−3 and 8.2 · 10−4 accesses per hour after 2,000 and 7,000 hours, respectively. Figure 2 shows the distributions of the popularities of all photographs measured at every 100 hours after the upload. Here, the horizontal axes indicate the photographs. Fig. 3. Access patterns of 40 randomly selected photographs.. arranged according to the cumulative number of accesses and the elapsed time after upload, while the vertical axis indicates the cumulative number of accesses for each photograph. The figure shows that the access frequencies are highly skewed. At a lapse of 100 hours, 759 most popular photographs were accessed more than 100 times, among which the highest number of accesses was 490, whereas at a lapse of 7,000 hours, 19.6% of all photographs have never been accessed and 68.8% of all photographs have been accessed less than 10 times. Figures 1 and 2 indicate that the number of accesses has a tendency to decrease over time (more specifically, it decreases rapidly in the first several hundred hours), and these accesses are concentrated on a small subset of files. These results suggest that merely sorting the data according to the latest access frequency will split the storage array into a group of frequently accessed disks and a group of rarely accessed disks, without degrading the performance. However, as demonstrated in our previous study [18], this is not the case. Figure 3 (which was also presented in the paper [19]) shows the access patterns of 40 randomly selected photographs. Here, the selected photographs are represented on the vertical axis and the accesses are plotted on a horizontal line, with the number of accesses after each elapsed hour indicated by different shapes. This figure shows that, although a photograph is rarely accessed after a certain time period, it continues to be accessed to some extent. Moreover, the access patterns are quite different from one another. Thus, even if we confine rarely accessed data to specific disks, these seemingly random accesses frequently invoke a state transition from standby to active mode, which degrades the response time of the system. To solve the above problem, a possible approach is to raise the estimation accuracy of potential future accesses. For this we focus on the correlation between potential future accesses and a combination of the elapsed time after upload and the total number of accesses in the past. Our method uses this as a measure for predicting future accesses according to past access patterns. As indicated by Figs. 1 and 2, a.
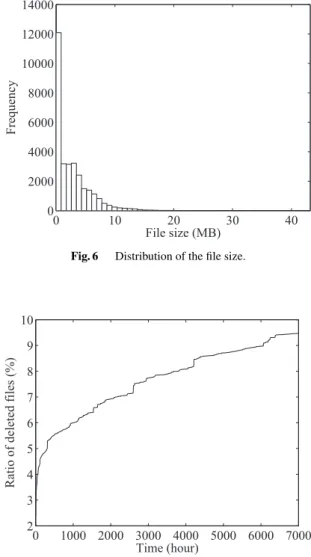
(4) HASEBE et al.: POWER-SAVING IN STORAGE SYSTEMS FOR CLOUD DATA SHARING SERVICES WITH DATA ACCESS PREDICTION. 1747. Fig. 4. Smoothed raw data using the average of 2,500 neighborhood cells.. Fig. 5 future.. Three-dimensional array indicating the number of accesses in the. Fig. 6. Fig. 7. shorter elapsed time after upload correlates to more photograph accesses, and more accesses in the future. To use this correlation as a measure for sorting data according to predicted future accesses, we smooth the raw data in two steps. First, we draw a three-dimensional graph, in which the horizontal axes indicate the elapsed time after upload and the cumulative number of past accesses of all photographs, and the vertical axis indicates the cumulative number of accesses over the past 1,000 hours. We then obtain Fig. 4 by smoothing the previous result using the average of 2,500 neighboring cells. Finally, we approximate the number of future accesses after each elapsed time with a power function using the least-squares method. We eventually obtain the result as presented in Fig. 5. We also obtained the statistical characteristics of the size and the number of deletions of photographs on Flickr. Figure 6 shows the distribution of the file size of the traced photographs. This figure indicates that there are very few photographs of large file size. Indeed, 96.9% of the photographs were less than 10 MB, the average file size was 2.65 MB and the median was 1.76 MB. Figure 7 shows the change in the ratio of deleted photographs. This figure indicates that many of the deletions occurred immediately after upload. For example, 63.3% of deletions were within 1,000. Distribution of the file size.. Change in the ratio of deleted photographs.. hours of upload. The number of deleted photographs then grew at a constant rate, and more than 9% of photographs had been deleted after 7,000 hours. We also use these results in our evaluations. Finally, we discuss the strengths and weaknesses of our prediction method. As we shall see in Sect. 6, our method is more accurate than the method only with the latest number of accesses. In addition, because our prediction method is given as a matrix, the overhead of calculating the likelihood of future access is negligible. Moreover, the overhead for obtaining a new prediction function is also small, because this process can be conducted offline. On the other hand, there are several limitations. First, our method cannot treat files for which the elapsed time after upload exceeds the period of the statistical data being used for prediction. (For example, a prediction function based on access traces over a period of 4,000 hours cannot be applied to files uploaded more than 4,000 hours ago.) Second, to maintain prediction accuracy in an environment where the access pattern varies often, it is necessary to rebuild the prediction function. These issues will be investigated in future work..
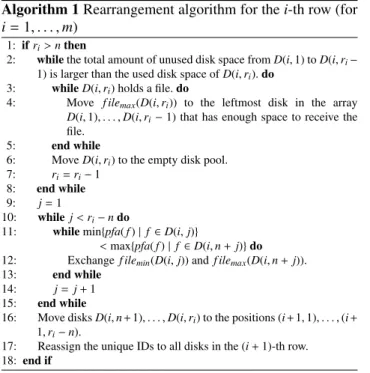
(5) IEICE TRANS. INF. & SYST., VOL.E98–D, NO.10 OCTOBER 2015. 1748. Algorithm 1 Rearrangement algorithm for the i-th row (for i = 1, . . . , m). 4. System Design Our proposed storage system is composed of several thousand (possibly heterogeneous) disks with unique IDs, edge servers, an index manager, and I/O servers. Figure 8 illustrates the overall architecture, where the I/O servers are omitted for readability. Each disk is physically connected to an I/O server and is logically classified into one of three groups: Group A, Group B, and the empty disk pool. As we shall see below, each disk travels among these groups (depicted by the thick arrows in the figure) depending on its state. Initially, some are placed in Group A and the rest in the empty disk pool. The edge servers handle the I/O requests from the clients, and the index manager provides a lookup service for data accesses. Files uploaded by the clients are always written to the disks in Group A via the corresponding edge and I/O servers. At that time, the index manager assigns a unique ID to the file and records it and the ID of the disk on which the file is stored. After the upload, the total number of read/write accesses to each file is recorded by the storing I/O server. If a disk in Group A becomes full, it moves to Group B and a new empty disk is supplied to Group A from the disk pool. Thus, the number of disks in Group B continuously increases with the number of data uploads, whereas the number of disks in Group A is constant. The disks in Group B are logically allocated in a rectangular grid consisting of m rows and n columns. The intersection point of the i-th row (from the top) and the j-th column (from the left) is denoted by (i, j). Additionally, the disk at (i, j) is denoted by D(i, j). The numbers of rows and columns may vary over time, but are uniquely determined by a predefined rule related to the total number of disks in Group B. The disks in Group B behave in the following way. When a disk moves from Group A to B, it is placed at position (1,1) and then moves to the right (i.e., from (1, j) to (1, j + 1) for j = 1, 2, . . .) every time a new disk is added to Group B. At regular intervals (e.g., once a day), the rearrangement algorithm presented in Algorithm 1 is executed. Fig. 8. System architecture.. 1: if ri > n then 2: while the total amount of unused disk space from D(i, 1) to D(i, ri − 1) is larger than the used disk space of D(i, ri ). do 3: while D(i, ri ) holds a file. do 4: Move f ilemax (D(i, ri )) to the leftmost disk in the array D(i, 1), . . . , D(i, ri − 1) that has enough space to receive the file. 5: end while 6: Move D(i, ri ) to the empty disk pool. 7: ri = ri − 1 8: end while 9: j=1 10: while j < ri − n do 11: while min{pfa( f ) | f ∈ D(i, j)} < max{pfa( f ) | f ∈ D(i, n + j)} do 12: Exchange f ilemin (D(i, j)) and f ilemax (D(i, n + j)). 13: end while 14: j= j+1 15: end while 16: Move disks D(i, n + 1), . . . , D(i, ri ) to the positions (i + 1, 1), . . . , (i + 1, ri − n). 17: Reassign the unique IDs to all disks in the (i + 1)-th row. 18: end if. for each row. Here, for readability, we use the following expressions. ri is the current number of disks in the i-th row; pfa( f ) is the potential future accesses of file f (shown as Fig. 5 in Sect. 3); f ilemax (D) is argmax f ∈D pfa( f ) and f ilemin (D) is argmin f ∈D pfa( f ). At an execution of the algorithm, if the disks overflow a row (as described in Line 1 of Algorithm 1), each I/O server calculates the potential future accesses for all its stored files and the algorithm then executes the following steps. Step 1 (Described from Lines 2 to 8): All data in disk D(i, ri ) (i.e., the rightmost disk in the i-th row) are packed to the disk array D(i, 1), . . . , D(i, ri − 1) from left to right, if the array has enough disk space. D(i, ri ) then becomes empty and moves to the empty disk pool. Step 2: The potential future accesses for all files in the row is gathered on the I/O server for D(i, ri ). Step 3 (Described from Lines 9 to 15): If the maximum access frequency of all files in the overflowed disk D(i, n + j) (for j = 1, . . . , ri − (n + 1)) is greater than the minimum access frequency of all files in disk D(i, j), the files f ilemax (D(i, n + j)) and f ilemin (D(i, j)) are exchanged. This process is repeated until no such pair of files remains. Step 4 (Described at Lines 16 and 17): The overflowed disks D(i, n + 1), . . . , D(i, ri ) are moved to the positions (i + 1, 1), . . . , (i + 1, ri − n) and the unique IDs are then reassigned to the disks in the (i + 1)-th row. The algorithm then repeats the same process from Step 1 for the next row. Here, we remark on the effect of the value of n on the performance. In our previous work [19], we evaluated the impact on performance of changes in the value of n. Theoretically, a small value of n insists on a strict sorting, thereby.
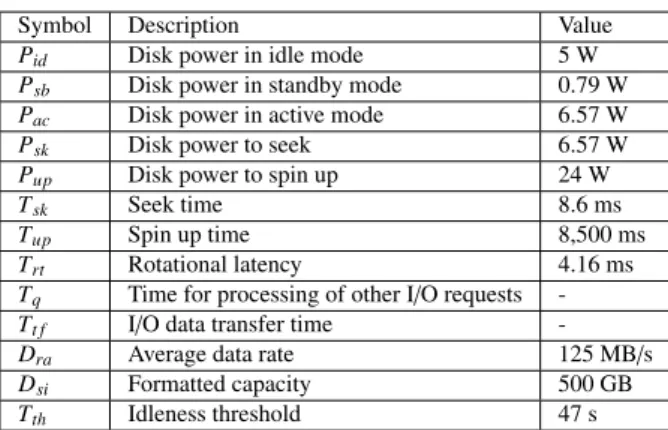
(6) HASEBE et al.: POWER-SAVING IN STORAGE SYSTEMS FOR CLOUD DATA SHARING SERVICES WITH DATA ACCESS PREDICTION. 1749. reducing the power consumption while increasing network traffic, and vice versa. However, in this evaluation, we observed little noticeable effect on the performance, unless n were to be set to an extremely large or small value. In the experiments of this study, we set n so that the grid forms a square, but according to our previous observation, the results are unlikely to be changed by a different value of n. Apart from the measure to estimate future access frequency, our method has several advantages over the PDC. First, our method is based on the PDC but incorporates a mechanism to effectively pack the continuously uploaded data into the disk array. Second, our method is designed to reduce the number of migrations. Generally, as an uploaded file gets older, it will become unpopular. As previously explained, in our method, disks in Group B gradually move downwards in the grid. Therefore, the data are spontaneously allocated by the order of elapsed time, which facilitates the reordering by access frequency. Third, our method also provides a mechanism to improve the space efficiency of disks degraded by file deletion, which is realized by Step 1 of the algorithm. As Fig. 7 in Sect. 3 suggests, the total number of deleted files cannot be ignored. In this sense, our proposed method contributes to further reduce the total running time and required computing resources. Conversely, there are still several parts of our method that must be improved. In particular, to achieve a higher level of scalability, it is worthwhile realizing a lookup service in the system without introducing any kind of central controller like index manager.. 5.2. Power Consumption Model and Parameter Settings. Table 1 summarizes the model parameters and the values that we used in our evaluations. These settings are based on the specifications of the Seagate Barracuda ST500DM002 disk drive. In the table, the values for T q and T t f are not specified because they depend on the finishing time of the previous I/O request and the size of the data transferred, respectively. In our model, the power consumption of a disk drive executing an I/O request is estimated as the sum of the power required for transferring data and the power required for state transition. For example, the total power consumed by a disk in standby mode spinning up and performing I/O requests is T up · Pup + T acs · Pac [mJ], where T acs denotes the access time explained below. 5.3. Model of the Response Time. Generally, response time T rp is highly variable and depends on the current disk state, as given by T (if the disk is in idle mode.) acs T + T (if the disk is in standby mode.) T rp = up acs T +T (if the disk is in active mode.) q. acs. Here, T acs denotes the access time (i.e., the processing time for I/O requests), which can be decomposed into seek time T sk , rotational latency T rt , and transfer time T t f , i.e. T acs = T sk + T rt + T t f .. 5. Modeling Power Consumption 5.4 In this section, we briefly describe a power consumption model for disk drives based on the studies [5], [17] (see also the paper [2] for a survey of modeling techniques), and fix the model parameters that we used in our evaluations. 5.1 Dynamic Power Management A modern disk drive enables dynamic power management, which means there are transitions among three states called the active, idle, and standby modes. Figure 9 illustrates the state transitions. Data transfers occur in the active mode. When a disk is waiting for I/O requests, it is transitioned to idle mode, in which the disk continues rotating. A disk in idle mode is transitioned to standby mode after a fixed threshold time (called the idleness threshold) has elapsed since the last access. In standby mode, the spindle is at rest and the heads are parked, which results in power savings.. Fig. 9. Power-state machine for three-state disk drive.. Setting the Idleness Threshold. It is important to set the idleness threshold to a suitable value if we wish to reduce the power consumption using dynamic power management. A threshold that is too small may result in a frequent spin up, which requires considerable power (denoted by Pup ). Conversely, a threshold that is too long may prohibit state transitions from idle to standby mode, which may further reduce the power consumption. To set a suitable idleness threshold, we use the well-known breakeven time technique, i.e. we determine the amount of time a Table 1 Symbol Pid P sb Pac P sk Pup T sk T up T rt Tq Tt f Dra D si T th. Summary of model parameters and their values.. Description Disk power in idle mode Disk power in standby mode Disk power in active mode Disk power to seek Disk power to spin up Seek time Spin up time Rotational latency Time for processing of other I/O requests I/O data transfer time Average data rate Formatted capacity Idleness threshold. Value 5W 0.79 W 6.57 W 6.57 W 24 W 8.6 ms 8,500 ms 4.16 ms 125 MB/s 500 GB 47 s.
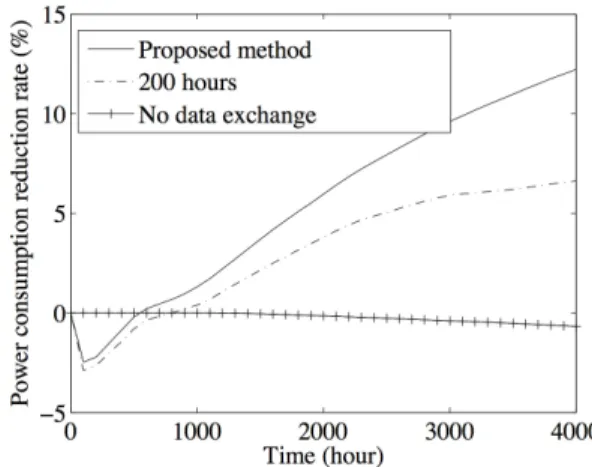
(7) IEICE TRANS. INF. & SYST., VOL.E98–D, NO.10 OCTOBER 2015. 1750. disk must be in standby mode to conserve the same energy consumed by transitioning the disk down and back to active mode. More precisely, the break-even time (denoted by T be ) can be calculated as follows. First, T be can be decomposed into min T be = T up + T sb . min Here, T sb is the minimum length of the standby mode after completing the previous I/O request satisfying the following equation. min min P sb · T sb + Pup · T up = Pid (T sb + T up ).. This equation means that the total power required to be in standby mode and spin up (described as the left hand side) is equal to the total power required to remain in idle mode (described as the right hand side). From the above results, we obtain Pup · T up − P sb · T up T be = . Pid − P sb In our model, T be = 47 s, which we used as the idleness threshold in our evaluations. 6. Simulation Results We developed a simulator of a storage system based on our proposed method. The simulator mimics the implementation of a storage system consisting of several thousands of disks. In addition, on the basis of the power consumption model introduced in the previous section, the simulator faithfully models the power and time required by the disks. Using the simulator, we evaluated the power consumption and the access frequency of disks in standby mode. 6.1 Parameters and Settings We considered the following system in the evaluation. Group A consisted of a single disk, while Group B consisted of unlimited disks supplied from the empty disk pool. The number of disks in Group B was initially zero and increased depending on the upload. Disks in Group B were allocated in a square grid, where the number of disks in each row and column were adjusted by the rearrangement algorithm presented in Sect. 4, which is executed once a day. For each disk drive, the required power and time were determined from the values given in Table 1. The data transfer rate of the network was set to 60 MB/s. The workload in the simulation was based on the access traces obtained in the observation of Flickr described in Sect. 3. The trace of each photograph was randomly selected from a set of 50,000 real traces for uploaded photographs by our workload generator. Along with the observed traces, we also considered the deletion of photographs. The file size of each photograph was set to 2.65 MB according to measurements in our statistical analysis presented in Sect. 3. According to Flickr’s reports [7], [8], we assumed that 3,000. photographs were uploaded every minute. To evaluate the effectiveness of our method, we compared the power consumption and the ratio of the accesses to disks in standby mode in the following three configurations. • “Proposed method”: configuration based on our proposed data rearrangement algorithm (introduced in Sect. 4) and the function to estimate potential future accesses (introduced in Sect. 3). • “200 hours”: configuration based on our proposed data rearrangement algorithm, in which the data were sorted according to the total number of accesses during the latest 200 hours. • “No data exchange”: configuration without any dynamic reallocation. In each configuration, the disks in idle mode can be transitioned to standby mode after the idleness threshold has elapsed since the last access. 6.2. Power Consumption. Figure 10 shows the change in power consumption for the three configurations. Here, the horizontal and vertical axes indicate the elapsed time and the change in the reduced power consumption (compared with the configuration in which all disks in the system are always active). The figure reveals that the power consumption after 4,000 hours was respectively reduced by 12.2%, 6.6%, and −0.68%, when employing the configurations “Proposed method”, “200 hours”, and “No data exchange”. This result shows that both our access prediction function and rearrangement algorithm were effective in reducing power consumption. We also observed that “Proposed method” and “200 hours” increased the power consumption immediately after the simulation. This was thought to be an aftereffect of the increase in the duration of the active mode caused by data migration. However, as the figure indicates, this phenomenon was temporary and the situation improved after approximately 300 hours.. Fig. 10. Power consumption..
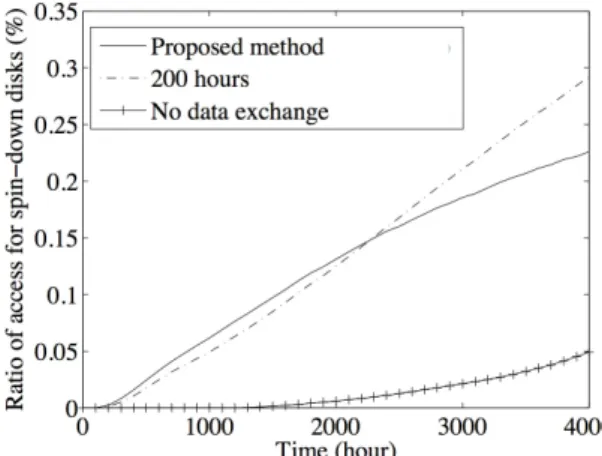
(8) HASEBE et al.: POWER-SAVING IN STORAGE SYSTEMS FOR CLOUD DATA SHARING SERVICES WITH DATA ACCESS PREDICTION. 1751. As shown in Fig. 10, our method reduces energy consumption by 12.2% compared with a static configuration. According to the study of [15], data storage alone is responsible for about 25–35% of datacenter power consumption. By a simple calculation, our method can reduce the total energy consumption of a datacenter by 3.1–4.2%. According to a report of [6], a 5,000 square ft datacenter consumes 1,127 kW of power. Thus, if our method is applied to a datacenter of equal size (consisting of around 2,000 physical machines), the total power reduction using our method is 34.94–47.33 kW when compared with the static configuration (i.e., without any dynamic data migration). The cost of electricity is assumed to be $0.063/kWh (cf. [14]). Therefore, applying our method to a targeted storage system can reduce energy costs by around $19,000–26,000 per year. The economic and environmental benefits will depend on the scale of the datacenter, but as this result indicates, they are of no small significance for our target environment, which consists of several thousands of disks. 6.3 Accesses to Disks in Standby Mode Figure 11 shows the change in the ratio of the accesses of disks in standby mode. Here, the horizontal and vertical axes indicate the elapsed time and the ratio of the number of accesses to disks in standby mode to all accesses, respectively. We observed that 0.23%, 0.29%, and 0.05% of accesses were of disks in standby mode in “Proposed method”, “200 hours”, and “No data exchange” after 4,000 hours, respectively. This result shows that our access prediction function reduces the accesses to disks in standby mode and improves the trade-off between power consumption and response time. As shown in Fig. 11, under our method, 0.23% of accesses are of disks in standby mode. According to the results of our experiments, the average response times for disks in active and spin-down modes are 40.6 ms and 8,544.5 ms, respectively. Thus, the total average response time can be estimated as 60.16 ms (= 40.6 ∗ 0.9977 + 8544.5 ∗ 0.0023). This indicates that our method increases the response time. by, at most, tens of milliseconds. Here, we note that our study targets network servers, and servers of this kind typically interact with people, so even substantial degradations (for example, from 10–100 ms) may not be noticeable. 6.4. We also evaluated the effect of the improvements of our previous study [18] by comparing the power consumption and the ratio of the accesses to disks in standby mode between the method of this study and the previous study of [18]. As described in Sect. 1, this study is an extension of [18] by improving the data rearrangement algorithm and the access prediction. Thus, we here considered the configuration denoted by “200 hours” (i.e., data were sorted according to the total number of accesses during the past 200 hours) with the data rearrangement algorithm presented in our previous study [18]. In the simulation, the power consumption after 4,000 hours was reduced by 8.9%, with 0.39% of accesses made to disks in standby mode. Comparing this result with those in Sects. 6.2 and 6.3, we can see that the method proposed in this study improves both the reduction in power and the number of accesses to disks in standby mode. 7.. Experiments on Implementation. We conducted an experiment on the current prototype implementation of our proposed system to evaluate the applicability of our method to real systems. The objective of the experiments presented in Sect. 7 is to demonstrate that our method maintains a preferred response time in a real system, even though our method skews the workload with data migration, which may cause a reduction in network bandwidth. In particular, our experiments aimed to clarify the following points: • The impact of both data migration and the concentration of workload on the response time in the most popular disk group, • The impact of the transition to standby mode on the response time in the least popular disk group. 7.1. Fig. 11. Ratio of accesses of spin-down disks.. Comparison with the Previous Method. Parameters and Settings. We measured the response time in an environment where the system workload was the same as that in the simulation. Our prototype consisted of 10 PC servers, each of which was equipped with a Intel Dual-core Xeon 3.60 GHz CPUs, 2 GB RAM, and a single 36 GB hard disk drive. Owing to the limitation of our experimental environment, we emulated our target system by the following way. First, due to the bandwidths of different servers, we evaluated the response time of data access by measuring the time from sending a request until the data were loaded into the memory of the servers. Second, although the real capacity of a disk drive was 36 GB, we assumed that the capacity was 500 GB. To emulate this, the response time for each access.
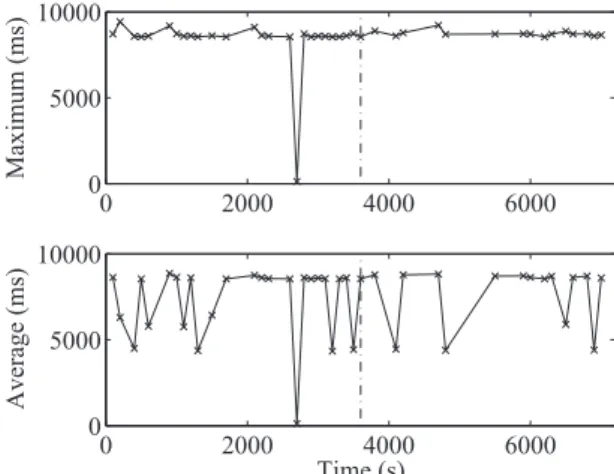
(9) IEICE TRANS. INF. & SYST., VOL.E98–D, NO.10 OCTOBER 2015. 1752. Fig. 12. Response time in the first row after 100 hours.. was measured by repeatedly accessing the same set of files. (More precisely, to avoid the effect of the cache, we prepared a set of files and randomly generated I/O requests to them.) Third, because it was difficult to spin up or spin down disks in the current system configuration (as each server consisted of a single disk, on which was installed the operating system), we mimic the required periods for state transitions by letting the server wait before accessing the disk. As in our simulations, we respectively set the spin up time and the idleness threshold to 8,500 ms and 47 s, respectively. Furthermore, no underlying lookup service to access data was implemented in our prototype. Thus, in the experiments, the data were accessed by their storing server. To demonstrate that our method maintains a preferred performance, even though the workload is highly skewed, we measured the response time for the 10 disks with the highest and lowest access frequencies in Group B at lapses of 100 and 4,000 hours, respectively. Moreover, to evaluate the impact of our data rearrangement on the system performance, we also measured the change in response time during and after the data rearrangement process. 7.2 Response Time in the First and Last Rows after 100 Hours Figure 12 shows the change in the maximum and the average response time of 10 disks in the first row (i.e., disks with the highest access frequencies) after 100 hours, where the rightmost disk in the row began data exchange with other disks after 1 hour (as indicated by the vertical dash-dot line). The figure shows that the average response times were 83.1 ms in the interval from 0 to 3,600 s, 110.1 ms in the interval from 3,601 to 7,200 s, and 96.7 ms in the entire period. These results indicate that, although the response time suffered slightly from the data exchange conducted at 3,600 s, the overall average response time was appropriate and not worsened by accesses to disks in standby mode. Figure 13 shows the change in the maximum and average response times of 10 disks in the last row (i.e., disks with the lowest access frequencies) after 100 hours, where. Fig. 13. Fig. 14. Response time in the last row after 100 hours.. Response time in the first row after 4,000 hours.. the setting was the same as that in Fig. 12. This result indicates that, in contrast to the case of the disks in the first row, owing to the spinning-up of disks in standby mode, some accesses took longer than 8,500 ms and the overall response time was longer than that for the first row. The result also shows that there seems to be very few data exchanges among these disks, because the response time remained unchanged after the rearrangement. 7.3. Response Time in the First and Last Rows after 4,000 Hours. Figure 14 shows the changes in the maximum and average response times of 10 disks in the first row after 4,000 hours. The result was almost the same as that in the case after 100 hours. This result indicates that the frequently accessed disks can maintain the preferred response time regardless of the time elapsed since uploading. Figure 15 shows the changes in the maximum and average response times of 10 disks in the last row after 4,000 hours. The figure reveals that, the disks were rarely accessed and most of the accesses were of disks to standby mode. This section showed that the overall average response.
(10) HASEBE et al.: POWER-SAVING IN STORAGE SYSTEMS FOR CLOUD DATA SHARING SERVICES WITH DATA ACCESS PREDICTION. 1753. Fig. 15. Response time in the last row after 4,000 hours.. time suggests the applicability of the method to real environments. Although there are accesses to disks in standby mode in the last row, as the previous simulation results showed, these accesses are few (0.23%) on the whole and thus our method maintains a preferred responsiveness. 7.4 Concluding Remark on the Experiments From the results of our simulations and experiments, the overall response time can be estimated as 60.16 ms. On the other hand, with the disks used in our experiments, we observed that the fastest response for non-overloaded disks in active mode was about 37 ms, which is similar to the best performance under the architecture of our implementation. These results indicate that our method increases the response time by (at most) only tens of milliseconds in comparison with any configuration. This amount of latency is acceptable, because our study targets network servers, that usually interact with people and a degradation up to 100 milliseconds may not be noticeable. 8. Conclusions and Future Work We presented a power-saving method for large-scale distributed storage systems whose prime target is platforms for cloud data sharing services. Our proposed method is an application of the technique of PDC to a constant massive influx of data. To improve on our previous work [18], and especially to reduce the number of accesses to disks in standby mode, our method periodically rearranges data in the order of potential future accesses presumed to be associated with the elapsed time after upload and accesses in the past, instead of simply sorting by the latest number of accesses. This technique for data access prediction is based on statistical analysis of real traces of 50,000 public photographs on Flickr for 7,000 hours. We evaluated the performance of our system both in simulations and prototype implementation using real traces obtained from Flickr. In the simulation, we observed that our method used 12.2% less energy than the static config-. uration, in which all disks are always in active mode. At the same time, our method maintained a preferred response time, with 0.23% of the total accesses involving disks in standby mode. In this paper, we have only considered the access traces of public photos on Flickr, so the applicability of our method to services that have different access patterns remains unknown. Although there is room for further research into this remaining issue, some previous studies report that some other popular data sharing services have a quite similar access feature to the case of Flickr. For example, according to the study [3], popular YouTube videos have a tendency to become more popular and unpopular videos to become less popular as time passes. In addition, the popularity of most of the videos grows more slowly as time passes. These characteristics conform to our observations regarding Flickr. Similar reports can be found in the study of [1] regarding photos on Facebook. These results indicate that our method can expect to be widely applicable to other data sharing services. In future work, one of the most interesting and worthwhile directions of investigation is to extend the present study to a fully distributed mechanism for power-aware datacenter-scale storage systems. A possible approach is to integrate a technique of a distributed hash table, such as Chord [23], into our method. This would allow our system to be highly scalable. We are also interested in the applicability of our method to other services that have different access patterns from Flickr. There have been a number of studies on data access prediction in data sharing services, such as the studies of [9] and [16]. We consider the refinement of our prediction function using these results to be a useful approach to address this issue. Acknowledgments The authors would like to express their sincere appreciation to the anonymous reviewers for their helpful and constructive comments that greatly contributed to improving the final version of the paper. References [1] D. Beaver, S. Kumar, H.C. Li, J. Sobel, and P. Vajgel, “Finding a needle in Haystack: facebook’s photo storage,” Proc. USENIX Conference on Operating Systems Design and Implementation, article no.1-8, 2010. [2] T. Bostoen, S. Mullender, and Y. Berbers, “Power-Reduction Techniques for Data-Center Storage Systems,” ACM Comput. Surv., vol.45, no.3, article no.33, 38 pages, 2013. [3] X. Cheng, C. Dale, and J. Liu, “Statistics and social network of youtube videos,” Proc. International Workshop on Quality of Service, pp.229–238, 2008. [4] D. Colarelli and D. Grunwald, “Massive arrays of idle disks for storage archives,” Proc. ACM/IEEE Conference on Supercomputing, pp.1–11, 2002. [5] Y. Deng, “What is the future of disk drives, death or rebirth?,” ACM Comput. Surv., vol.43, no.3, pp.23:1-23:27, 2011. [6] Emerson Electric Co., “Energy logic: Reducing data center energy consumption by creating savings that cascade across systems,” white.
(11) IEICE TRANS. INF. & SYST., VOL.E98–D, NO.10 OCTOBER 2015. 1754. paper, 2009. [7] Flickr’s blog page on September 19, 2010. (http://blog.flickr.net/en/2010/09/19/5000000000/) [8] Flickr’s blog page on August 4, 2011. (http://blog.flickr.net/en/2011/08/04/6000000000/) [9] G. Gursun, M. Crovella, and I. Matta, “Describing and forecasting video access patterns,” Proc. IEEE International Conference on Computer Communications, pp.16–20, 2011. [10] S. Gurumurthi, A. Sivasubramaniam, M. Kandemir, and H. Franke, “DRPM: dynamic speed control for power management in server class disks,” ACM SIGARCH Computer Architecture News, vol.31, issue 2, pp.169–181, 2003. [11] D. Harnik, D. Naor, and I. Segall, “Low power mode in cloud storage systems,” Proc. Parallel and Distributed Processing Symposium, pp.1–8, 2009. [12] K. Hasebe, T. Niwa, A. Sugiki, and K. Kato, “Power-Saving in Large-Scale Storage Systems with Data Migration,” Proc. IEEE International Conference on Cloud Computing Technology and Science, pp.266–273, 2010. [13] K. Hasebe, T. Sawada, and K. Kato, “Using a Potential Game for Power Reduction in Distributed Storage Systems,” Proc. IEEE International Workshop on Software Defined Systems, pp.550–555, 2014. [14] R.T. Kaushik and M. Bhandarkar, “GreenHDFS: towards an energyconserving, storage-efficient, hybrid Hadoop compute cluster,” Proc. 2010 International Conference on Power Aware Computing and Systems, pp.1–9, 2010. [15] J. Kim and D. Rotem, “Energy proportionality for disk storage using replication,” Proc. International conference on extending database technology, pp.81–92, 2011. [16] H. Li, X. Ma, F. Wang, J. Liu, and K. Xu, “On popularity prediction of videos shared in online social networks,” Proc. ACM international conference on information and knowledge management, pp.169– 178, 2013. [17] Y.H. Lu, E.Y. Cheng, T. Šimunić, L. Benini, and G. De Micheli, “Quantitative comparison of power management algorithms,” Proc. Conference of Design, Automation and Test in Europe, pp.20–26, 2000. [18] J. Okoshi, K. Hasebe, and K. Kato, “Power-Aware Autonomous Distributed Storage Systems for Internet Hosting Service Platforms,” Proc. 3rd International Conference on Cloud Computing, pp.52–61, Springer LNICST vol.112, 2012. [19] J. Okoshi, K. Hasebe, and K. Kato, “Power-Saving in Storage Systems for Internet Hosting Services with Data Access Prediction,” Proc. 4th International Green Computing Conference, 10 pages, 2013. [20] E. Pinheiro and R. Bianchini, “Energy conservation techniques for disk array-based servers,” Proc. International Conference on Supercomputing, pp.68–78, 2004. [21] E. Pinheiro, R. Bianchini, and C. Dubnicki, “Exploiting redundancy to conserve energy in storage systems,” Proc. ACM SIGMETRICS Conference on Measurement and modeling of computer systems, pp.15–26, 2006. [22] K. Shvachko, H. Kuang, S. Radia, and R. Chansler, “The Hadoop Distributed File System,” in Proc. IEEE 26th Symposium on Mass Storage Systems and Technologies, pp.1–10, 2010. [23] I. Stoica, R. Morris, D. Karger, M.F. Kaashoek, and H. Balakrishnan, “Chord: A scalable peer-to-peer lookup service for internet applications,” Proc. ACM SIGCOMM, pp.149–160, 2001. [24] M. Storer, K. Greenan, E. Miller, and K. Voruganti, “Pergamum: Replacing tape with energy efficient reliable, disk-based archival storage,” Proc. USENIX Conference on File and Storage Technologies, pp.1–16, 2008. [25] USA Today, YouTube serves up 100 million videos a day online, July 16, 2006. [26] A. Verma, R. Koller, L. Useche, and R. Rangaswami, “SRCMap: Energy proportional storage using dynamic consolidation,” Proc. 8th. [27]. [28]. [29]. [30]. USENIX Conference on File and Storage Technologies, pp.154– 168, 2010. S.V. Vrbsky, M. Lei, K. Smith, and J. Byrd, “Data Replication and Power Consumption in Data Grids,” Proc. IEEE Second International Conference on Cloud Computing Technology and Science, pp.288–295, 2010. C. Weddle, M. Oldham, J. Qian, A. Wang, P. Reiher, and G. Kuenning, “PARAID: A gear-shifting power-aware RAID,” Proc. USENIX Conference on File and Storage Technologies, pp.245– 260, 2007. X. Yao and J. Wang, “RIMAC: a novel redundancy-based hierarchical cache architecture for energy efficient, high performance storage systems,” Proc. ACM SIGOPS/EuroSys European Conference on Computer Systems, pp.249–262, 2006. Q. Zhu, Z. Chen, L. Tan, Y. Zhou, K. Keeton, and J. Wilkes, “Hibernator: helping disk arrays sleep through the winter,” Proc. ACM symposium on Operating systems principles, pp.177–190, 2005.. Koji Hasebe received his Bachelor’s, Master’s, and Ph.D. degrees in Philosophy from Keio University in Japan in 1998, 2000, and 2006, respectively. He is an assistant professor at the Department of Computer Science of the University of Tsukuba. His research interests include formal verification, distributed systems, game theory, and computer security.. Jumpei Okoshi received his Bachelor’s and Master’s degrees from the University of Tsukuba, Japan, in 2012 and 2014, respectively. He is currently a researcher at the Central Research Laboratory of Hitachi, Ltd. His research interests include data processing platforms, distributed systems, and storage systems. He contributed to this study in his Master’s course.. Kazuhiko Kato received his Bachelor’s and Master’s degrees in Engineering from the University of Tsukuba, Japan, in 1985 and 1987. He received his Ph.D. from The University of Tokyo, Japan, in 1992. He is currently a professor at the Department of Computer Science of the University of Tsukuba. His research interests include operating systems, distributed systems, and secure computing. He received distinguished paper awards from JSSST and IPSJ in 2004 and 2005, respectively..
(12)
Figure
+4
Related documents
É Method and Language: How do corporations, investment banks, consulting firms, and academic financial economists think?. É What language are these
– What triggers can be used for starting, boosting, or stopping a contingency or mitigation activity!. – What is the best way to gum up the risk
I am currently studying for my EdD at the Institute of Education, University College London and am conducting a comparative analysis of the assessment of aspiring principals who
Follow these medication tips to help control your pain following surgery:.. • Take your medication
The company selected SolidWorks mechanical design software for the Little Benthic Vehicle project because of its ease of use, ability to model organic shapes and surfaces,
The study showed that resilience was a prerequisite for successful inclusion as the learners achieved academic success in an inclusive mainstream pedagogic setting despite
This study investigated the fish diversity of Eko – Ende and Owalla reservoirs, which are within the Osun river system in South West, Nigeria with a view to
potency estimation. Intra- and interlaboratory calibration of the DR CALUX bioassay for the analysis of dioxins and dioxin-like chemicals in sediments. The source and
