Available Online at www.ijcsmc.com
International Journal of Computer Science and Mobile Computing
A Monthly Journal of Computer Science and Information Technology
ISSN 2320–088X
IMPACT FACTOR: 6.199
IJCSMC, Vol. 9, Issue. 1, January 2020, pg.27 – 39
Study and Analysis of Different
Feature Extraction Methods in
Digital Image Processing
Anupam Baruah
1; Prof. (Dr.) Lakshmi Prasad Saikia
2 ¹Research Scholar, Dept. of Computer Science & Engineering, Assam Down Town University, India ²Professor, CSE & Dean, Faculty of Engineering & Technology, Assam Down Town University, India1
[email protected]; [email protected]
Abstract- Feature extraction plays a vital rule in image processing. Image processing means process of digital images using various feature extraction and detection algorithm. Feature extraction algorithm is applied to get the best features that will be important for classifying and recognition of images. Main objective of this paper is to study and compare various feature extraction methods based on accuracy and computation time from experimental results.
Keywords- SIFT, SURF, Harris, FAST and feature.
I. INTRODUCTION
A feature is a pattern or structure of a digital image. The features are distinguished from its surroundings by texture, colour, corners, and pixels of an image. These features are applied in the field of detection and classification of the images. Machine learning approach is used in different feature extraction algorithm for adaptive processing. In this paper, we evaluate the performance of different feature extraction and detection algorithm in MATLAB environment. Algorithms are implemented in MATLAB programming language.
II. RELATED WORKS
In 2016, Yukti bakshi et al. reviewed some methods of face recognition. They used SIFT and SURF algorithm for feature extraction to perform matching from the images and those extracted features applied to PCA and Eigen vectors are extracted in each face. They concluded that this method is fast and provide better recognition rate.[2]
In 2015 Ladislav Lenca et al. Proposed an automatic face recognition system based on SIFT features. They compared SIFT based Kepenekci face recognition algorithm with the no. of most powerful AFR methods like FERET, AR, LEW etc. They concluded that the proposed method outperforms all other methods and therefore decided to integrate this method into their face recognition system.[3]
Bhaskar Anand et al. Proposed a face recognition technique based on SURF features and SVM classifier. They proposed that face recognition accuracy is affected by some factors like illumination, facial expression, calling and perspective movement. They tested their experiment in Yale faces and UMIST face databases. From experiment the method showed a good accuracy with the face images having different variations.[4]
In 2016 Towfiq et al. proposed an algorithm for object detection and recognition by using SURF features. In this paper they used enhanced SURF algorithm for counting the features in both object and origin image in the dataset and calculated matching percentage using a metric of counting with inliers matching features. They used RANSAC algorithm for eliminate error matching.[5]
In 2014 Sriram Emarase et al. proposed an automated attendance system using SURF features. They used SURF descriptors for recognition and produce a reliable performance in MATLAB environment.[6]
In 2016 Meenu ,Surendra singh proposed a finger print matching algorithm based on BRISK,SURF & MSER feature extraction methods. They used this algorithm to match original image with face database stored in a folder. In this approach the objects that contain information about BRISK features have been detected in 2D image with greyscale variant. They also applied BRISK sampling pattern to obtain pair wise brightness comparison. They concluded that BRISK exploits the speed saving offered in the SSE instruction set. [7]
In 2016 Jung H.Oh et al. proposed a whole image BRISK to extract features of an image. In this approach they used bag of words methods to calculate similarity score and calculated loop closure places, They concluded that using this method they could significantly improve the overall efficiency and performance of the face recognition. [8]
Stefan Leutenegger et al. Proposed an algorithm called BRISK, a novel method for detect key points, description and matching. In contrast to earlier algorithm such as SIFT, Surf the method offers a faster alternative at reliable matching percentage. They concluded that BRISK depends on configurable sampling pattern. [9]
Mrinal Kanti Bhowmik,Sandip Shil et al. Proposed an approach for feature point extraction using Harris interest point detector to locate the thermal facial features. From their experiment they showed that Harris operator can detect good no of interest point in illation variation, rotation and scaling conditions. [11]
S. SriVidya,Prakash S Proposed an approach that compared and evaluated the implementation of various feature extraction methods like FAST,HARRIS,SURF,MSER in terms of variations like rotation, scaling, noise etc. on features such as corner and blob. Implementation was done on INTEL i3 processor with 3GB RAM [12]
III.FEATURE EXTRACTION METHODS
FAST algorithm:
FAST algorithm was proposed by Rosten Drummond [13] for determining interest points in an image. Interest point is a pixel in an image having well defined positions that can be strongly detected. Each interest point has much information content and should be repeatable between different images. The goal of FAST algorithm was to detect corner points that can be utilized in real time frame rate applications like image matching, object detection and recognition and image tracking etc.
Machine learning approach is used in this algorithm for adaptive processing. This algorithm identified few points inside a particular range and processed where as the points fall outside the range are rejected.
Feature detection using FAST algorithm
Step 1: Select a pixel “P” in the image. Assume the intensity of pixel “P” be Ip. Step 2: Set threshold intensity T and assumed only 20% of pixel under test. Step 3: Consider the 16 pixels within a circle that is surrounding the pixel P [38]. Step 4: “N” contiguous pixels among 16 needs to be either above or below Ip by the
value T.
Step5: Compare the intensity of pixels 1, 5,9,13 of the circle with Ip .
At least three out of four pixels should satisfied the threshold criteria for yield interest point.
Step6: If at least three out of four pixel values say I1, I5, I9, I13 are not
above or below Ip then “P” is not in the corner. Else if at least three out of four are above or below Ip then check for all 16 pixels and check if 12 contiguous pixels fall within the region.
Step7: Repeat the above steps for all pixels in the image.
This algorithm has some limitations-
If N<12, the algorithm does not work properly because the no of detected interest point is very high.
SIMULATION:
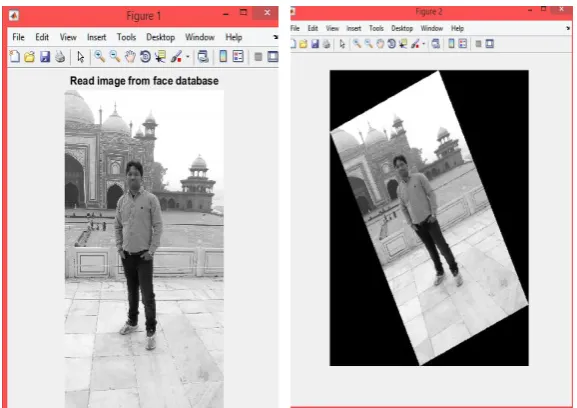
Read image from database:
Imread() function read the image file(filename.jpg) from image database stored in system drives.
Figure : Images from database using imshow() function
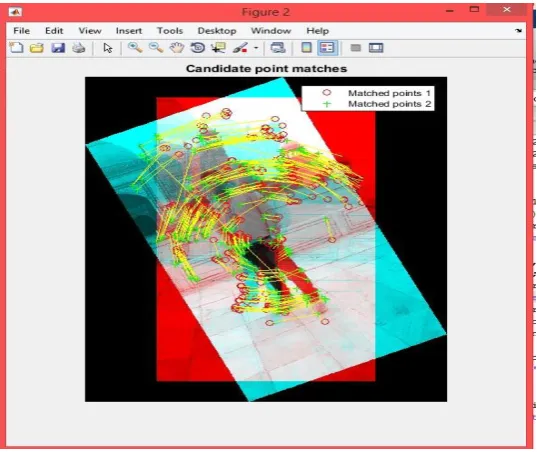
Matching features points between images:
matchFeatures() function is used for matching extracted features between two images.
Figure 2: Matches features between two images.
SURF algorithm:
used to detect the intersect point for computing three integer operations for a pre-computed integral image. As a descriptor SURF uses first order Haar wavelet in x, y co-ordinate .SURF uses 64 dimension to reduce the time cost for feature matching and computation.
Feature detection using SURF algorithm
Step1: Computation of integral images are performed at this stage. Video frame is transformed into integral images. [39]
Where x and y are the height and width of the image respectively. Step2: In this step the Hessian matrix is created by applying the 2nd order
Gauss kernels x, y, z[40].
Hessian is computed by the following equation
Step3: In this step responses from determinant are normalized to scale. Higher scale is used the more pixels pass into the kernel.
Step 4: In this step, non maximal suppressions are calculated for finding the maximum determinant value. After that the determinant value is filtered with predefined threshold to reserve strongest interest point. Step 5: Haar wavelets of size 4δ in x and y directions are calculated. Wavelets
are calculated that are located within a radius of 6δ around the interest points.
SIMULATION:
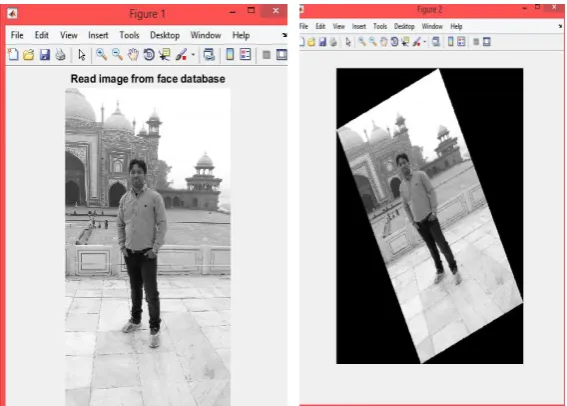
Read image from database:
Imread() function read the image file(filename.jpg) from image database stored in system drives.
Matching features points between images:
matchFeatures() function is used for matching extracted features between two images.
Figure 4: Matches features between two images
BRISK algorithm:
BRISK algorithm was proposed by Stefan Leutenegger et al for image detection. It is a new method for key point detection, description and matching.
Feature detection using BRISK algorithm
Step1: It processes all key points in picture plane as well as in scale space utilizing same strategy like FAST. Be that as it may, it utilizes 9 – 16 veil, which implies 9 out of 16 pixels must be more brighter or darker (maxima or minima) to focus pixel (limit fulfilling pixel). It applies 9-16 locators on all octaves and intra-octaves to make sense of all region of interest at that point oppressed them into non-maximal concealment to discover genuine interest point. [16] Step2: For key points description it performs point to point comparison of intensity.
This descriptor is made out of twofold string. It assembles the consequences of straightforward splendour correlation test and structures the paired string. It sets bit 1 when force of first pixel is higher than second and 0 generally. Step 3: It processes the neighbourhood angles (size, introduction) over each interest
point for introduction and turn invariance
Step 4: It structures long combines and short matches. Long combines are those whose remove is above limit and short pair's separation will beneath the edge. Long matches are utilized for introduction assurance and short combines utilized for force examination that assembles the descriptor.
Read image from database:
Figure 6: Images from database using imshow() function.
Matching features points between images:
matchFeatures() function is used for matching extracted features between two images.
Figure 7: Matches features between two images
Harris algorithm:
Feature detection using HARRIS algorithm
Step1: Discover the x and y derivatives of the picture.[41]
Step 2: Discover the results of the derivatives of every pixel
Step3: Ascertain the covariance framework M
Step 5: This is determined by a window function: w(x, y) that is:
Where: I(x+u, y+v) is known as the shifted intensity I(x, y) is known as the intensity The above equation can be simplified as:
Step4: Calculate the Eigen values λ: If λ is near 0, at that point it's anything but a corner. So search for conditions where it is huge.
Step5: Calculate the corner response function R:
Here, α value is between 0.04-0.06 Also if the value of R: R<0: it is an edge R>0: it is a corner |R| is small: it is a flat region.
Step 6: For ascertaining the normal corner focuses, we apply AND activity.
So the formula is: crnr=(temp1)&(temp2)&(temp3) Here, temp 1,temp 2 and temp 3 are space where corner estimations of red, green and blue
Step7: For ascertaining the corner points by
using OR operation:crnr=(temp1)|(temp2)|(temp3). Step 8: Step 8: Now find out the color gradient vector values.
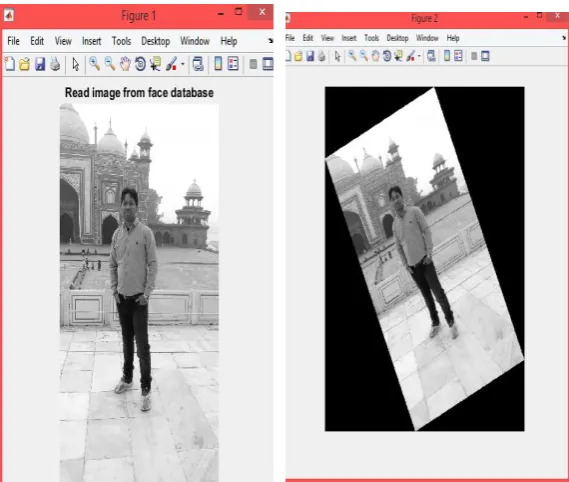
Read image from database:
Figure 9: Images from database using imshow() function.
Matching features points between images:
matchFeatures() function is used for matching extracted features between two images.
IV.SIMULATION AND RESULTS
Comparison of Feature Detection Algorithms for Image processing:
Two fundamental parameters utilized for examination of various element location calculations in image processing are: Accuracy [17] and Time complexity (run time).Even when an image is twisted, the best element purposes of a picture ought to remain nearly the equivalent. In this way, when highlight coordinating is done between the first picture and the distorted picture, the more is the number of coordinating matching features out of the quantity of extracted features, the more is the accuracy. So, it may very well be said that exactness is a relative term that likewise relies upon the number of extricated features.
The steps for comparison are as follows
Step1: Read an input image and store it in a variable a.
Step2: Distort the image by rotating or resizing and store in a variable b. Spep3:Feature points are detected by using four algorithm like SURF, BRISK,
HARRIS, FAST separately and out of this N strongest features are detected in each case
Step4: Extracted features are matched using detected features in each case. Step 5: Accuracy can be calculated as follows
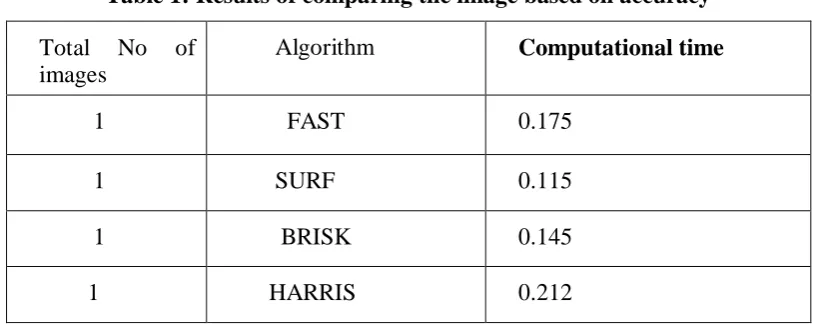
Step6: Lesser the computational time, better is the execution of the calculation. This can be determined by utilizing the run and time option gave in MATLAB at whatever point the program is run.[18]
Table 1: Results of comparing the image based on accuracy
Total No of images
Algorithm Computational time
1 FAST 0.175
1 SURF 0.115
1 BRISK 0.145
Table 2: Results of comparing the image based on computational time
0 0.2 0.4 0.6 0.8 1 1.2
No of images Computational time
SURF
HARRIS
BRISK
FAST
Figure 11: Plotted accuracy of different feature extraction algorithms
No of images
Extracted features Matched features Accuracy
Algorithm Original Distorted Original Distorted
1
FAST 774 1528 111 111 69.72
1
SURF 476 635 31 31 74.96
1
BRISK 837 906 274 274 30.54
1
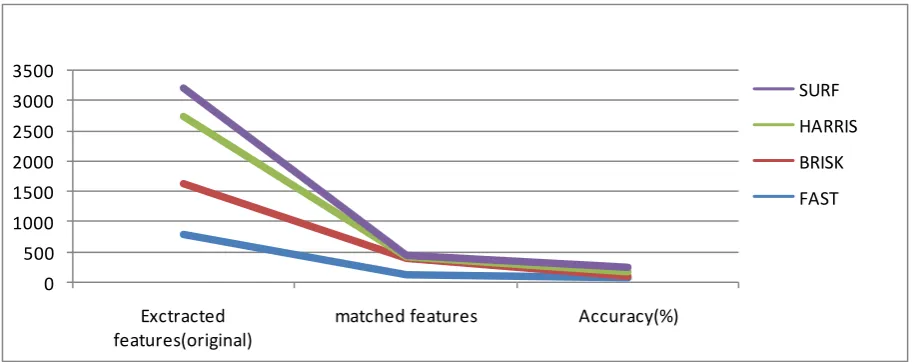
0 500 1000 1500 2000 2500 3000 3500 Exctracted features(original)
matched features Accuracy(%)
SURF
HARRIS
BRISK
FAST
Figure 12: Plotted computational time performance of different feature extraction algorithms
V. CONCLUSIONS
The outcomes obtained from comparing different feature extraction algorithm based on accuracy and computational time is presented in table 1 and table 2 respectively. From table 2 it is observed that the performance of SURF algorithm based on computational time is better than the other three algorithms. From figure 11 it is observed that the comparison graph of different feature extraction algorithm is based on computational time. From the graph it is clear that time complexity of SURF algorithm is relatively better than other algorithm.
From table 1 it is observed that the performance of SURF algorithm based on accuracy percentage is better than the other three algorithms. Figure 12 shows the comparison graph of different feature extraction algorithm .From the graph it is clear that accuracy of SURF algorithm is relatively better than other algorithms.
R
EFERENCES
[1] Janez Kri?zaj, Vitomir?Struc, Nikola Pave?si ´c."Adaptation of SIFT Features for Robust FaceRecognition".faculty of Electrical Engineering, University of Ljubljana,Tr?za?ska 25, SI-1000 Ljubljana, Slovenia
[2] Yukti Bakhshi#1, Sukhvir Kaur*2, Prince Verma#3,"Face Recognition using SIFT, SURF and PCA for Invariant Faces",International Journal of Engineering Trends and Technology (IJETT) – Volume 34 Number 1- April 2016
[3] Ladislav Lenca, Pavel Kr ´ala,"Automatic Face Recognition System Based on the SIFTFeatures",New Technologies for the Information SocietyFaculty of Applied SciencesUniversity of West BohemiaPlze?n, Czech Republianuary 14, 2015.
[4] Bhaskar Anand,Mr. Prashant K Shah ."Face Recognition usingSURF Features and SVM Classifier",International Journal of ElectronicsEngineering Research.ISSN 0975-6450 Volume 8, Number 1 (2016) pp. 1-8
[5] Tawfiq A. Al-asadi†and Ahmed J. Obaid,"Object detection and recognition by using enhanced Speeded Up Robust Feature",IJCSNS International Journal of Computer Science and Network Security, VOL.16 No.4, April 2016
[7] Meenu,Surender Singh,"Enhanced the Fingerprint Matching using BRISK, SURF & MSER",International Journal of Advance Research inComputer Science and Management Studies,
Volume 4, Issue 7, July2016,ISSN: 2321-7782 (Online)
[8] Jung H. Oh, Gyuho Eoh, and Beom H. Lee ,"Appearance-Based Place Recognition Using Whole-Image BRISK for Collaborative Multi-Robot Localization ",International Journal of Mechanical Engineering and Robotics Research Vol. 4, No. 3, July 2015
[9] Leutenegger, S., M. Chli and R. Siegwart. “BRISK: Binary Robust Invariant Scalable Keypoints”, Proceedings of the IEEE International Conference, ICCV, 2011.
[10] Fatma Susilawati Mohamad*, Fadi Mohammad Alsuhimat, Mohamad Afendee Mohamed, Mumtazimah Mohamad, Azrul Amri Jamal,"Detection and Feature Extraction for Images Signatures",International Journal of Engineering & Technology,International Journal of Engineering & Technology, 7 (3.28) (2018) 44-48
[11] Mrinal Kanti Bhowmika*,Sandip Shilb, Priya Saha,"Feature Points Extraction of Thermal Face using Harris Interest Point Detection",International Conference on Computational Intelligence: Modeling Techniques and Applications (CIMTA) 2013
[12] S.SriVidhya,Prakash S."Performance Evaluation of Various Feature detection Algorithms in VSLAM" PARIPEX - INDIAN JOURNAL OF RESEARCH,Volume : 6 | Issue : 2 | February - 2017,SSN - 2250-1991 | IF : 5.215 | IC Value : 79.9
[13] E. Rosten and T. Drummond, “Machine Learning for High-speed Corner Detection”, Proceedings of the 9th European Conference on Computer Vision, vol. 3951, Part I, 2006, pp. 430-443.
[14]Wikipedia,“Mid-pointalgorithm”, http://en.wikipedia.org/wiki/Midpoint_circle_algorithm
[15] Edward Rosten, Reid PorterandTomDrummond, “FASTER andbetter:A machinelearningapproachto cornerdetection” inIEEE Trans. PatternAnalysisandMachineIntelligence,2010,vol32, pp. 105-119
[16] H. Bay, A. Ess, T. Tuytelaars, L. van Gool, "SURF: Speeded up Robust Features". Computer Vision and Image Understanding (CVIU), vol. 110, No. 3, 2008, pp.346-35
[17] Parvathy Ram, Dr.S.Padmavathi,” Analysis of Harris Corner Detection For Color Images”, International conference on Signal Processing, Communication, Power and Embedded System (SCOPES)-2016,
[18] P.H.S. Torr and D. W. Murray, “The Development and Comparison of Robust Methods for Estimating the Fundamental Matrix”. International Journal of Computer Vision, vol. 24, no. 3, September, 1997, pp. 271–300