Deriving the Pricing Power of Product Features by Mining
Consumer Reviews
Nikolay Archak, Anindya Ghose, Panagiotis G. Ipeirotis Leonard Stern School of Business, New York University, {narchak,aghose,panos}@stern.nyu.edu
The growing pervasiveness of the Internet has changed the way that consumers shop for goods. Increasingly, user-generated product reviews serve as a valuable source of information for customers making product choices online. While there is a significant body of theory on multi-attribute choice under uncertainty, the literature that examines product reviews has not built on this stream of theory for a variety of reasons. Typically, the impact of product reviews has been incorporated by numeric variables representing the valence and volume of reviews. In this paper we posit that the information embedded in product reviews cannot be captured by a single scalar value. Rather, we argue that product reviews are multifaceted and hence, the textual content of product reviews is an important determinant of consumers’ choices, over and above the valence and volume of reviews. We provide a text mining technique that allows us to incorporate text in choice and panel data models by decomposing textual reviews into segments, evaluating different product features. We test our approach on a unique dataset collected from Amazon, and demonstrate how it can be used to learn consumers’ relative preferences for different product features. The dataset used contains three different groups of products (digital cameras, camcorders, PDAs), associated sales data and consumer review data gathered over a 15-month period. Additionally, we present and discuss two experimental techniques that can be used to alleviate the problem of data sparsity and of omitted variables: the first technique models consumer opinions as elements of a tensor product of independent feature and evaluation spaces and the second technique clusters rare opinions based on pointwise mutual information. The paper concludes by discussing the managerial relevance of this work as a tool for extracting actionable business intelligence from user-generated content.
Key words: Consumer reviews, econometrics, electronic commerce, electronic markets, discrete choice, opinion mining, sentiment analysis, user-generated content.
1.
Introduction
The growing pervasiveness of the Internet has changed the way that consumers shop for goods. While in a “brick-and-mortar” store visitors can usually test and evaluate products before making purchase decisions, in an online store their ability to directly assess product value is significantly more limited. It comes as no surprise that online shoppers increasingly rely on alternative sources of information such as “word of mouth,” in general and user-generated product reviews, in particular. In fact, some researchers have established that user-generated product information on the Internet attracts more interest than vendor information amongst consumers (Bickart and Schindler 2001). In contrast to product descriptions provided by vendors, consumer
reviews are, by construction, more user-oriented: in a review, customers describe a product in terms of usage scenarios and evaluate the product from a user’s perspective (Chen and Xie 2004). Despite the subjectivity of consumer evaluations in the reviews, such evaluations are often considered more credible and trustworthy by customers than traditional sources of information (Bickart and Schindler 2001).
The hypothesis that product reviews affect product sales has received strong support in prior empirical stud-ies (Chen et al. 2007, Chevalier and Mayzlin 2006, Dellarocas et al. 2007, Duan et al. 2008, Forman et al. 2008, Godes and Mayzlin 2004, Liu 2006). However, these studies have only used the numeric review ratings (e.g., the number of stars) and the volume of reviews in their empirical analysis, without formally incorpo-rating the information contained in the text of the reviews. To the best of our knowledge, only a handful of empirical studies have formally tested whether the textual information embedded in online user-generated content can have an economic impact. Ghose et al. (2007) estimate the impact of buyer textual feedback on price premiums charged by sellers in online second-hand markets. Eliashberg et al. (2007) combines natural-language processing techniques, and statistical learning methods to forecast a movies return on investment based only on textual information available in movie scripts. But none of these studies focus on estimating theimpact of user-generated product reviews in influencing product sales beyond the effect of numeric review ratings, which is one of the key research objectives of this paper.
There is another potential issue with using only numeric ratings as being representative of the information contained in product reviews. By compressing a complex review to a single number we implicitly assume that the product quality is one-dimensional, while economic theory (see, for example, (Rosen 1974)) tells us that products have multiple attributes and different attributes can have different levels of importance to consumers. Moreover, it has been shown that idiosyncratic preferences of early buyers can affect long-term consumer purchase behavior and that rating can have a self-selection bias (Li and Hitt 2008). Consequently, (Li and Hitt 2008) suggest that consumer-generated product reviews may not be an unbiased indication of unobserved product quality. Further, recent work has shown that the distribution of an overwhelming majority of reviews posted in online markets is bimodal (Hu et al. 2008). In such situations, the average numerical star rating assigned to a product may not convey a lot of information to a prospective buyer. Instead, the reader has to
read the actual reviews to examine which of the positive and which of the negative attributes of a product are of interest. Therefore, our second research objective in this paper is to analyze the extent to whichproduct reviews can help us learn consumer preferences for different product attributes.
A key challenge is in bridging the gap between the essentially textual and qualitative nature of review content and the quantitative nature of discrete choice models. Any successful attempt to address this challenge needs to answer the following questions:
1. How can we identify which product attributes evaluated in a product review?
2. How can we extract opinions about the product attributes expressed in a product review? 3. How can we incorporate extracted opinions in a consumer choice model?
With the rapid growth and popularity of user-generated content on the Web, a new area of research applying text mining techniques to content analysis of product reviews has emerged. The first stream of this research has focused on sentiment analysis of product reviews. (See (Pang and Lee 2008) for an excellent and compre-hensive survey on sentiment analysis.) The earliest work in this area was targeted primarily at evaluating the polarityof a review: reviews were classified as positive or negative based on the occurrences of specific sen-timent phrases (Das and Chen 2007), and WordNet (Hu and Liu 2004a),(Turney 2002),(Pang and Lee 2002). More recent work has suggested that sentiment classification of consumer reviews is complicated, since consumers may provide a mixed review by praising some aspects of a product but criticizing other. This stim-ulated additional research on identifying product features in reviews (Ghani et al. 2006, Hu and Liu 2004a,b, Lee 2004, Scaffidi et al. 2007, Snyder and Barzilay 2007). Automated extraction of product attributes has also received attention in the recent marketing literature. In particular, (Lee and Bradlow 2006) present an automatic procedure for obtaining conjoint attributes and levels through the analysis of Epinions reviews that list the explicit pros and cons of a product.
So, how does this paper contribute to prior research? Prior work in text mining does not reliably capture the pragmatic meaning of the customer evaluations; in particular, the existing approaches do not provide quantitativeevaluations of product features. In most cases, the evaluation of a product feature is done in a binary manner (positive or negative). It is also possible to use a counting scale to compute the number
of positive and negative opinion sentences for a particular feature; opinion counts can later be used for feature-based comparison of two products (Liu et al. 2005). Such a comparison tool is undoubtedly useful for consumers using an online shopping environment. Unfortunately, this technique ignores the strength of the evaluations and does not demonstrate the importance of the product feature in the consumers’ choice process. Is“good battery life”more important for a digital camera than a “small size”? If so, then how important is it in influencing the purchase decision? While questions of this nature might seem fuzzy, they can gain meaning if evaluated in the economic context surrounding consumer reviews and sales.
In sum, our paper aims to infer the economic impact of user-generated product reviews by identifying the weight that consumers put on individual evaluations and product features, and estimating the overall impact of review text on sales. Towards this, we adopt a simple theoretical model of multi-attribute choice under uncertainty (Roberts and Urban 1988) and apply it to online markets with user-generated reviews. In our setting, consumers are rational decision makers having certain beliefs about features of the products offered. As new product reviews appear, consumers read them and update their beliefs about products by using Bayesian learning. When they decide to purchase, they behave as von Neumann-Morgenstern utility maximizers, i.e., they maximize the expected utility of the purchase, given their current beliefs about qualities of the products in the choice set.
Although our theoretical framework is based on Roberts and Urban (1988), our experimental approach differs significantly. While Roberts and Urban used laboratory setting for measurement and estimation, we use a 15-month panel of product sales and reviews of digital cameras, camcorders, and PDAs retrieved from Amazon. As our experimental dataset provides aggregate sales data only, we use our model to derive the relationship between product reviews and total product demand. The estimation equation we obtain is somewhat similar to thehedonic regressionsthat are commonly used in econometrics to identify the weight of individual features in determining the overall price of a product. However, instead of studying the relationship between the fixed and objective product qualities and the product price, we study the relationship between beliefsabout features that are either not directly measurable or are qualitative in nature, and productdemand. In summary, the main objective of this paper is to show how textual information can be incorporated in a
consumer choice model and provide insights for using text mining techniques in quantitative IS, marketing, and economics research. Simultaneously, we highlight the value of using an economic context to computer scientists to estimate both the intensity and the polarity of the consumer opinions.
This paper is organized as follows. Section 2 presents the model that we use to motivate our empirical analysis. Section 3 discusses how textual information can be incorporated in the model. Section 4 describes how the model can be used for empirical estimation of consumer preferences and presents our experimental setting and results, obtained over three big product categories from Amazon.com. In Section 5 we discuss limitations of our model and present possible extensions to address these limitations. Finally, Section 6 concludes the paper with discussion of the results, managerial implications and directions for further research.
2.
Model
In this section, we present a brief outline of our theoretical framework. The basic idea of our model is as follows: Products have multiple attributes and the quality of each attribute is uncertain to consumers. To reduce uncertainty, consumers read product reviews, and use Bayesian learning to update their beliefs about the quality of product attributes. Based on their beliefs, consumers buy the product that maximizes their expected utility, a fact that is reflected in the product sales.
Our theoretical framework is built on Roberts and Urban (1988). Due to space restrictions, we present the detailed derivation of our model in the Appendix, while here we present only the main results and the assumptions behind the model. (The notation that we use appears in Table 1.) Through the description of the model, we hope to outline clearly the scope and applicability of our research, explain what are the assumptions of our model, and identify directions for future research. Specifically, we adopt the following concepts:
Multi-attribute products:Our initial assumption is that goods being chosen can be viewed as vectors of a relatively small number of attributes. Ignoring the uncertainty aspect, our model will represent each good by ann-dimensional pointz= (z1, ..., zn), where eachzishould be read as the amount or quality of thei-th
attribute of the good. While natural in many markets, such as in electronics markets, this assumption indicates that our model cannot be applied to products such as movies or music that do not have clear “attributes.”
Variable Meaning
z vector of product characteristics y(i) i-th consumer budget
α(i) i-th consumer preferences for money
β(i) i-th consumer preferences for product characteristics
RF risk-adjusted preference function with respect to distribution F
G(y, α, β) joint CDF of consumer’s budget and preferences p(j) j-th product price
F(j) CDF of beliefs aboutj-th product attributes before a consumer review was published H(j) CDF of beliefs aboutj-th product attributes after a consumer review was published
sj j-th product demand before a consumer review was published
¯
sj j-th product demand after a consumer review was published
βk consumers’ valuation for mean level of thek-th attribute
mk total number of signals for thek-th attribute contained in the product review
x(ik) value of thei-th signal for thek-th attribute
µ(0k) for normal prior, mean value of the prior for thek-th attribute
σ20 for normal prior, variance of the prior (common for all attributes)
σ2
for normal likelihood, variance of the likelihood (common for all attributes) η=σ2
σ2
0 for normal likelihood and prior, strength of prior beliefs (common for all attributes) Table 1 Notation
Uncertain-attribute qualities: Instead of having a direct assessment of vector z(j) for each product, consumers are uncertain and have beliefs about the distribution ofz(j). In such a scenario, consumers making purchase decisions are not choosing just a product (i.e., a bundle of attributes) but they choose a lottery over bundles of attributes. We follow the classic approach in the theory of choice over lotteries and assume that consumers are von Neumann-Morgenstern expected utility maximizers. Roberts and Urban (1988) argued that if the consumer obeys the von Neumann-Morgenstern axioms for lotteries, the value function should show constant risk aversion. Hence, a natural choice for the utility function is the negative exponential. In order to incorporate the potential risk aversion of consumers, we adopt thenegative exponential utility specificationUi z(j)
=−exp −α(i)(y(i)−p(j))−β(i)·z(j)
, wherey(i)is thei-th consumer’s budget,
p(j)
is thej-th product price,z(j)
is the vector of thej-th product characteristic,α(i)
is the marginal utility of money for thei-th consumer,β(i)is thei-th consumer tastes for product characteristics, and·represents inner product of two vectors.
Normally-distributed prior beliefs and discrete choice: Application of the expected utility theory requires specification of the utility function and of the form of consumers’ beliefs. We adopt a Bayesian learning approach to model changes in consumers’ beliefs and we assume normal prior beliefs. Our argument is that, under certain regularity conditions, recursive Bayesian learning process results in asymptotic normality
of the posterior distribution (Chen 1985). Consumers often use their previous experiences with similar products to form prior distribution about the quality of a new product. Because such experiences correspond to a type of recursive Bayesian learning process, we can assume that consumers use normal priors. This is also consistent with the original approach of Roberts and Urban, who also assumed that consumers’ uncertainty is characterized by a normal distribution.
So, if we use F(j) to represent the cumulative distribution function of consumer’s beliefs about the attributes of thej-th product and assume additive representation of utility, we can represent the total expected utility of thei-th consumer choosing thej-th product as:
EF(j){Ui}=−exp −α(i)(y(i)−p(j))−β(i)·EF(j) z(j) +X k 1 2 βk(i) 2 VarF(j) n zk(j)o ! . (1)
The expected utility is monotone inR(i)
F(j)=β (i)·E F(j) z(j) −P k 1 2 βk(i) 2 VarF(j) n zk(j)o, which Roberts and Urban call a “risk-adjusted preference function” for the current consumers’ beliefs (distributionF(j)). Application of the Roberts and Urban framework, in particular the logit model, gives the probabilityPij that
the userichooses the productj:Pij=
exp(α(i)p(j)+R(i) F(j)) P kexp(α(i)p(k)+R (i) F(k) ).
Homogeneity of consumer preferences: This is the major difference of our approach
from Roberts and Urban (1988). While Roberts and Urban were interested in individual level choices and used a controlled lab experiment to estimate the model, in our setting where we study product reviews we only have access to aggregate level data. The goal, therefore, is to obtain expression for aggregate changes in product demand as a function of informational signals (product reviews) received by consumers. In the logit model we can write the market share of the productjas:sj=
R exp(α (i)p(j)+R(i) F(j) ) P kexp(α(i)p(k)+R (i) F(k)) dG(y(i), α(i), β(i)), whereG(y(i), α(i), β(i))
is the cumulative distribution function of consumer preferences and income. As we can see, the result depends significantly on the distribution of consumer preferences. We will proceed assuming homogeneity of preferences for product attributes, however we will not place any restrictions on the income distribution.1Homogeneity of product tastes is a strong assumption, although it was
con-sistently employed by prior empirical studies of product reviews. Alternatively, we could follow approach
1Formally, we assume that for any two consumersiandj, any monetary endowmenty, and any two productsz= (z
1, ..., zn),
of (Berry et al. 1995): assume a normal distribution of marginal utilities of attributes with a diagonal covari-ance matrix and use Monte-Carlo to estimate market shares. This approach was developed by Berry et al. (1995) for structural demand estimation in the automobile industry. Its application to text analysis, however, is significantly complicated by the high-dimensionality of the feature and opinion spaces (as will be clear from the empirical section of this paper). Another reason against using the approach of Berry et al. (1995) is its sensitivity to measurement noise. This is an issue for researchers who have to work with demand proxies such as sales ranks instead of the actual demand or market shares data. Therefore, we tradeoff expressive power for robustness and assume homogeneity. Note that we can now drop the superscript(i) from the risk-adjusted preference function.
Effect of new review on sales:Our primary goal is not to estimate the equilibrium market share of any particular product, but to understand what happens to product sales when consumers get a new signal about a product. We assume that the new signal influences only the beliefs that consumers have about the product.2
Suppose that the new beliefs about the productjcorrespond to the distribution functionH(j). For analytical tractability, we assume that the number of competing products is sufficiently large so that no single product controls a significant share of the whole market. If we denote the original market share of the productjassj
and the new market share of the productjass¯j, we can obtain the following approximation result:
log(¯sj) = log(sj) +RH(j)−RF(j)+εj. (2)
Please refer to the online appendix for an upper bound on the absolute value of the residual.
Bayesian updating of beliefs:The last component of our model is the mechanism used by consumers to update their beliefs. We use a Bayesian learning approach. For simplicity of estimation, we assume that the qualities of different product attributes are learned independently. For example, observing the picture quality of a digital camera does not give consumers much information on the camera design, the camera size, battery life, etc. Note that this assumption can hold either because signals of different features are actually
2
The implicit assumption is that manufacturers do not immediately change prices in response to new user-generated signals either because they don’t directly observe the signals or do not find it economically feasible to change prices in the short term. This assumption is consistent with institutional practices. For example, new signals (consumer reviews) are frequently published on Amazon (often several times within a day) but product price changes often occur only on a monthly basis.
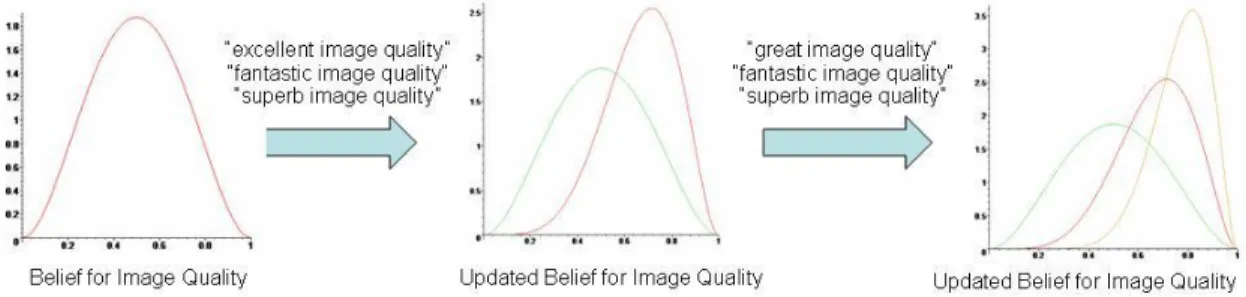
Figure 1 How reviews can update user beliefs for a product feature
independent (i.e. featurezkis independent from the joint distribution of signals for other features) or because
consumers are boundedly rational and cannot capture complex dependencies.3We can also use models that
allow for consumers to learn across attributes, e.g., (Bradlow et al. 2004), but we leave such extensions as directions for interesting future research.
Figure 1 shows a simplistic example of how a review can update user beliefs about a given product feature, in this caseimage quality. The consumer has an initial belief distribution about the product quality, taking values from 0 to 1, with a mean value of 0.5. After reading a few reviews talking about theexcellent,fantastic, andsuperbimage quality, the belief distribution is updated, and moves towards 1, having a mean value around 0.75. After reading a few more reviews, the belief is further updated, and so on.
Overall Result:We already mentioned that we assume normality of consumers’ beliefs. As a natural choice, we consider that the likelihood function is the conjugate distribution, which is also normal. Combining results above, we obtain our main equation that relates the signals observed by consumers to changes in market demand: log( ¯sj) = log(sj) + n X k=1 βk σ2 0 mkσ20+σ2 mk X i=1 (x(ik)−µ (k) 0 ) + 1 2 n X k=1 βk2 σ2 0mk mk+η +εj. (3) where x(1k), ..., x (k)
mk is a sequence of signals about thek-th product feature obtained by consumers from
3
While the model can be extended to cover the case of correlated features and perfectly rational consumers, it is beyond the scope of this paper. Further, our limited size of the dataset and large number of features prevented us from estimating interaction effects between observations of different features.
product reviews andη=σ2
σ20 represents the strength of prior beliefs that consumers have about the product.
4
We can make two important points about this formula:
1. The observations of the signal about the products enter the market share equation linearly. 2. Each observation is discounted by the total number of observations.
Equation 3 suggests that we can map changes in the market share of each product after a new consumer review for this product is posted. Thus, our theoretical framework helps motivate an empirical analysis of this relationship between product sales and the information signals contained in the text of product reviews. The model begets some discussion of the nature of the signals contained in product reviews. So far, we assumed that signalsx(ik)are measured on somenumericscale representing the quality of thek-th attribute. However,
most consumer reviews present information in atextualform as consumers use natural language to describe their impressions and experiences related to the product. Hence, we need to first encode the textual data in a quantitative format in order to impute its economic value. Next, we discuss how we approach the issue of text processing and in Section 4, we combine our theoretical and text mining results to a single model of decision making with text information and we empirically test our model on a dataset containing product review and sales data gathered from Amazon.com.
3.
Econometric Modeling of Text Information
Prior research on consumer reviews and “word of mouth” marketing has largely ignored the non-quantitative nature of information contained in the consumer reviews. The economic analysis of textual data is non-trivial and presents a number of challenges. Consider, for example, our specific context: consumers read product reviews and receive signals about different product attributes. In order to apply the model empirically, for each product review it is important to be able to answer the following three questions:
1. Which product attributes are evaluated in the product review? 2. What evaluations are given to these attributes?
3. What is the pragmatic and economic value of these evaluations to the consumer? That is, how are the evaluations taken into account by the consumer to calculate the mean quality level of a given product?
4η=∞means that consumers consider themselves fully informed and disregard information contained in consumer reviews,η= 0
The first two questions have been examined in the text mining and sentiment classification litera-ture (Pang and Lee 2008). However, so far, no existing automated technique has turned out to be robust enough to be regarded as noise-free and the accepted solution to these problems. The third question about quantifying pragmatic and economic value of user-generated product opinions has not been studied before in the text mining literature. In this section, we will discuss these questions in the context of our model of consumer behavior and illustrate how to apply them in our empirical setting (the description of the dataset is in Section 4.1). We start by presenting our approach to identifying product features.
3.1. Identifying Important Product Features
The first step we take is in identifying the product features that are important to consumers and most frequently described in consumer reviews. Note that for the purpose of our study, it is not very useful to follow product descriptions provided by manufacturers, because that information is static and it usually does not include explicit information about intangible features such as quality of product design, ease of use, robustness and so on. Since intangible product features are hard to measure objectively and are important determinants of consumer buying decisions, it is important to include them in our model. To do so, it is important not to exogenously specify the set of relevant product attributes. Instead we rely on user-generated opinions to identify product features that are mostfrequently discussed by consumers, implicitly assuming that important features are reviewed and discussed frequently.5
There are many different techniques to identifying product features mentioned in consumer reviews. Most of them come from prior text mining research; the problem of automated extraction of product features from consumer reviews has been studied extensively in the last few years (Carenini et al. 2005, Dave et al. 2003, Ghani et al. 2006, Hu and Liu 2004a,b, Lee 2004, Popescu and Etzioni 2005, Scaffidi et al. 2007, Snyder and Barzilay 2007). One popular technique is to use apart-of-speech taggerto annotate each word in the review with its part-of-speech (POS) and mark whether the word is a noun, an adjective, a verb, and so on. Nouns and noun phrases are popular candidates for product features, although other constructs (like verb phrases) are used as well. Alternative techniques involve searching for statistical patterns in the text,
5
for example, words and phrases that appear frequently in the reviews (Dave et al. 2003). Hybrid methods were developed by combining both approaches, where a POS-tagger is used as a preprocessing step before applying association mining algorithm to discover frequent nouns and noun phrases (Hu and Liu 2004a, Liu et al. 2005, Popescu and Etzioni 2005).
We should note that, although it is generally acknowledged that the most frequently described features are nouns and noun phrases (Scaffidi et al. 2007), in reality reviewers do use a wide range of language constructs to describe the product. For example, consider the following sentence from a digital camera review: “A little noisy in low light, for example on cloudy days, grass will lack sharpness and end up looking like a big mass of green.” This sentence gives an evaluation of the camera’s picture quality even though the feature itself is never explicitly mentioned. Some techniques for discovering implicitly described product features have been developed; for example, one can use a classifier (Ghani et al. 2006) that determines whether a particular feature is discussed (implicitly) in the review or not.
Nevertheless, due to the inherent complexity of the natural language, so far no text mining technique has proved to be as efficient in feature extraction as humans can be, especially when dealing with complex constructs such as implicitly described features. As the precision and recall of our text mining technique are directly related to the level of noise in the extracted signals that are later used to test the theoretical framework, it is important to use a high quality feature extraction method.
Towards this goal, we decided to rely on a “human-powered computing” technique, and use a semi-automatic human intelligence approach instead of a fully automated approach. In particular, we used the Amazon Mechanical Turksystem to distribute feature extraction assignments to workers. Amazon Mechanical Turk is an online marketplace, used to automate the execution of micro-tasks that require human intervention (i.e., cannot be fully automated using data mining tools). Task requesters post simple micro-tasks known asHITs(human intelligence tasks) in the marketplace. Workers browse the posted micro-tasks and execute them for a small monetary compensation. The marketplace provides proper control over the task execution such as validation of the submitted answers or the ability to assign the same task to several different workers. It also ensures proper randomization of assignments of tasks to workers within a single task type.
Digital Cameras “auto shake”/image stabilization, battery life, design, ease of use, flash, LCD, lens, megapixels, picture quality, shooting modes/variety of settings, size, video quality, zoom
Camcorders battery life, battery life, ease of use, LCD, picture/image quality, weight/size, video quality, audio quality, digital effects/enhancements, support of different output formats
PDAs design/feel, display/screen, camera, weight/size, durability/robustness, email/web-surfing functions, orga-nizer functions, tech.support, synchronization with PC, bluetooth support, Wi-Fi support, other software Table 2 Product features identified in each product category
There is a lot of evidence that users who contribute content on AMT are very representative of the general population. Specifically, the population of users that participate as workers on Mechanical Turk are mainly US residents, with an income and education distribution similar to the general population of online users.6
Snow et al. (2008) review recent research efforts that use Mechanical Turk for annotation tasks, and also evaluate the accuracy of “Turkers” for a variety of natural language processing tasks. They conclude that the non-expert users of Mechanical Turk can generate results of comparable quality as those generated by experts, especially after gathering results for the same micro task using multiple Turkers. Sheng et al. (2008) describe how to effectively allocate tasks to multiple, noisy labelers (such as those on Mechanical Turk) to generate results that are comparable to those obtained with non-noisy data.
To identify important product features in each of the three categories, we conducted a small pilot study. First, for each product category, we selected a random sample of 50 reviews. For each review we posted a HIT asking users to identify the product features described in the review and report them in free text format; each review was processed by three independent workers. The resulting list of top-20 popular features for each product category in our dataset is given in Table 2.
3.2. Comparing AMT with Automated Text mining
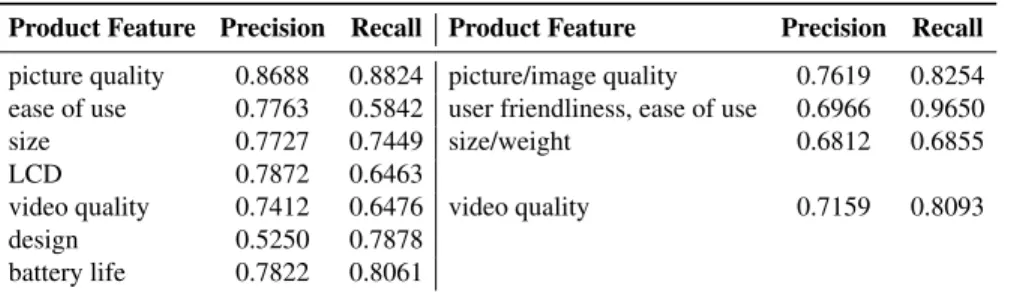
While in the rest of the paper we will use the results obtained with semi-automated data processing technique (i.e. AMT), one, in general, can scale AMT by using supervised learning algorithms. The main idea is to use small dataset obtained from AMT as a training set of a machine learning algorithm that can recognize whether a particular product feature is mentioned in a product review. Although evaluation of this technique is beyond the scope of this paper, we have implemented a simple experiment to estimate potential precision and recall of such classifier. We have used well-known Support Vector Machines, in particular, the SVMLight
6
Product Feature Precision Recall Product Feature Precision Recall picture quality 0.8688 0.8824 picture/image quality 0.7619 0.8254 ease of use 0.7763 0.5842 user friendliness, ease of use 0.6966 0.9650
size 0.7727 0.7449 size/weight 0.6812 0.6855
LCD 0.7872 0.6463
video quality 0.7412 0.6476 video quality 0.7159 0.8093
design 0.5250 0.7878
battery life 0.7822 0.8061
Table 3 Precision and recall values for automated product feature identification on our dataset.
implementation (Joachims 1999) for classification. As a set of features we have chosen the top-250 most popular terms from the review corpus, after eliminating stopwords. We used a linear kernel with default settings. As the evaluation criteria, we used the precision and recall values obtained by leave-one-out cross validation Sheng et al. (2008). The results for digital cameras and camcorders are given in Table 3. We should emphasize that labels were provided by AMT results, so a certain fraction of errors in SVM predictions is due to the noise in the AMT output. As one can see from the results, while the performance of fully automated techniques is sufficiently high and has the potential to be improved7, it is still inferior to the labeling quality
achieved using AMT.
3.3. Identifying Customer Opinions
Of course, identifying product featuresper seis not the end goal. The important goal is to understand what the customer’s opinion is about each of the identified product features. After identifying the product features, we need to identify users’ opinions about the features that are embedded in the reviews. Each information signal is essentially a phrase expressing the opinion of a single reviewer about the quality level of a certain product feature. Prior work has shown that in most cases consumers use adjectives, such as “bad,” “good,” and “amazing” to evaluate the quality of a product characteristic (Hu and Liu 2004a, Turney and Littman 2003). Therefore, the process of extracting user opinions can, in general, be automated. We can use a syntactic dependency parser to select the adjectives that relate to a noun or a phrase that we have identified as a product feature. This kind of an automated tool would produce a set of noun phrases for each review that corresponds to pairs of product features and their respective evaluations contained in the review.
7Better performance could be obtained by using top K eigenvectors from SVD of review - term matrix as features or tuning
As we were concerned with precision and recall of our opinion identification technique and as we were also interested in opinions that are not represented by adjectives and simple phrases, we used the semi-automated technique in our empirical application of analyzing reviews. We used the Amazon Mechanical Turk (AMT) system to distribute review processing assignments to workers. Each assignment contained the review text for a single product and a list of product features identified in the previous step. Workers were responsible for reading the review thoroughly and extracting opinion phrases evaluating any feature in the given list. The answers were returned in free-text format, and the workers were asked not to change the wording used in the original review. Each review was processed independently by two different workers. That allowed us to calculate the inter-rater reliability. In our empirical study inter-rater reliability was 34.27%, as measured by the Jaccard coefficient. That is, in more than one third of all cases two workers processing the same review reportedexactly the sameevaluation phrase for a particular product feature.8
After all opinions were extracted, we retained the top-20 most popular opinion phrases for each product category (see table in Online Appendix). It is useful to mention that the most frequent opinions are generally positive because consumers tend to use standard opinion phrases to describe their positive impressions from using the product but use longer and comparatively far less standardized sentences to describe their negative experiences. Subsequently, in Section 5 we discuss how to address this problem.
3.4. Structuring the Opinion Phrase Space
In Section 2, we derived Equation 3 which relates changes in the market share for the productjto quality signals received by consumers:
log( ¯sj) = log(sj) + n X k=1 βk Pmk i=1(x (k) i −µ (k) 0 ) mk+η + ∆ Var. (4)
Here,βk is the marginal utility ofk-th product feature to consumer,{x
(k)
i } mk
i=1 represents the total set of signals fork-th feature received by consumers and∆ Varcaptures change in the variance of the beliefs.9We 8
While this reliability score may be considered low for conventional surveys where participants reports answers on numeric Likert-type scales, this is a good agreement score for free-text matching. Note that only for “picture quality” feature we identified 1,424 different evaluation phrases in consumer reviews, 197 of which were used more than once; it is significantly more difficult for two readers to selectexactlythe same phrase than to select the same number on a scale from one to five. Notice that we were checking foridenticalphrases to compute the inter-rater agreement and did not resort to substring or approximate matching. So this implies, for example, that “very good” and “very good!” will be considered non-identical phrases.
9
would like to estimate Equation 4 but, so far, we only managed to extract features and opinion phrases from consumer review text. In order to assign meaning to Equation 4, we should be able to convert evaluation phrases like “good” and “bad” to numeric valuesx(ik). The most natural approach to do that is to assume
that there is some hidden, implicit value behind each evaluation. For example, a review mentioning “good design” implicitly assigns a score (represented by the evaluation “good”) to the product feature “design”. Therefore, a consumer reading the review10 will receive a signalx(“design00)
i =Score(“design
00,“good00),
whereScore:F×E →Ris some unknown mapping from the set of features (F) and the set of evaluations (E) to a real number. It is useful to note that Score is a function of both feature and evaluation phrases. Hence, the same evaluation may have different scores when applied to different features. For example, the evaluation “good” when applied to the product feature “design” may have a different score compared to when the same evaluation is applied to the feature “ease of use”. Next, we rewrite Equation 4 using our
Scorefunction: log( ¯sj) = log(sj) + X f∈F βf P e∈EN(f, e) Score(f,e)−µf0 η+P e∈EN(f, e) + ∆ Var, (5)
whereN(f, e)represents the number of times evaluationewas used for the featuref,F is the set of product features, andE is the set of evaluation phrases.
Equation 5 has an interesting and novel interpretation. Traditional consumer review mining approaches consider extracted product features and opinions as simple sets and impose no algebraic structure on them. We propose that we canmeaningfullydefine a vector space structure for consumer reviews. Each opinion phrase (for example, “great synchronization with PC”) will represent a single dimension of a consumer review, and the value of each dimension is the number of times the corresponding opinion phrase occurred in the review text, normalized by the number of times the corresponding feature was evaluated in the review text:
w(feature,evaluation) = N(feature,evaluation)
η+P
e∈EN(feature,e)
. (6)
This idea can be illustrated with a simple example.
10Notice that we do not care about the
intended scoreof the personwritingthe review but only for theperceived scorethat the readers receive after reading the review.
EXAMPLE1. Consider the following review for a digital camera: “The camera is of high quality and relatively easy to use. The lens is fantastic: bright and clear! I have been able to use the LCD viewfinder... To summarize, this is a very high quality product.” This review can be represented by an elements of the consumer review space with the following weights (assumeη= 0for this example):w(quality,high) = 1/1 = 1.0, w(use,easy) = 1/1 = 1.0, w(lens,fantastic) = 1/3 = 0.33, w(lens,bright) = 1/3 = 0.333,
w(lens,clear) = 1/3 = 0.333,
Notice that each opinion phrase dimension has a weight coefficient determining its relative importance in the review. Since the featurequalityis evaluated once in the review, (“high quality”), the weight of the evaluation is 1.0. In contrast, the featurelenshas three evaluations (fantastic,bright,clear) therefore the weight of each evaluation is1/3.
If we employ this particular representation of consumer reviews, the impact of the product reviews on the market share of that product can be modeled simply as a linear functional from the space of consumer reviews. log( ¯sj) = log(sj) + X f∈F X e∈E
Ψf,e·w(f, e) + ∆ Var, where Ψf,e=βf Score(f,e)−µ f
0
. (7)
We can make a few interesting conclusions from Equation 7. First, note that it is not the absolute evaluation score but thedifference between the evaluation score and the expected feature quality (µf0)that affects product sales. This implies that sales decrease when product qualities do not match consumers’ expectations. A mismatch with expectations may happen either because the product quality is too low (lowScore(f,e)) or consumers’ expectations are too high (highµf0). Also, while the natural interpretation ofβf is the weight
or importance of the featuref to consumers, andScore(f,e)is the evaluation strength, in general, it is analytically far less tractable to separate the two as they typically modify each other. What we can estimate using hedonic-like regressions is the productβf Score(f,e)−µ
f
0
, and we describe that in the following sections.11
11Such a separation is possible under additional assumptions about independence of features and evaluations that we make in our
4.
Econometric Analysis
In this section, we describe the empirical evaluation of our model based on a dataset of product sales and consumer reviews retrieved from Amazon. We will start by describing our data, and then proceed to describe the estimation approach and conclude with the discussion of the results obtained.
4.1. Data
We gathered data on a set of products using publicly available information at Amazon.com. The data set covered three different product categories: “Digital Cameras” (41 products), “Camcorders” (19 products), and “PDAs” (85 products). During a 15-month period (from March 2005 to May 2006), we collected daily price and sales rank information for the products in our data set, using the API provided by Amazon Web Services. Each observation contains the collection date, the product ID, the retail price on Amazon, the sales rank of the product, the product release date, and the average product rating according to the posted consumer reviews. Additionally, we used Amazon Web Services to collect the full set of reviews for each product. Each product review has a numerical rating on a scale of one to five stars, the date the review was posted and the actual text posted by the reviewer.
Note that Amazon does not report the actual demand values for the products being sold on its web site. Instead, Amazon reports a sales rank for each product, which can be used as a proxy for demand based on prior research in economics and in marketing (Chevalier and Goolsbee 2003, Ghose and Sundararajan 2006). These studies have associated these sales ranks with demand levels for products such as books, software and electronics. The association is based on the experimentally observed fact that the distribution of demand in terms of sales rank has a Pareto distribution (i.e., a power law) (Chevalier and Goolsbee 2003). Based on this observation, it is possible to convert sales ranks into demand levels using the following log-linear relationship:ln(D) =a+b·ln(S), whereDis the unobserved product demand,Sis its observed sales rank, anda >0,b <0are unknown industry-specific parameters. Therefore, in the rest of the empirical analysis we will use sales rank as a proxy for unobserved product demand.
4.2. Estimation technique
Our theoretical model suggests that one could use a first-difference (FD) estimator (Wooldridge 2001) to estimate the impact of reviews on sales. In other words, for each consumer review we can regress the
differences in product demand before and after the review was published on the information contained in this review. Unfortunately, the FD estimator has limitations when extended to a multi-period scenario due to the reasons described below.
In our data, we have a series of observations on sales and review data for each product. Hence, Equation 7 needs to be rewritten to emphasize both the time and panel structure of the data:12
log(sj,t) = log(sj,t−1) + X f∈F X e∈E Ψtf,e−1,twt−1,t(f, e) + ∆ Var, (8) where Ψtf,e−1,t=βf Score(f,e)−µ f t−1 , wt−1,t(feature,evaluation) = Nt−1,t(feature,evaluation) ηt−1+Pe∈ENt−1,t(feature,e) (9)
In the equations above we use thevart1,t2 notation to represent changes in the variable “var” from period
t1to periodt2, andvartto represent value of the variable “var” at timet. In particular, if we sett≡1, the set
of equations immediately collapses to a two-period model. We can now see why FD estimator does not work in multiple periods: not only the data but also the model coefficients are time varying. Even if we assume that consumers have common initial priors (same mean expectations for product featuresµf0 and the same strength of prior beliefsη0) as they receive more information from product reviews, their expectations will change over time as reflected by time subscripts inµft−1andηt−1. This means that coefficients of the first difference regression (Ψtf,e−1,t) are time varying. Therefore, instead of contrasting demand at timetand time
t−1, we contrast demand at timetand time0by taking into account all the information that was available during that time interval. Essentially our proposal is to use the well-known fixed effects (FE) panel data estimator (Wooldridge 2001): log(sjt) =dj+ X f∈F X e∈E
Ψf,ewt(f, e) +γ1log(pjt) +γ2rjt+γ3log(njt) +γ4ajt+εjt, (10)
wheresjtis the demand for productjat timet,dj is the product-specific fixed effect,pjtis the price for
productjat timet,rjtis the average review rating for the productjat timet,njtis the number of reviews
12By simply extending a two-period model to one with multiple periods we assume that consumers are not forward-looking. In other
published for productjbefore timet,ajtis the product age at timet, andwtrepresents consumer review
signals received before timetencoded as specified by Equation 6.
Note that we add a set of control variables to take into account demand changes that could be due to other external factors. In particular, we include the Amazon retail price to control for changes in demand due to changes in prices. We also control for product age as products tend to become less popular with time. Finally, because all reviews on Amazon provide a numeric review rating on a scale of 1 to 5, we control for the average review rating and the total number of reviews as they provide additional information on product quality to all consumers.13 Note that our interest is not in showing the effect of numeric review ratings
on consumer buying decisions (Chevalier and Mayzlin 2006), but in examining how thetextualcontent of reviews influences consumer decisions, above and beyond the information contained in numeric ratings.
Under the assumption that residualsεjtare uncorrelated with the regressors, the model can be estimated
using a fixed effects estimator (Wooldridge 2001). However, there might be some unobservable exogenous shocks that simultaneously affect prices set by firms as well as buying decisions made by consumers. Further, there could be some external factors that influence both consumer reviews and product demand, such as advertising. Hence, using ordinary least squares will therefore overestimate the direct effect of consumer reviews on product demand.
We used two additional pieces of data to address these potential issues. First, we used data on the “product search volume” of different products from Google Trends to control for exogenous demand shocks. For each product, we retrieved the search volume from Google Trends website. As there are strong seasonal effects in product sales (see Figure in Online Appendix), in order to differentiate between idiosyncratic product shocks and seasonal effects common to all products, we also included monthly dummies as control variables.
Second, we used instrumental variables (IV) with Two Stage Least Squares to address possible endogeneity in prices (Wooldridge 2001). Due to the limited supply of available instruments, we fol-low Villas-Boas and Winer (1999) and use lagged prices as instruments.14 Finally, we should note that 13
Alternatively, we also tried a specification in which we controlled for the fraction of reviews of the highest and the lowest rating, similar to (Chevalier and Mayzlin 2006). Our results were qualitatively similar to those currently presented.
14
The lagged price may not be an ideal instrument since its possible to have common demand shocks that are correlated over time. Nevertheless, common demand shocks that are correlated through time are called trends, and our control for trends using search volume data disposes of most, if not all, such concerns.
our fixed effects model (Equation 10) is slightly non-linear. The coefficients wt(f, e) depend on the
unknown parameterη:wt(feature,evaluation) = Nt(feature,evaluation)
η+P
e∈ENt(feature,e). Hence, we adopt a maximum likeli-hood approach for estimation. That is,ηis chosen to maximize the model likelihood. Note that for the panel data model with fixed effects, this is equivalent to maximizing the “within-R2” value.
4.3. Results
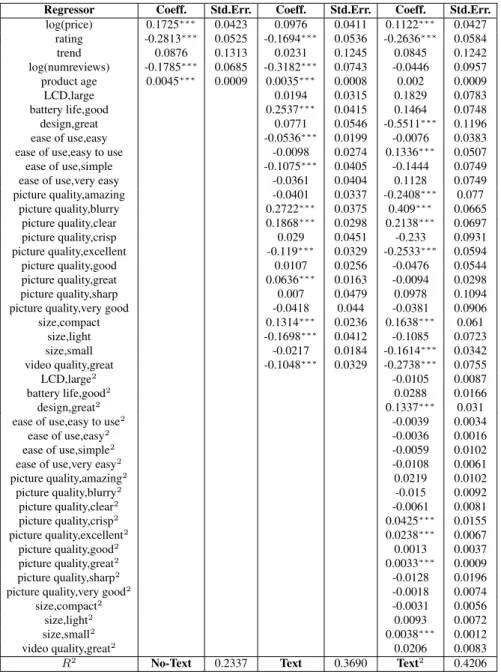
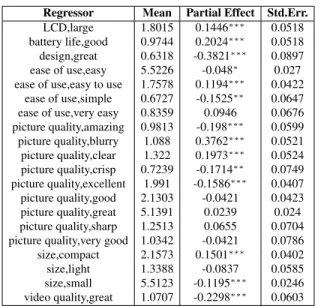
In this section, we present the results for each product category. For each category, due to limited size of our sample we only used the top-20 most popular textual evaluations. We provide the estimates from the 2SLS regression with IV. The results of the fixed effects estimator without instrument variables are qualitatively very similar. The estimation results are given in the Tables 8, 10 and 7. In digital cameras and camcorders, we found significant non-linear effects of consumer opinions. Hence, for these two categories, we also report the regression output with quadratic terms and corresponding partial effects (see Tables 9 and 5) calculated at the mean values of the regressors. Note that because on Amazon higher demand values correspond to lower sales ranks (with rank 1 being the most popular product), negative coefficients of model parameters correspond to positive effects on product demand.
Significance of text content:Our first key research objective was to investigate whether textual infor-mation embedded in product reviews influences purchases beyond the use of numeric ratings. For each model, we conducted an F-test of the model with textual variables against the same model without textual information. In all three cases, an F-test shows that we cannot reject the text model hypothesis at 1%
significance level. In particular, the results in the “Digital Cameras” product category were very strong. By using thetop−20opinion phrases to our model, theR2of the mean-deviated regression increased from
0.23to0.42. An F-test of non-linear terms for the “Digital Cameras” and “Camcorders” categories shows that the non-linear terms are statistically significant. We have also carried out our empirical estimations with thetop−50most popular opinion phrases and found that the qualitative nature of the results remain the same. Moreover, the increase in R-square (betweentop−20andtop−50) is marginal (less than3%).
Effect of control variables:We can make several inferences from the regression coefficients and the partial effects. Note that the signs of the coefficients of the numeric variables are in accordance with what one
would expect. The coefficient on log(price) is positive implying that higher product prices decrease product sales. Similarly, a higher average review rating and a higher number of reviews lead to increase in sales. Also the sign of the coefficient for product age is positive implying that products tend to become less popular with age. In the “Camcorder” category, a high trend value is strongly significant. However, the trend coefficients are not significant for other two categories after we control for seasonality effects using monthly dummies. Partial effects of text content:The relatively more interesting results, however, are related to coefficients and partial effects for the text-based data. In the “Digital Cameras” category we can see that the strongest positive evaluations are those related to “great” design, superior picture quality (“amazing”, “crisp”, “excel-lent”), “great” video quality, “small” size and “simple” ease of use. In the “Camcorders” category consumers care mostly about “compact” camera size and “excellent” video quality. “Compact” size is also important for PDAs, as well as Wi-Fi support, organizer functions and “other software”. In the “Digital Cameras” category, a bad evaluation such as “blurry picture quality” has strong negative effect on sales. Furthermore, and more interestingly, average evaluations (“clear”, “sharp” or “good”) are also perceived as negative or are statistically insignificant. In general, we can see that “good” is frequently not enough to make a positive impact on sales; in the “Camcorders” category only “excellent” evaluation for “video quality” seems to be positive while “good” and even “great” are expected to have negative effect on sales. It seems that consumers of camcorders havestrong prior expectationsabout the product video quality, and in our model it is the difference between the signal and the prior expectation that defines the influence of a consumer review.
Note that the sign on some coefficients is perhaps contrary to what one would normally expect. For example, we find that “great” battery life and “beautiful” display screen are perceived as strongly negative evaluations for PDAs. It is possible that this may be due to the fact that from a buyer’s perspective, a “good” evaluation is not sufficiently strong enough to warrant an increase in sales. Further, it is also possible that there might be some information that we are missing from not including some variables in the regressions. In Section 5, we discuss model limitations and extensions that can be used to address them.
Out of sample test: To ensure that predictive power of the results is robust to model mis-specifications we perform ten-fold cross validation (Kohavi 1995). The sample was randomly split into ten sections of
equal size and each section was used once as a test set for the model learned on the rest of the data. During sampling we did not preserve product boundaries, and so data for a single product could have been split to multiple sections. In order to avoid potential issues with estimating product dummies from the whole dataset, we first removed the dummies by taking the first observation for each product and subtracting it from all other observations for the same product. We found no over-fitting in the data i.e. for each dataset the average
R2across ten runs on the out of sample data was close to theR2of regression on the whole sample.
5.
Extensions
In the previous section, we demonstrated that consumer opinions have a significant effect on product sales, and we estimated coefficients of the consumer’s utility function by relating changes in product sales to changes in the content of consumer reviews. We noticed however some noisy results in some coefficients: given the high dimensionality of text data it is often unavoidable that some variables will capture noise and not only the underlying signals. In this section, we discuss an extension to the core model that explicitly address any potential loss in information from omitted opinion-feature phrases.
Since the set of opinion-feature expressions extracted from online user-generated content is typically very large, it is infeasible to include all possible opinion phrases in our regressions. Therefore, during the regression we might get estimates that alsoinclude the projection of some omitted variables. For example, in the Table 7 we can see that “beautiful” and “excellent” display/screen are perceived as negative PDA evaluations by consumers. We may argue that highly positive evaluations for PDA display might frequently co-occur with negative evaluations of PDA size in consumer reviews (like a person saying “this PDA has a great display but its too big and heavy”). From the regression, we can see that “compact” size is important for consumers of PDAs, but negative evaluations of the PDA size are not present in the regression. We often miss some of the negative evaluations in the regression because negative phrases are not posted using standardized noun phrases; instead consumers have different ways to express in text their dissatisfaction and the negative phrases are, inherently, infrequent.
Indeed in our data, we observe that when people are satisfied with a product, they tend to express their satisfaction in more or less the same way, using standardized phrases such as “great design”, “good pictures”,
etc. On the other hand, when they are dissatisfied with their purchase, they frequently start describing their negative experiences in detail, using idiosyncratic phrases. Such phrases cannot be reliably extracted to the extent we would like to. Still, we can alleviate the potential shortcoming of missing out product related information from the review text by at least two different approaches. Below we describe the techniques that can be used, and present our experimental results for one of them.
5.1. Decoupling Evaluations and Product Features
The first technique involves including more regressors. For example, we could include the top-1000 phrases instead of the top-20 phrases. However, this requires us to make additional assumptions about the parameter space to reduce the dimensionality of the problem. Recall that for model coefficients we have Ψf,e=
βf Score(f,e)−µ f
0
. We can assume that the score of each evaluation is independent of the feature being described. For example, the strength of the evaluation “great” (as compared to the strength of other evaluations like “good”) should be the same for both “picture quality” and “video quality” features. Formally, this can be written as
∀f1, f2∈F, e∈E Score(f1,e) =Score(f2,e)≡γe.
In other words, the score assigned by an evaluation is independent of the feature that it evaluates. ForN
features andMevaluations, the number of model parameters is therefore reduced fromM N to2M+N. The regression equation now becomes
log(sjt) =dj+ X f∈F X e∈E βfwt(f, e) γe−µ f 0 +γ1log(pjt) +γ2rjt+γ3log(njt) +γ4ajt+εjt.
Note that such a model has the additional benefit of allowing us to separate the feature weight (βf) from
the evaluation score (γe) and the expected feature quality (µ f
0), which was not possible before. Also, the model should give satisfactory performance as long as matrixΨf,ehas a good rank-1 representation (that is,
singular values other than the first one are small).
Figure 2 below shows an basic example of the relative importance of features and evaluations. Based on the changes in product demand after receiving the corresponding reviews, we can infer that the feature “photos” is twice more important than “lens.” Analogously, while the evaluation “excellent” is positive, the evaluation
Figure 2 Impact of Evaluation-Feature Pairs on Demand
“poor” is negative. Furthermore, based on the magnitude of changes, we can conclude that “Excellent” is three times stronger than “poor” in influencing demand for digital cameras.
5.2. Clustering Evaluation Phrases
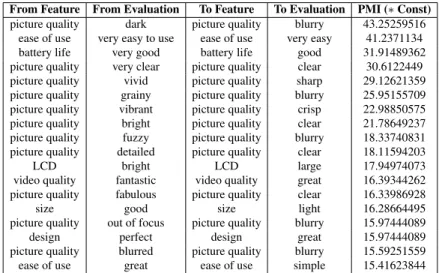
The second approach does not place strong assumptions on the parameter space and instead, relies on a nonparametric, data-centric approach. In this approach, we keep the number of regressors constant, and instead perform clustering or remapping of omitted variables to include them into the regression. In our case, we use a technique based on statistical properties of the data.15 In particular, we use the concept ofpointwise
mutual information (PMI)(Turney 2002) to measure distance between two opinions. For each evaluation like “out of focus” (as applied to “picture quality”) we calculated its PMI value with all top-20 regressors using the following formula:
P M I(f, e1, e2) =
Count(f, e1, e2) Count(f, e1)Count(f, e2) +s
, (11)
where Count(f, ei) is the number of consumer reviews containing the evaluation ei for feature f,
Count(f, ei, ej)is the number of consumer reviews containing both evaluationeiandejfor featuref, ands
is some smoothing constant. Finally, we mapped all the evaluations in the tails to their nearest neighbors using the PMI distance method. In our example, “out of focus” picture quality will be mapped to “blurry” picture quality as shown in the Table 6. The table lists a sub-sample of mappings used for “Digital Cameras.” Table 4 presents the partial effects for the “Digital Cameras” category obtained with clustering of the tail evaluations. Comparing them with Table 9, we find that most of the results are not significantly different, although some of partial effects are affected. For example, “ease of use, very easy” is now a significantly
15
positive evaluation, while it was negative but insignificant previously. Similarly, “size, compact” does not have a statistically significant and negative effect anymore. Similarly, Table 5 presents the partial effects for the “Camcorders” category. These results highlight the benefits from using such clustering techniques.16
We believe that further advances in the field of natural language processing that will allow us to reliably detect synonyms and cluster together phrases that have the same conceptual meaning, will allow further improvements in our technique.
6.
Managerial Implications and Conclusions
To the best of our knowledge, we are the first to combine a multi-attribute choice model with a text mining technique to study the influence of textual product reviews on brand choice decisions. Using a unique data set from a leading online retailer of electronic products, Amazon.com, we demonstrate the value of using text data and econometric modeling for quantitative interpretation of user-generated content on the Web. Our empirical analysis helps identify which product features described in product reviews are most important to consumers and how one can quantify opinions contained in the textual component of reviews. The results of our study indicate that the textual contents of product reviews have significant predictive power for consumer behavior and explain a large part of the variation in product demand over and above the impact of changes in numeric information such as product price, product age, trendiness, seasonal effects, the valence and the volume of reviews.
Our technique can be of interest to manufacturers and retailers in order to determine which features contribute the most to the sales of their products. Such information, for example, can help manufacturers facilitate changes in product design over the course of a product’s life cycle as well as help retailers decide on which features to promote and highlight in advertisements and in-store displays. Our paper also provides some insights to online advertisers who aim to use customer-generated opinions to automatically devise an online advertising strategy for each product using the widely popular model of sponsored search advertising. For instance, our methods can be extrapolated to different product categories in order for firms to select the
16We note that we are unable to present the partial effects for PDAs because the majority of the opinion phrases appears in the tail of
appropriate keywords to bid in these advertising auctions, and for selecting the most pertinent text in the advertisement that highlights the differentiating characteristics of the advertised products that consumers value the most.
We should note that methodology presented in this paper possesses flexibility, in particular, related to the assumptions about the nature of the learning and choice processes used by consumers and the expressive power of the natural language. To the best of our knowledge, our paper is the first such application and it provides encouraging results by showing that even a simple choice model combined with a simple text mining techniques can have significant explanatory power. Overall, the interaction of economics and marketing models with text mining tools from natural language processing can benefit both fields. Economic approaches can offer natural solutions to text mining problems that seemed too hard to solve in a vacuum (e.g., determining the strength of an opinion). Similarly, text mining approaches can improve the current state of the art in empirical economics, where the focus has traditionally been on relatively small, numeric data sets.
While we have taken a first step in several directions, we acknowledge that our approach has several limitations, some of them outlined during the presentation of our theoretical framework and others borne by the nature of the data itself. Our work attempts to combine econometric modeling with text mining techniques, and can benefit from parallel improvements in both fields. In particular, the methodologies presented in this paper can benefit from improvements in choice modeling and in text mining. Better techniques for handling absence of individual level data, overcoming sparsity of textual review contents, improvements on natural language processing algorithms, and better techniques for handling noisy information on product sales would all result in improvements of our own work. We discuss some of the limitations below.
• Our model of Bayesian learning assumes that consumers learn independently across attributes and independently for each product. In reality, consumers may learn about quality levels across attributes or even across products. Application of more advanced models of learning with uncertainty can potentially improve the accuracy of our estimates.
modeling. For example, we use sales rank as a proxy for demand (in accordance with prior work). Future work can look at real demand data, which unfortunately are harder to find.
• Our sample is also restricted in that our analysis focuses on the sales at one e-commerce retailer. The actual magnitude of the impact of review information on sales may be different for a different retailer.
• Finally, this paper concentrates on a macro-level relationship between consumer reviews and product sales. Our approach can be applied to individual or household level data if it were available. Extending the results to micro-level setting seems to be an interesting topic for future research as it will allow estimating the interaction effects between consumer characteristics and consumer preferences.
Notwithstanding these limitations, we hope our paper paves the way for future research in this domain.
References
Berry, Steven, James Levinsohn, Ariel Pakes. 1995. Automobile prices in market equilibrium.Econometrica63(4) 841–890. Bickart, Barbara, Robert M. Schindler. 2001. Internet forums as influential sources of consumer information.Journal of Interactive
Marketing15(3) 31–40.
Bradlow, Eric T., Ye Hu, Teck-Hua Ho. 2004. A learning-based model for imputing missing levels in partial conjoint profiles.
Journal of Marketing Research41(4) 369–381.
Carenini, Giuseppe, Raymond T. Ng, Ed Zwart. 2005. Extracting knowledge from evaluative text.K-CAP’05: Proceedings of the 3rd International Conference on Knowledge Capture. 11–18.
Chen, Chan-Fu. 1985. On asymptotic normality of limiting density functions with bayesian implications. Journal of the Royal Statistical Society47(3) 540–546.
Chen, Pei-Yu, Samita Dhanasobhon, Michael D. Smith. 2007. All reviews are not created equal: The disaggregate impact of reviews and reviewers at Amazon.com.International Conference on Information Systems (ICIS).
Chen, Yubo, Jinhong Xie. 2004. Online consumer review: A new element of marketing communications mix. Working Paper. Available athttp://ssrn.com/abstract=618782.
Chevalier, Judith A., Austan Goolsbee. 2003. Measuring prices and price competition online: Amazon.com and BarnesandNoble.com.
Quantitative Marketing and Economics1(2) 203–222.
Chevalier, Judith A., Dina Mayzlin. 2006. The effect of word of mouth on sales: Online book reviews.Journal of Marketing Research
43(3) 345–354.
Das, Sanjiv Ranjan, Mike Chen. 2007. Yahoo! for Amazon: Sentiment extraction from small talk on the web.Management Science
53(9) 1375–1388.
Dave, Kushal, Steve Lawrence, David M. Pennock. 2003. Mining the peanut gallery: Opinion extraction and semantic classification of product reviews.Proceedings of the 12th International World Wide Web Conference (WWW12). 519–528.
Dellarocas, Chrysanthos, Neveen Farag Awad, Xiaoquan (Michael) Zhang. 2007. Exploring the value of online product ratings in revenue forecasting: The case of motion pictures. Working Paper, Robert H. Smith School Research Paper.
Duan, Wenjing, Bin Gu, Andrew B. Whinston. 2008. Do online reviews matter? An empirical investigation of panel data.Decision Support Systems.
Eliashberg, Jehoshua, Sam K. Hui, Z. John Zhang. 2007. From story line to box office: A new approach for green-lighting movie scripts.Management Science53(6) 881–893.