IMPLEMENTED BY:
THE AFRICAN CONSERVATION CENTRE
Nairobi KENYA
With Support from
Collaborating Partners
Report Compiled by Lucy WARUINGI
December 2010
RCMRD
RCMRD
2 1. PROJECT OVERVIEW
The USAID/SERVIR-AFRICA Biodiversity project implemented by the African Conservation Centre through RCMRD seeks to expand the knowledge of vulnerability of biodiversity to climate change at a national scale. A key component of this project is to fill the vast knowledge gaps that exist on the distribution of Biodiversity in this region and to refine the various climate change models with a view of better understanding the vulnerability of our biodiversity.
2. PROJECT SUMMARY
The Servir Africa Biodiversity project has worked collaboratively with Regional Centre for Mapping of Resources and Development (RCMRD), National Museums of Kenya, Missouri Botanical Gardens-USA, University of York-UK, University of California, San Diego and Department of Ecology and Evolutionary Biology -Yale University which continue to provide technical support at all stages of the project.
The support extended to ACC by the SERVIR/AFRICA grant has primarily been for Information gathering and model building, building local capacity and national networks, and the
development of web enabled tools and products. Most of the effort of the project has gone into providing support to the National Museums of Kenya to build capacity and digitize the priority taxonomic information for flora and fauna required for the climate change assessments. 3. PROJECT APPROACH
The Project has the broad aim of using indicator plant and vertebrate species to identify priority locations in East Africa for conservation of biodiversity within the context of the impacts of climate change on species / ecosystem distribution. Work on the vegetation and vertebrate components continues alongside the land-use components of the project, with the ultimate aim to link the three components into one holistic, integrated, science-based conservation initiative to ensure sustainable management of East African ecosystems under climate and land-use change.
4. PROJECT STATUS
4.1 COLLATING AND COMPILING BIODIVERSITY DATA FOR KENYA
In order to ensure the availability of appropriate expertise for the databasing of taxonomic records we conducted a training workshop for the interns who would be responsible for this process. A three day training was held in March 2010 to develop the capabilities of the interns and other NMK staff involved in Biodiversity databases development and management. Hence the trainees were drawn from over 10 sections of Zoology and Botany Departments.
Specifically, though, the training aimed at imparting in participants, the practical and theoretical skills for use in capturing biological collections data including geo-referencing and quality that would be used to support modeling for the climate change. A full training workshop report is attached (Annex 1)
3
4.2 DETERMINING VULNERABILITY OF BIODIVERSITY TO CLIMATE CHANGE
a) Predicting East African Plant Distributions using climate data - Plants are often overlooked in conservation planning, yet they are the foundation of all terrestrial ecosystems. Species distribution modelling using herbarium specimen data provides a method for predicting plant distributions, but data are often insufficient in spatial coverage and number of
records. We applied species distribution models to selected well-collected plants across the East African landscape and a 60,000 km2 area across the Kenya-Tanzania border. The borderlands area hosts extremely rich vertebrate diversity and incorporates 14 world-renowned National Parks such as the Serengeti and Maasai Mara, attracting over 1.5 million visitors a year. In recent decades, rapidly growing human populations and land
fragmentation have restricted wildlife and pastoral movements, causing range loss and aggravating effects of periodic drought. Compounding these human impacts, climate change increasingly poses a serious threat to the biodiversity and sustainable use of the area’s natural capital.
Potential plant indicators of the major ecosystems also exist for a large part of the East African region. Pratt & Gwynne (1977) delineated six eco-climatic zones in Kenya, Tanzania, and Uganda based on moisture indices derived from monthly rainfall and evaporation (Annex2). The eco-climatic zones are well correlated with vegetation and land-use classes, and each eco-climatic zone is represented by a number of characteristic species. We therefore assume that by modelling the distribution of these characteristic species, we can make a reasonable representation of the biodiversity of the region and thus potentially provide a major contribution to reserve network design.
Efforts from the National Museums of Kenya Botany Department were accelerated and from the list of prioritized indicator plant species, 89% were digitally databased and geo-referenced. The same was forwarded to the climate Change modeling team for their analysis - however, there are still 25 species to be digitized in order to have a complete dataset of the indicator species for climate change modeling.
Under this pilot project, we focused on the identification of conservation and research priorities of the genus Acacia based on its vulnerability to changing climate. The
methodology developed here is replicable for other priority indicator plant species. A total of 370 indicator taxa (species, subspecies and varieties) from 326 species were selected to represent a cross-section of eco-climatic zones, habitat specialisation, abundance, and taxonomy. Habitat specialists are included as indicators of biodiversity, while generalists are included to represent the dominant habitat types. For linkage with concurrent vertebrate modelling, the indicators also include taxa that are known to be key dietary species for primates and birds. Plant collection data for the indicator taxa have been collated from five herbaria: East African Herbarium, National Museums of Kenya (Nairobi); Royal Botanic
4
Gardens, Kew (UK); Missouri Botanical Garden (USA); National Herbarium of Tanzania (Arusha); and University of Dar es Salaam (Tanzania). All data were entered into and standardised in the Missouri Botanical Garden’s TROPICOS database (www.tropicos.org). A total of 9,055 plant records have been collated to date. After collation, collection data were processed to remove errors and check for suitability for modelling. Point collection data were converted to raster grid cells with a resolution of 1 arc-minute (1.85 km). Taxa with records in fewer than ten 1-arc-minute grid cells were excluded from analyses due to the requirements of cross-validation procedures necessary for model calibration.
In addition, we collated environmental data for the region at a spatial resolution of 1 arc-minute. Mean (Tmn) and range (Tr) in annual temperature data were obtained from
WorldClim (version 1.4 release 3; Hijmans et al. 2005, http://www.worldclim.org/). Rainfall surfaces were obtained from the Tropical Radar Measuring Mission (TRMM; 2B31 combined PR, TMI profile). From the TRMM data, mean monthly 1-km gridded atmosphere rainfall was calculated from observations spanning the period 1997-2006 (Mulligan, 2006). Annual surface-received orographic rainfall (PPTann) was then determined using wind velocity, slope,
aspect and topographic exposure (Mulligan & Burke, 2005). Potential evapotranspiration (PET) was derived from the TRMM rainfall data using methodology from Thornthwaite (1948). Annual moisture index (AMI) was calculated as the ratio of mean annual precipitation and PET. Maximum water deficit (MWD) was calculated as the highest cumulative deficit in mean monthly rainfall (Thornthwaite, 1948), where a deficit was defined as <30 mm/month based on the median monthly rainfall across all known Acacia sites and across the 12 months of the year.
Slope and aspect data were derived from a digital elevation model (version 4, Shuttle Radar Topography Mission, U.S. Geological Survey; http://srtm.usgs.gov/) and rescaled to 1 arc-minute for compatibility with the TRMM data. Aspect data were converted from circular to linear data by the use of cosine and sine transformation, effectively giving measurements of “northness” and “eastness”. Following collation, all predictor variables were tested for absence of intercorrelation (Pearson r < 0.7) as this may affect model performance. In the event of inter-correlation, the predictor variable yielding the strongest univariate model was retained.
General Additive Models (GAM’s) are used to determine relationships between selected plant taxa and environmental variables. The models produce a geographic probability surface of habitat suitability for each species. Here we present results for three ecoclimatic indicator species, plus 62 taxa from the genus Acacia. The models give mixed results,
according to statistical measures and comparability to known distributions. Ground-truthing is being used to verify model predictions and provide more plant distribution data. Relating these outputs to the protected area network shows that some of the richest Acacia areas lie outside of the national parks. Therefore, many of Africa’s most famous National Parks may not be preserving an important component of ecosystem diversity. Climate change effects
5
will likely amplify the limitations of parks in protecting biodiversity. We discuss the
implications of our findings for plant and animal ecology and the need for a landscape and regional scale approach to conserving biodiversity and managing natural resources. Following the development of predictive models for each taxon,, estimates of biodiversity were compiled based on the mean probability score of all robust models (n=43). These results were compared to the spatial distribution of the existing protected area network and to the geographic spread of herbarium collections. These comparisons help to identify priority areas for the conservation of Acacia diversity and also help to guide ground-truthing expeditions so that model reliability can continually improve.
Climate Change - Climate predictions for 2020, 2055 and 2090 were derived from forecasts made by the Global Circulation Model ECHAM5 that were subsequently downscaled via the Regional Climate Model REMO (Postdam Institute for Climate Impacts Research, Germany). For each climate model we used two scenarios from the Fourth Assessment Report of the International Panel for Climate Change (IPCC, 2007; IPCC-AR4). The first of these (scenario A1B) represents an increase in global temperature, peaking mid-century, following some improvement in greenhouse gas emissions. The second (scenario B1) represents an increase in temperature equivalent to that in scenario A1B, but with more sustained greenhouse gas emissions. Under scenario A1B, global climate is predicted to increase by 1.7-4.4ºC by 2099, and under scenario B1, by 1.1-2.9ºC (Appendix 4). These represent the two most divergent scenarios up to 2055 in terms of temperature and atmospheric CO2.
These climate data were downscaled from 0.5 to 0.0167 decimal degrees (30 arc-minutes to 1 arc-minute; 1.85 km) by imposing the forecast change-factors upon the baseline
temperature and rainfall grids used to model present-day distributions (P.J. Platts, unpublished data). The resulting data were then used to extrapolate the probability of occurrence of indicator taxa within the region, providing six future projections of the impact of climate change on species distributions. To date, climate change projections have been produced for the three eco-climatic taxa and for two of the Acacia species. Similar analyses will be extended to the other selected taxa during phase 3 of the project (Appendix 2). The Distribution Modeling results are here presented for the Acacias (3,042 records; 65 taxa; 46 species) in Annex 3. These species comprise 71.9% of the 64 Acacia species known from the region. The remaining indicator taxa will be modeled as soon as the remaining databasing effort is completed. The predictive success of these models is further supported by expert knowledge on the predicted distribution of Acacia species, which compares favourably with known distributions (Fig. 1).
6
Figure 1. Predicted habitat suitability for (a) Acacia abyssinica subsp. calophylla and (b) Acacia turnbulliana. Scalebar indicates mean climatic suitability from ten repeated model runs. Inset shows known distribution of A. abyssinica subsp. calophylla (black tree icons) and A. turnbulliana (red), adapted from Dharani (2006).
b) Predicting vertebrate distribution modeling - The world is currently undergoing an
extraordinary period of change with dramatic climatic shifts and land-use change projected for this century. The scientific disciplines of ecology and biogeography are challenged to provide the necessary knowledgebase to help minimize loss of biodiversity, services and quality of life. With over 2,700 terrestrial vertebrate species (mammals, birds, amphibians, reptiles) East Africa stands out globally for the wealth and beauty of its biodiversity. About a quarter of this diversity is restricted to the region, and its global safe-guarding is thus fully in the hands of the national institutions. Projections of future climate change now allow preliminary assessments of the potential future threats to biodiversity in the region and how national reserve systems may need to adapt. I highlight species and regions of
particular concern and discuss the consequences for future conservation strategies. Finally, I explain the ongoing need for biodiversity data collection, mobilization and integration that is required to understand and address these imminent threats.
Various interim products were developed of refined species range maps that ultimately will make a great contribution to modeling future scenarios for vertebrates. The first level of assessment used global distribution datasets for East Africa. An E-Africa refinement
7
methodology which was developed by University of Yale using remote-sensing based landcover imagery and DEMs and this was applied to all E-African terrestrial vertebrates. The results though promising are interim products, as the success of the refinement still needs to be validated with the point/survey data from the databasing efforts. We completed entry/accuracy estimation for 87,0000 records for birds, but there is still some way to go. See detailed results in
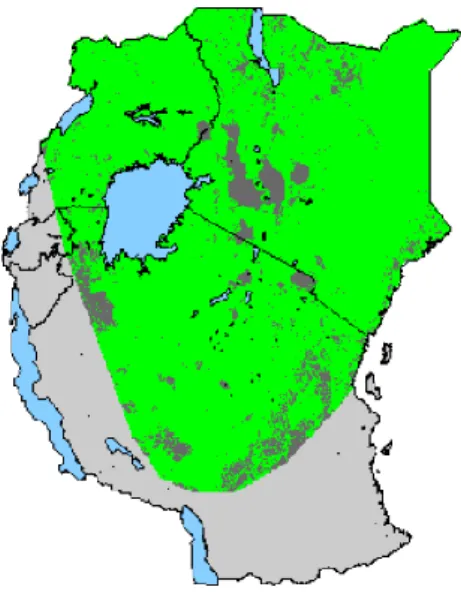
Annex 4. An example of some of the modeling products is below. In the maps below for example, one bird species (struthio camelus, whose common name is Ostrich) on the left map ca. 25km resolution, and right map is 1km resolution. Dark grey is expert range, and the green is the refined range.
Figure 1: Distribution Models for Common Ostrich
c) Compiling complimentary data
Working with the government Dept of Remote Sensing and Resource Surveys (DRSRS) we have acquired use of the national dataset on wildlife densities and distribution patterns. We are working with WRI (World Resource Institute), ILRI and the Ministry of Planning to also access the census and other demographic data and tools for inclusion in the prediction models of land use. We expect to have made progress on this within the next 3 months. Efforts to acquire and classify satellite imagery began in the last half of 2010 in addition to sourcing other complimentary data such as demographic, socio-economic and landuse information for our key focal areas. The table below indicates that status of the available and required satellite imagery based on areas with priority key indicator species.
8 Table 2:
We will be adding additional regions to this baseline based on new refined models for various taxa. Data on national wildlife and livestock densities and trends was acquired as this provides additional parameters for analysis on land use trends. Once the required imagery is acquired in addition to more landuse information we will undertake a change detection analysis of the land cover to determine other emerging anthropogenic threats Acquired and Required Landsat TM and +ETM Satellite Images - Narok and Kajiado Districts
Path Row Direction of Study Area Date Available Required
170 61 West Narok 10/18/1986 √ Jan/Feb 1986/7 √ Jan/Feb 1995/6 √ 5/12/2001 √ Jan/Feb 2006 √ Later Date (2008) √
169 60 North Narok Jan/Feb 1986/7 √
Jan/Feb 1995/6 √
1/27/2000 √
Jan/Feb 2006 √
Later Date (2008) √
169 61 Central Narok West Kajiado 1/28/1986 √
2/6/1995 √ 1/27/2000 √ 2/4/2003 √ 1/27/2006 √ Later Date (2008) √ 168 61 North Kajiado 2/25/1987 √ Jan/Feb 1995/6 √ 2/21/2000 √ Jan/Feb 2006 √ Later Date (2008) √
168 62 South East Kajiado 2/25/1987 √
Jan/Feb 1995/6 √ 2/21/2000 √ Jan/Feb 2006 √ Later Date (2008) √ 167 62 East Kajiado 2/18/1987 √ Jan/Feb 1995/6 √ 3/4/2001 √ Jan/Feb 2006 √ Later Date (2008) √
9
that will exacerbate the possible impacts of changing climate. These results will then be integrated into the climate predictions for various key taxa and provide a planning framework for conservation of critical fauna and flora.
1. BUILDING NETWORKS - International conference on Climate Change
The results outlined above and the processes and partnerships required for mobilizing biodiversity data in order to conserve ecosystem diversity were presented at an
International Conference on Biodiversity, Climate Change and Landuse that was held in Nairobi Kenya in September 2010. There was a session discussing these biodiversity modeling efforts and another looking into how these collaborative effort provides an ideal framework for strengthening and building capacity for Biodiversity Informatics in the region (www.kenyabiodiversityandclimatechange.org). The proceedings of the conference will be going to print in the first quarter of 2011.
5 CHALLENGES AND WAY FORWARD
4.1 The databasing effort with the national museums of Kenya is almost complete with the Botany department but there is still quite some intense effort required in the Vertebrate sections. Though we intended to keep the pace of both departments in tandem, we later realized we needed to focus our efforts in one section and ensure the data capture was properly done and submitted to the modeling teams and then move on to the next section. We also realized that more human personnel/more man hours were required than we earlier anticipated, so whereas we have fully covered the costs of the botanical work, we will need additional support to accelerate the work of the vertebrate section for at least 3 more months. The vertebrate section was also having challenges in accurately
geo-referencing the records due to the format used in capturing the field data and in September with support from a team from Yale University that was here for the conference, we spent about 1 week going over faster and more accurate methods and tools for doing this. However soon after– unfortunately, the key database manager for the department at National Museums of Kenya passed away and he had not yet developed the interns to the full level of understanding the Specify program and database and retrieval methods so we will need to spend more time with the interns hand-holding to ensure this process continues smoothly.
4.2. Acquisition of satellite imagery and building visualization products – we will need the support of RCMRD to assist us acquire through NASA the key satellite imagery required to undertake the comparative analysis. As per the drafted agreement, ACC will require the technical expertise of the Servir-Africa/RCMRD team over the next few months to translate the results already produced into products that are beneficial to planners, scientists, researchers and resource managers. We would hope to also host a workshop to build capacity on this visualization tools among the collaborating partners with support from RCRMD.
10
4.3 Stakeholders engagement – we are in the process of discussing with the new Director for Research and Collections at NMK on hosting a workshop to share the results of this project and also explore possible products that are relevant to stakeholders so we can include these in the design of the final products. The tentative target for this workshop is April-May this year when most analysis and integration of results will be near completion. 4.4 Activities in 2011. There is an ongoing need for biodiversity data collection,
mobilization and integration that is required to understand and address these imminent threats. In this year (2011) we will be focusing on the pending activities as per the circulated workplan which will entail :
mobilizing the digitization of the pending indicator species.
the consolidation and analysis of the outstanding complimentary data. the development of complete maps for all indicator species
the development of visualization tools final presentation of results in a workshop
publications and writing of reports which will include all applied methodology and tools
This is expected to take at least 6-8 months from January 2011 depending on availability of the technical support team at RCMRD for support in developing visualization tools. However the part time GIS staff allocated to the project initially is not sufficient to complete this process would seek to be granted some additional support for his time for a further 6 months.
We will therefore be seeking an extension both of time and financial resources from Servir-Africa for the successful completion of this project. We will be able to provide a detailed work plan of the pending activities subject to further discussions on the progress made on this project.
6 ANNEX (see attached)
1. Training Workshop Report 2. Eco-Climatic Zones of Kenya 3. Distribution Models – Plants 4. Distribution Models – Vertebrates 5. Financial summary