Rapport SGC 188
Demonstration of Software Application
Biogas Optimizer
TM
at the Händelö Biogas Site
Svenskt Gastekniskt Center – April 2008
Kristofer Cook
Bioprocess Control Sweden AB
SGC:s FÖRORD
FUD-projekt inom Svenskt Gastekniskt Center AB avrapporteras normalt
i rapporter som är fritt tillgängliga för envar intresserad.
SGC svarar för utgivningen av rapporterna medan uppdragstagarna för respektive
projekt eller rapportförfattarna svarar för rapporternas innehåll. Den som utnyttjar
eventuella beskrivningar, resultat eller dylikt i rapporterna gör detta helt på eget
ansvar. Delar av rapport får återges med angivande av källan.
En förteckning över hittills utgivna SGC-rapporter finns på SGC:s
hemsida
www.sgc.se
.
SGC är ett samarbetsorgan för företag verksamma inom energigasområdet. Dess
främsta uppgift är att samordna och effektivisera intressenternas insatser inom
områdena forskning, utveckling och demonstration (FUD).
SGC har följande delägare:
Svenska Gasföreningen, E.ON Gas Sverige AB, E.ON Sverige AB,
Göteborg Energi AB, Lunds Energikoncernen AB (publ) och Öresundskraft AB.
Följande parter har gjort det möjligt att genomföra detta utvecklingsprojekt:
Statens
energimyndighet
Bioprocess Control Sweden AB
Svensk Biogas AB
SVENSKT
GASTEKNISKT
CENTER
AB
2
Contents
Summary ... 3 Sammanfattning: ... 4 1 BACKGROUND ... 5 1.1 KEY OBJECTIVE ... 6 1.2 PURPOSE ... 6 1.3 GOALS ... 61.4 GENERAL PROJECT PLAN ... 7
1.5 TIME PLAN ... 7
2 RESULTS ... 8
2.1 SATISFYING PROJECT ACTIVITIES & KEY MILESTONES ... 8
2.2 PROJECT RESULTS ... 8
2.1.1 Obtaining baseline production information ... 8
2.1.2 Demonstration of Biogas OtpimizerTM ... 9
3 CONCLUSIONS AND RECOMMENDATIONS ... 12
3.1 CONCLUSIONS ... 12
3.2 RECOMMENDATIONS ... 12
APPENDIX 1 – COMPANY INFORMATION ... 13
APPENDIX 2 – OVERVIEW OF BIOGAS OPTIMIZERTM ... 14
3
Summary
There is a growing interest in the utilisation of process optimisation technologies within the biogas industry. This trend is being driven by new and growing market opportunities as well as an interest to improve the overall profitability of
commercial biogas processes. Biogas OptimizerTM, developed by Bioprocess
Control Sweden AB based in Lund, Sweden, represents one such process optimisation technology, utilising a supervisory and control approach to improve both biogas production efficiency and process stability.
A demonstration project was conducted over a nine month period during 2007 at the Händelö biogas plant in Norrköping, Sweden, owned and operated by Svensk
Biogas AB, to provide an indication of the potential of Biogas OptimizerTM to
improve the competiveness of biogas producers. The demonstration project attempted to satisfy 3 goals, namely; 1) to obtain baseline production information regarding the average Organic Loading Rate (OLR) and average Biogas Production Rate (BPR), 2) to demonstrate that the technology behind Biogas OptimizerTM works under full-scale production conditions, and 3) to verify that significant/notable production efficiency improvements can be achieved utilising
Biogas OptimizerTM when compared to baseline production information, and that
biogas production can be optimised for maximising the utilisation of reactor capacity while still leaving a comfortable safety margin so as to avoid reactor overloading.
The collection of baseline production information during three months resulted in
an average OLR of 4.0 Kg VS/m3/day and average BPR of 2.6 Nm3/m3/day being
selected as baseline data from which to compare the performance of Biogas
OtpimizerTM. The full-scale demonstration of Biogas OptimizerTM was conducted
over a 40 day period. During these 40 days, OLR recommendations from Biogas
OptimizerTM, and the resulting manual adjustment of the OLR by the plant
operator, resulted in an increase in the average OLR from 4.0 to 4.7 Kg/m3/day
and increase in the average BPR from 2.6 to 3.23 Nm3/m3/day. Thus, after
operating Biogas OptimizerTM for a period of 40 days, the average BPR increased
by 24%. It should however be emphasized that the effect of Biogas OptimizerTM is
hard to completely separate from other factors affecting the methane production rate, such as a minor change in the substrate composition that occurred during the
trial. Additionally, Biogas OptimizerTM was unable to test the maximum
utilisation of reactor capacity due to the limited capacity of the plant upgrading unit and high operational cost resulting from an increase in the feedstock price during 2007.
4
From the demonstration project, one can conclude that the technology behind
Biogas OptimizerTM works under full-scale production conditions, can provide
notable process efficiency improvements compared to baseline production data, and thus has the potential to increase the competiveness of biogas producers.
Sammanfattning:
Det finns ett växande intresse i användandet av processoptimeringstekniker inom biogasbranschen. Denna trend drivs framåt av nya och växande marknadsmöjligheter såväl som av ett intresse att förbättra lönsamheten för
komersiella biogasprocesser. Biogas OptimizerTM, utvecklad av Bioprocess
Control Sweden AB som är baserade i Lund, representerar en av dessa processoptimeringsteknikerna, då den använder sig av både övervakning och styrning för att förbättra både biogasproduktionensprocessens effektivitet och stabilitet.
Ett demonstrationsprojekt har 2007 ägt rum under en niomånadersperiod vid Händelö biogasanläggning i Norrköping som ägs och drivs av Svensk Biogas AB.
Projektet syftade till att ge en indikation för vilken potential Biogas OptimizerTM
har för att kunna förbättra biogasproducenternas konkurrensförmåga. Demonstrationsprojektet försökte uppfylla tre olika mål, nämligen att; 1) Etablera en grundnivå (baseline) på produktionen med hänsyn till genomsnittlig OLR (Organic Loading Rate) och genomsnittlig BPR (Biogas Production Rate), 2) att
visa att teknologin Biogas OptimizerTM funergar under fullskaliga
produktionsförhållanden, och 3) att klargöra att betydande/märkbar effektivitetsökningar gällande produktionen kan uppnås genom att använda
Biogas OptimizerTM när man jämför ”baseline information”, och att
biogasproduktionen kan optimeras för att maximera nyttjandet av reaktorkapaciteten samtidigt som man fortfarande lämnar en trygg säkerhetsmarginal för att undvika överbelastning av reaktorn.
Insamlandet av “baseline information” under en tremånadersperiod resulterade i
att en genomsnittlig OLR av 4.0 Kg VS/m3/dag och en genomsnittlig BPR på 2.6
Nm3/m3/dag valdes som utgångspunkt för att kunna jämföra Biogas OptimizerTM
prestationsförmåga. Det fullskaliga testet av Biogas OptimizerTM gjordes under en
40dagarsperiod. Under dessa 40 dagar resulterade Biogas OptimizersTM OLR
rekommendationer och de efterföljande manuella OLR-justeringarna av biogasanläggningens övervakare i en ökning av den genomsnittliga OLR från 4.0
till 4.7 Kg/m3/dag och i en ökning i genomsnittlig BPR från 2.60 till 3.23
5
aktivt under en 40dagarsperiod kunde BPR ökas med 24%. Det skall dock
poängteras att effekten från Biogas OptimizerTM är svår att helt separera från
andra faktorer som kan påverka takten för metanproduktion, såsom en mindre förändring in substratsammansättningen som inträffade under vägen. Tilläggas
skall att Biogas OptimizerTM inte fick möjligheten att testa den maximala
användningen av reaktorns kapacitet pga. en begränsad kapacitet i anläggningens uppgraderingsenhet samt höga driftskostnader, vilka var ett resultat av en ökning av råvarupriserna under 2007.
Utifrån demonstrationsprojektet , kan man dra slutsatsen att teknologin bakom
Biogas OptimizerTM har potentialen att öka biogasproducentens konkurrenskraft.
1
BACKGROUND
The popularity of the anaerobic digestion process, as a source of environmentally friendly fuel (biogas) for heating, electricity generation and transportation, has increased in recent years. This interest in being driven by, among other things, higher oil prices and legislative developments promoting bio-fuels, as well as the banning of land-filling of biodegradable waste across Europe.
As a result, significant investment, both private and public, has gone into the construction of bioreactors for the commercial production of biogas. Unfortunately, the profitability of these investments is in question due to problems with process instability associated with the anaerobic digestion process, poor reactor performance, low productivity, and slow reactor start-up.
There is thus a growing interest in the area of process optimisation, where steps have already been made in recent years with regards to optimising the feed composition as well as more efficient digestion technologies, pre-treatment approaches and process configurations.
Process optimisation can also be facilitated through using supervisory and control software applications that automatically adjust the loading of feedstock to maximise the production of biogas, and protect the reactor from overload and disturbances. It is in this area that a demonstration project was carried out too verify a software application developed by Bioprocess Control Sweden AB (Appendix 1), based in Lund, Sweden, called Biogas OptimizerTM(Appendix 2), under full-scale production conditions at the Händelö Biogas Site in Norrköping, Sweden (Appendix 3), owned and operated by Svensk Biogas AB (Appendix 1).
6
1.1 KEY OBJECTIVE
This project thus set out to satisfy the following key objective:
To help increase the competitiveness of biogas producers.
This key objective was anticipated to be achieved through the following benefits resulting from using Biogas OptimizerTM:
• Less process disturbances and production downtime
• An accelerated and increased production of biogas at existing production facilities
• Lower investment costs at new production facilities, by using smaller digesters operating more efficiently.
1.2 PURPOSE
One critical step on route to introducing a problem free commercial software application for optimising the commercial production of biogas through improved process control is to demonstrate the software application under full-scale scale commercial conditions. This project had thus the following purpose:
• To provide a demonstration of the first commercially adapted version of
the supervisory and control application Biogas OptimizerTM on a full-scale
commercial bioreactor.
1.3 GOALS
In order to satisfy the above purpose, this project set out to fulfil the following goals:
1. Obtain baseline production information at a full scale production facility
that can be used to compare key production parameters before and after
the introduction of Biogas OptimizerTM.
2. Demonstrate that the first commercially adapted version of Biogas
OptimizerTM does work under full-scale production conditions, and will
provide benefits for other full-scale commercial biogas producers. This will be accomplished by having an operator manually adjust system parameters based on recommendations from the software application.
3. To verify that significant/notable production efficiency improvements can
be achieved by comparing new and baseline production information, and further demonstrate that biogas production can be optimised for
7
maximising the utilisation of reactor capacity while still leaving a comfortable safety margin so as to avoid reactor overloading.
1.4 GENERAL PROJECT PLAN
The demonstration project was carried out in the following three phases over a nine month period:
1. Preparation of site and adaptation of software application
2. Assessment of baseline production information at full-scale facility and
demonstration of Biogas OptimizerTM along with the verification of results
3. Analysis of information and reporting of results
1.5 TIME PLAN
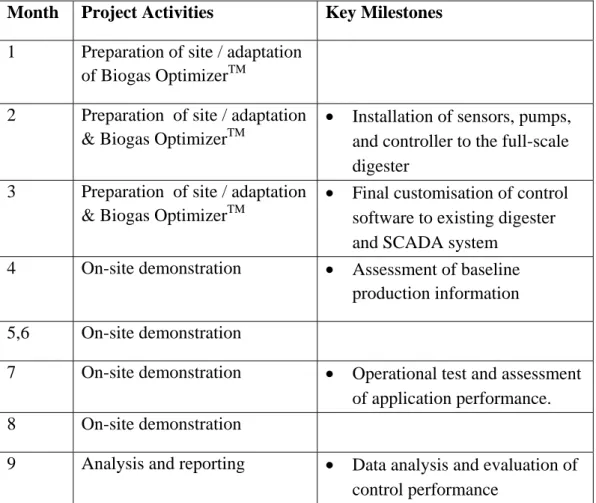
The project was carried between April 2007 and December 2007. Below is an overview of the project time-plan including project related activities and key milestones for the demonstration project (see table 1.1).
Table 1.1. Time Plan for Demonstration Project
Month Project Activities Key Milestones
1 Preparation of site / adaptation
of Biogas OptimizerTM
2 Preparation of site / adaptation
& Biogas OptimizerTM
• Installation of sensors, pumps,
and controller to the full-scale digester
3 Preparation of site / adaptation
& Biogas OptimizerTM
• Final customisation of control
software to existing digester and SCADA system
4 On-site demonstration • Assessment of baseline
production information
5,6 On-site demonstration
7 On-site demonstration • Operational test and assessment
of application performance.
8 On-site demonstration
9 Analysis and reporting • Data analysis and evaluation of
8
2
RESULTS
2.1 SATISFYING PROJECT ACTIVITIES & KEY MILESTONES
After a 3 month delay with regards to the start of the project, according to the original project plan, the demonstration project was completed within the projected 9 month time-plan. Each of the Project Activities and Key Milestones described in section 1.5 were completed during month specified in the time-plan.
2.2 PROJECT RESULTS
2.1.1 Obtaining baseline production information
Baseline production information was collected between the 22nd of July and the
10th of September 2007 (see figure 2.1). Although the process was not entirely
stable during the time allocated to collect baseline production data, the data collected revealed that the average Organic Loading Rate (OLR) did not exceed 4
kg VS/m3/day, and average Biogas Production Rate (BPR) did not exceed 2.5
Nm3/m3/day. In order to be conservative, it was thus decided to select an OLR of
4.0 kg VS/m3/day and BPR of 2.6 Nm3/m3/day as baseline production figures for
comparative purposes before the installation of Biogas OptimizerTM. It should
however be noted that the operator felt that the baseline figures might not represent the maximum potential of the production system, as predicated by prior laboratory tests.
Figure 2.1 Baseline Monitoring of Händelö plant (July 22nd – Sept 12th, 2007)
0,0 0,3 0,5 0,8 1,0 1,3 1,5 1,8 2,0 2,3 2,5 0,0 0,5 1,0 1,5 2,0 2,5 3,0 3,5 4,0 4,5 5,0 5,5 6,0 6,5 0 5 10 15 20 25 30 35 40 45 50 55 Biogas production rate (Nm 3/m 3, day ) Organic Loading rate (Kg VS/m 3, day )
Organic loading rate (OLR) Biogas production rate
Average biogas production rate
(July 22) (Aug 1) (Aug 11) (Aug 21) (Aug 31) (Sept 10)
9 2.1.2 Demonstration of Biogas OtpimizerTM
The full-scale demonstration and verification of Biogas OptimizerTM was
conducted between the 20th of September and 10th of November 2007
Figure 2.2 Demonstration of Biogas OptimizerTM, Händelö plant (September 20th – November 10th, 2007)
Note: during day 9-10, the sharp increase in biogas production was due to a minor change in the feedstock composition.
The data set provided from the demonstration of Biogas OptimizerTM can be
divided into four phases as follows:
1. The Trial Phase (Sept. 20th – Oct. 1st):
The initial OLR at the plant was 3.52 Kg VS/m3/day with an average BPR
of 1.96 Nm3/m3/day. As this was a trial phase, the plant operator did not
follow the recommendation provided by Biogas OptimizerTM.
2. Full-Scale Testing Phase (Oct 1st – Oct. 19th):
During this period, Biogas OptimizerTM provided increasing OLR
recommendations from 4.0 to 4.7 Kg VS/m3/day. The operator followed
the recommendations up to 4.5 Kg VS/m3/day. During this period (three
weeks), the average BPR increased from 2.61 to 3.06 Nm3/m3/day.
0,0 0,5 1,0 1,5 2,0 2,5 3,0 3,5 4,0 4,5 0,0 0,5 1,0 1,5 2,0 2,5 3,0 3,5 4,0 4,5 5,0 0 5 10 15 20 25 30 35 40 45 50 Biogas production rate (Nm 3/m 3,day ) Organic Loading rate (Kg VS/m 3,day )
Operational Time (days)
Organic loading rate (OLR) Recommended OLR Biogas production rate Average biogas production rate
10
3. Adjusting Period for Plant (Oct. 20th – Nov. 6th):
The operator was not able to follow the recommendations provided by
Biogas OptimizerTM due to the limitation of the gas upgrading unit.
4. Continuation of Full-Scale Testing (Nov. 6th- Nov. 10th):
After some modifications to the upgrading unit, the demonstration project continued. The operator started to follow the recommendations provided
by Biogas OptimizerTM increasing the OLR from 4.5 to 4.7 Kg VS/m3/day.
During this period the average BPR increased from 3.14 to 3.23
Nm3/m3/day.
The decision was made in the middle of November to stop increasing the OLR due to capacity limitations of the gas upgrading unit and the high cost of the
wheat based stillage substrate used in the process. Biogas OptimizerTM is however
still operating and continuing to provide process recommendations to the operator. 2.1.3 Interpretation of Results
After operating Biogas OptimizerTM for a period of about 40 days, the average
BPR increased from 2.61 to 3.23 Nm3/m3/day, an increase of 24% (see figure 2.3).
Figure 2.3 Full-scale operation of Händelö plant (July 20th – November 10th, 2007) -0,1 0,2 0,4 0,7 0,9 1,2 1,4 1,7 1,9 2,2 2,4 2,7 2,9 3,2 3,4 3,7 3,9 0 1 2 3 4 5 6 7 8 9 0 10 20 30 40 50 60 70 80 90 100 110 Biogas production rate (Nm 3/m 3, day )
Organic loading rate
(Kg
VS/m
3, day
)
Operational time (days)
Organic loading rate (OLR) Recommended OLR Biogas production rate Average biogas production rate Start testing BiogasOptimizer
11
In terms of satisfying the goals of the project, the results from the demonstration project indicate the following:
1. Obtaining Baseline Production Information:
Reliable baseline production information was obtained during the time allocated to collect such data. Conservative estimates of both baseline OLR and the average BPR were established in order to compare production parameters before and after the installation of Biogas
OptimizerTM.
2. Successful Verification of Biogas OptimizerTM:
A series of OLR recommendations from Biogas OptimizerTM during the 40
day demonstration period and resulting increases in the average BPR over the same period after manual OLR adjustments, indicate that the application does work under full-scale production conditions and can provide benefits for biogas producers.
3. Verification of Efficiency Improvements:
The 24% increase in the average BPR over the 40 day demonstration
period both verifies that Biogas OptimizerTM is capable of providing
notable efficiency improvements to commercial biogas producers. 4. Maximum Utilisation of Reactor Capacity:
Due to limitations with the capacity of the upgrading unit and high cost of the wheat-containing feedstock, the demonstration project was unable
verify that by utilising Biogas OptimizerTM biogas production could be
optimised for the maximum utilisation of reactor capacity while still leaving a comfortable safety margin so as to avoid reactor overloading.
12
3
CONCLUSIONS AND RECOMMENDATIONS
3.1 CONCLUSIONS
One can conclude from the demonstration project that Biogas OptimizerTM is able
to provide notable benefits to biogas producers, even though the full extent of what level of process optimisation that can be achieved by using Biogas
OptimizerTM is still unexplored. Thus, while still not knowing the upper limit of
the potential value that can be derived from using Biogas OptimizerTM, one can
conclude from this demonstration project that Biogas OptimizerTM has a strong
potential to increase the competiveness of biogas producers. This will be achieved, as previously mentioned, through an accelerated and increased production of biogas, less process disturbances, and a reduction in investment costs at new production facilities through utilising smaller more efficient digesters.
3.2 RECOMMENDATIONS
This demonstration project served to verify that the technology behind Biogas
OptimizerTM works under full-scale production conditions, and that Biogas
OptimizerTM can provide notable production efficiency improvements. There is
however still room for further work to be carried out to explore what can be
achieved by using Biogas OptimizerTM. Several recommendations include the
following:
1. Testing Biogas OptimizerTM during the reactor start-up phase, as well as
during conditions of severe process disturbances.
2. Developing and testing an automatic version of Biogas OptimizerTM, to
assess the difference between manual and fully/semi automatic monitoring and control of a bioreactor.
3. Testing Biogas OptimizerTM with different substrate materials and process
13
APPENDIX 1 – COMPANY INFORMATION
Bioprocess Control Sweden ABBased: Lund, Sweden
Started: 2006 Ownership: Private
Business idea: Develop, market, and support process adapted supervisory and control applications that optimise the production of biogas.
Svensk Biogas AB
Based: Linköping, Sweden
Started: 1996 (original company)
Ownership: 100% owned daughter company to Tekniska Verkin i Linköping
AB (publ)
Business idea: Develop the biogas vehicle fuel market by establishing public filling stations for biogas on a regional basis, and offering process and production development knowledge.
14
APPENDIX 2 – OVERVIEW OF BIOGAS OPTIMIZER
TMBiogas OptimizerTM is an award winning process optimisation application
designed to accelerate the biogas production process and ensure greater process stability (see figure A.1).
Figure A.1 Graphic depiction of Biogas OptimizerTM
Biogas OptimizerTM provides biogas producers with a system for on-line
monitoring and intelligent supervisory control of biogas digesters. The system has the ability to protect a biogas production process from overload, while allowing the maximum utilisation of digester capacity.
Biogas OptimizerTM provides biogas producers with the following features:
• System for on-line monitoring allowing for either manual, automatic or
intelligent supervisory and control of bio-reactors.
• Fast reacting system based on simple commercially available sensors.
• Ability to protect the system from overload and reject disturbances.
• Allows for bioreactors to operate close to maximum capacity while still
having safety margins for a reliable operation.
• Compatible with different process configurations, feedstock mixes, and
process control systems.
Biogas OptimizerTM provides biogas producers with the following advantages:
• An accelerated production process with improved reactor performance.
• Significantly higher productivity and biogas output.
• More stable and reliable biogas production process.
• Protection against process disturbances.
15
APPENDIX 3 – HÄNDELÖ BIOGAS PLANT
The Händelö Biogas Plant is fully owned and operated by Svensk Biogas AB and is located in Norrköping, Sweden. The plant is Sweden’s first crop gas plant and was completed in December of 2006. The plant is designed to treat 24 000 tons of substrate per year, of which 90% is stillage from a nearby ethanol plant owned and operated by Agroethanol AB. There are plans to expand the plant to treat 48 000 tons of substrate per year to meet a growing market demand for bio-methane in the Norrköping area and Stockholm region.
Plant / Process Characteristics
The Händelö Biogas Plant has the following plant / process characteristics:
Site classification: Ethanol stillage biogas plant (crop gas plant)
Start of operation: 2007
Amount of substrate treated: 24 000 tons/yr
Type of substrate: 90% ethanol stillage
Substrate recipe: Controlled
Reactor type: CSTR
Digestion temperature: Mesophilic
Operational mode: Semi-continuous
On-line measurements: Gas flow, gas composition, pH
Off-line measurements: TS, VS, VFA, Alkalinity, NH4-N
Retention time: 40 days
Digester volume: 2 000m3
Number of digesters 1
Utilization of biogas: Vehicle fuel
Scheelegatan 3, 212 28 Malmö ● Tel 040-680 07 60 ● Fax 040-680 07 69 www.sgc.se ● [email protected]