Programme for International Student Assessment
Equality in Education
ApTiTudE, BEhAviour, ConfidEnCE
in Education
This document and any map included herein are without prejudice to the status of or sovereignty over any territory, to the delimitation of international frontiers and boundaries and to the name of any territory, city or area.
Please cite this publication as:
OECD (2015), The ABC of Gender Equality in Education: Aptitude, Behaviour, Confidence, PISA, OECD Publishing. http://dx.doi.org/10.1787/9789264229945-en
ISBN 978-92-64-23002-6 (print) ISBN 978-92-64-22994-5 (PDF)
The statistical data for Israel are supplied by and under the responsibility of the relevant Israeli authorities. The use of such data by the OECD is without prejudice to the status of the Golan Heights, East Jerusalem and Israeli settlements in the West Bank under the terms of international law.
Photo credits:
© Flying Colours Ltd /Getty Images © Jacobs Stock Photography /Kzenon © khoa vu /Flickr /Getty Images © Mel Curtis /Corbis
© Shutterstock /Kzenon © Simon Jarratt /Corbis
Corrigenda to OECD publications may be found on line at: www.oecd.org/publishing/corrigenda. © OECD 2015
You can copy, download or print OECD content for your own use, and you can include excerpts from OECD publications, databases and multimedia products in your own documents, presentations, blogs, websites and teaching materials, provided that suitable acknowledgement of OECD as source and copyright owner is given. All requests for public or commercial use and translation rights should be submitted to [email protected]. Requests for permission to photocopy portions of this material for public or commercial use shall be addressed directly to the Copyright Clearance Center (CCC) at [email protected] or the Centre français d’exploitation du droit de copie (CFC) at [email protected].
To compete successfully in today’s global economy, countries need to develop the potential of all of their citizens. They need to ensure that men and women develop the right skills and find opportunities to use them productively. Many countries are working towards achieving gender parity at the workplace and in access to jobs. In education, too, many countries have been successful in closing gender gaps in learning outcomes. Yet, as this report reveals, even when boys and girls are equally proficient in mathematics and science, their attitudes towards learning and aspirations for their future are markedly different – and that has a significant impact on their decisions to pursue further education and their choice of career.
The ABC of Gender Equality in Education: Aptitude, Behaviour, Confidence tries to determine why 15-year-old boys are more likely than girls, on average, to fail to attain a baseline level of proficiency in reading, mathematics and science, and why high-performing 15-year-old girls still underachieve in areas such as mathematics, science and problem solving when compared to high-performing boys. In 2012, 14% of boys and 9% of girls surveyed by the PISA exercise did not attain the PISA baseline level of proficiency in any of the three core subjects. On the other hand, in the top-performing economies in PISA, such as Shanghai-China, Singapore, Hong Kong-China and Chinese Taipei, girls perform on a par with their male classmates in mathematics and attain higher scores in mathematics than boys in most other countries and economies around the world. As the evidence in the report makes clear, gender disparities in performance do not stem from innate differences in aptitude, but rather from students’ attitudes towards learning and their behaviour in school, from how they choose to spend their leisure time, and from the confidence they have – or do not have – in their own abilities as students. In fact, the report shows that the gender gap in literacy proficiency narrows considerably – and even disappears in some countries – among young men and women in their late teens and 20s. Giving boys and girls an equal opportunity to realise their potential demands the involvement of parents, who can encourage their sons and daughters to read; teachers, who can encourage more independent problem solving among their students; and students themselves, who can spend a few more of their after-school hours “unplugged”. This report is a valuable contribution to the OECD’s work on gender issues, which examines existing barriers to gender equality in education, employment and entrepreneurship with the aim of improving policies and promoting gender equality in both OECD and partner countries. It shows clearly that we cannot rest complacent. We can provide a better future to our children if we act upon the evidence presented in this report.
Angel Gurría
This report is the product of a collaborative effort between the countries participating in PISA and the OECD Secretariat. The report was drafted by Francesca Borgonovi and Marilyn Achiron, with contributions from Giannina Rech and Angelica Salvi del Pero. Andreas Schleicher, Michael Davidson, Yuri Belfali, Monika Queisser, Francesco Avvisati and Joel Rapp provided valuable feedback at various stages of the report. François Keslair, Louise Caron, Lorena Ortega Ferrand, Célia Braga-Schich, Sophie Limoges, Alfonso Echazarra, Daniel Salinas, Miki Tadakazu, Juliet Evans, Claire Chetcuti, Elisabeth Villoutreix and Louise Binn provided statistical, editorial and administrative support. The development of the report was steered by the PISA Governing Board, which is chaired by Lorna Bertrand (United Kingdom).
ExEcutivE Summary ...13
rEadEr’S GuidE ...17
CHAPTER 1 EmErGiNG GENdEr GaPS iN EducatiON ...19
Historic progress in young women’s education ...21
Low-performing boys...24
High-performing girls ...27
What happens as girls and boys pursue further education or work ...32
CHAPTER 2 tacKLiNG uNdErPErFOrmaNcE amONG BOyS ...35
How do boys and girls spend their time outside of school? Wired and connected ...37
• Video gaming and student performance ...42
How do boys and girls spend their time outside of school? unplugged ...45
• Reading for enjoyment ...45
• Doing homework ...49
attitudes towards school and learning ...51
Gender differences in self-regulation ...53
• Grade repetition and marks ...53
• Investing effort ...56
CHAPTER 3 GirLS’ LacK OF SELF-cONFidENcE ...63
Studying the “intangibles” that affect learning ...68
• Self-efficacy in mathematics and science...69
• Self-concept in mathematics and science ...74
• Anxiety towards mathematics ...76
underperforming at the top ...77
Opportunity to learn mathematics ...81
choking under pressure ...88
CHAPTER 4 ExPEctatiONS aNd rEaLity FOr ScHOOL-LEavErS ...97
Preparing for a job ...100
Forming expectations about further education and work ...104
• Differences in ambition ...105
• Differences in choice of preferred occupations ...110
• Expectations of careers in computing and engineering ...113
• Expectations of careers in health services ...113
• Expectations vs. reality ...116
using mathematics in the future ...118
What happens after compulsory education ...121
• Gender differences in literacy and numeracy among young adults ...121
• Inter-generational differences ...122
• Gender differences in using skills ...126
Financial literacy...130
CHAPTER 5 HOW FamiLy, ScHOOL aNd SOciEty aFFEct BOyS’ aNd GirLS’ PErFOrmaNcE at ScHOOL ...137
the role of families ...138
• Parents’ expectations for their children ...139
the role of schools ...141
• The relationship between what happens in the classroom and the gender gap in achievement ...144
the impact of social norms ...145
CHAPTER 6 POLiciES aNd PracticES tO HELP BOyS aNd GirLS FuLFiL tHEir POtENtiaL ...151
relationship between the gender gap in reading and the gender gap in mathematics ...152
Policy implications ...155
• Give students a greater choice in what they read ...155
• Allow some video gaming, but homework comes first ...156
• Train teachers to be aware of their own gender biases ...157
• Build girls’ self-confidence ...157
• Help students look ahead ...158
• Learn from experience ...159
ANNEX A WHat SOmE cOuNtriES arE dOiNG tO PrOmOtE GENdEr EQuaLity iN EducatiON ...163
BOX
Box 4.1 Key facts about the Survey of Adult Skills (PIAAC) ...116
FIGURES Figure 1.1 Long-term trends in gender gaps in education, 1896-1980 ...22
Figure 1.2 Gender differences in the percentage of students who are low achievers in all subjects ...26
Figure 1.3 Gender differences in mathematics across the performance distribution ...28
Figure 1.4 Gender differences in science across the performance distribution ...29
Figure 1.5 Boys’ and girls’ strengths and weaknesses in mathematics ...30
Figure 1.6 Boys’ and girls’ strengths and weaknesses in science ...31
Figure 2.1 Differences between young and mature men and women in problem solving in technology-rich environments ...37
Figure 2.2 Percentage of boys and girls who first used a computer when they were 6 years old or younger ...38
Figure 2.3 How much time do girls and boys spend on the Internet?...40
Figure 2.4 How often do girls and boys play video games on the computer, outside of school?...40
Figure 2.5 Gender disparities in how girls and boys use the computer ...41
Figure 2.6 Relationship between performance and video gaming ...43
Figure 2.7 Performance difference between computer-based and paper-based reading assesments, by the frequency of playing video games ...44
Figure 2.8 Reading performance, by the materials students read ...46
Figure 2.9 Change between 2000 and 2009 in the percentage of boys and girls who read for enjoyment ...47
Figure 2.10 What boys and girls read for enjoyment ...48
Figure 2.11 Boys’ reading performance if they enjoyed reading as much as girls do ...48
Figure 2.12 Time spent by boys and girls doing homework assigned by their teachers ...50
Figure 2.13 Gender gap in performance related to time spent doing homework ...51
Figure 2.14 How boys and girls feel about school ...52
Figure 2.15 Grade repetition, by gender ...54
Figure 2.16 Students’ marks ...55
Figure 2.17 The PISA effort thermometer...56
Figure 2.18 Gender differences in effort ...57
Figure 3.1 Girls’ and boys’ average performance in mathematics in the ten countries with the highest average performance among girls ...65
Figure 3.2 Gender gap among top performers in mathematics ...66
Figure 3.3 Gender gap among top performers in science ...67
Figure 3.4 Gender differences in science self-efficacy ...70
Figure 3.5 Gender differences in mathematics self-efficacy ...71
Figure 3.6 Relationship between science self-efficacy and science performance ...72
Figure 3.8 Gender differences in science self-concept ...74
Figure 3.9 Gender differences in mathematics self-concept ...75
Figure 3.10 Gender differences in mathematics anxiety ...77
Figure 3.11 Role of science self-beliefs in reducing the gender gap among the highest-achieving students ...79
Figure 3.12 Role of mathematics self-beliefs in reducing the gender gap among the highest-achieving students ...80
Figure 3.13 Gender differences in students’ experience with pure mathematics tasks ...82
Figure 3.14 Gender differences in students’ experience with applied mathematics tasks ...82
Figure 3.15 Gender differences in students’ familiarity with formal mathematics ...84
Figure 3.16 Role of grade repetition and study programme in explaining gender differences in students’ familiarity with formal mathematics ...85
Figure 3.17 Role of grade repetition and study programme in explaining gender differences in students’ experience with pure mathematics tasks ...86
Figure 3.18 Gender differences in problem-solving performance ...90
Figure 3.19 Girls’ strengths and weaknesses, by problem-solving process ...92
Figure 4.1 Gender differences in participation in pre-vocational and vocational programmes ...99
Figure 4.2 What boys and girls do to find out more about future studies or careers ...101
Figure 4.3 Gender differences in students’ preparation for future studies and careers ...102
Figure 4.4 Gender differences in whether, and where, students reported that they had acquired different skills ...103
Figure 4.5 Where students acquire the skills to find information about a job or searching for a job ...104
Figure 4.6 Percentage of students who plan to work as managers or professionals, by gender ...106
Figure 4.7 Average status of the occupations boys and girls expect to work in at the age of 30 ...108
Figure 4.8 Gender differences in expectations of completing university and upper secondary degrees ...109
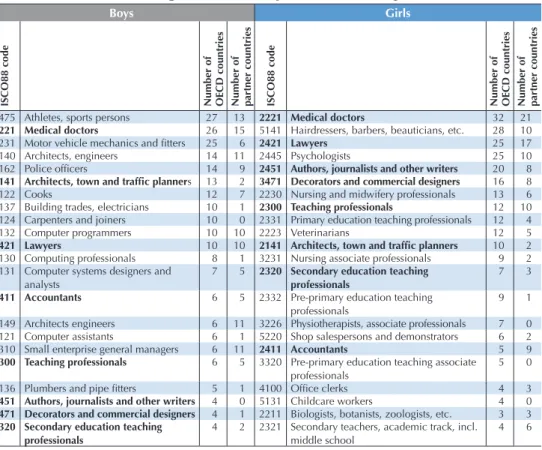
Figure 4.9 Selected occupations from the lists of the ten most popular career choices among students in a particular country ...111
Figure 4.10 Where boys and girls are more likely to expect to work in one of the ten most popular careers in their country ...112
Figure 4.11 Proportion of boys and girls expecting a career in engineering or computing ...114
Figure 4.12 Proportion of boys and girls expecting a career in health services ...115
Figure 4.13 Gender disparities in whether future studies or careers will contain a lot of mathematics, rather than science or language of instruction ...119
Figure 4.14 Gender disparities in whether future careers will contain a lot of mathematics, rather than science, by gender ...120
Figure 4.15 Gender differences in literacy proficiency among 16-29 year-olds ...122
Figure 4.16 Gender differences in performance among young adults and among 15-year-olds ...123
Figure 4.17 Gender differences in literacy proficiency between younger and older adults ...124
Figure 4.18 Gender differences in numeracy proficiency between younger and older adults ...125
Figure 4.19 Differences in reading and writing activities at work, by gender ...126
Figure 4.20 Differences in reading and writing activities at home, by gender ...127
Figure 4.22 Gender differences in numeracy proficiency among men and women
who work in STEM occupations ...130
Figure 4.23 Gender differences in financial literacy performance ...131
Figure 5.1 Parents’ expectations for their children’s careers...140
Figure 5.2 Relationship between schools’ socio-economic composition and the gender gap in reading ...142
Figure 5.3 Relationship between schools’ socio-economic composition and the gender gap in mathematics ...143
Figure 5.4 Role of teachers’ use of cognitive-activation strategies in narrowing the gender gap in mathematics performance ...146
Figure 6.1 Cross-country variation in gender gaps in reading and mathematics ...153
Figure 6.2 Trends in gender gaps in reading and mathematics between 2003 and 2012 ...154
Over the past century, OECD countries have made significant progress in narrowing or closing long-standing gender gaps in many areas of education and employment, including educational attainment, pay and labour market participation. This one fact implies another: that aptitude knows no gender. Given equal opportunities, boys and girls, men and women have equal chances of achieving at the highest levels.
But new gender gaps in education are opening. Young men are significantly more likely than young women to be less engaged with school and have low skills and poor academic achievement. They are also more likely to leave school early, often with no qualifications. Boys in OECD countries, for example, are eight percentage points more likely than girls to report that school is a waste of time. Meanwhile, in higher education and beyond, young women are under-represented in the fields of mathematics, physical science and computing. In 2012, only 14% of young women who entered university for the first time chose science-related fields of study, including engineering, manufacturing and construction. By contrast, 39% of young men who entered university that year chose to pursue one of those fields of study.
Underachievement among boys
PISA finds that 15-year-old boys are more likely than girls of the same age to be low achievers. In 2012, 14% of boys and 9% of girls did not attain the PISA baseline level of proficiency in any of the three core subjects measured in PISA – reading, mathematics and science. In fact, six out of ten students who did not attain the baseline level of proficiency in any of those subjects were boys. There are many possible reasons for boys’ poor performance in school, and many of them are connected with differences in behaviour between boys and girls. For example, boys spend one hour less per week on homework than girls – and each hour of homework per week translates into a four-point higher score in the PISA reading, mathematics and science tests. Outside of school, boys spend more time playing video games than girls and less time reading for enjoyment, particularly complex texts, like fiction. Reading proficiency is the foundation upon which all other learning is built; when boys don’t read well, their performance in other school subjects suffers too.
Lack of self-confidence among girls
In the large majority of countries and economies that participate in PISA, among high-performing students, girls do worse than boys in mathematics; in no country do they outperform boys at this level. In general, girls have less self-confidence than boys in their ability to solve mathematics or science problems. Girls – even high-achieving girls – are also more likely to express strong feelings of anxiety towards mathematics. On average across OECD countries, the score-point difference in mathematics performance between high-achieving girls and boys is 19 score points. However, when comparing boys and girls who reported similar levels of self-confidence in mathematics and of anxiety towards mathematics, the gender gap in performance disappears.
PISA reveals that girls tend to do better when they are required to work on mathematical or scientific problems that are more similar to those that are routinely encountered in school. But when required to “think like scientists”, girls underperform considerably compared to boys. For example, girls tend to underachieve compared to boys when they are asked to formulate situations mathematically. On average across OECD countries, boys outperform girls in this skill by around 16 PISA score points – the equivalent of nearly five months of school. Boys also outperform girls – by 15 score points – in the ability to apply their knowledge of science to a given situation, to describe or interpret phenomena scientifically and predict changes. This gender difference in the ability to think like a scientist may be related to students’ self-confidence. When students are more self-confident, they give themselves the freedom to fail, to engage in the trial-and-error processes that are fundamental to acquiring knowledge in mathematics and science.
What these results mean for students’ futures
PISA has consistently found that, in general, girls have higher expectations for their careers than boys; but on average across OECD countries, less than 5% of girls contemplate pursuing a career in engineering and computing. In virtually all countries, the number of boys thinking of a career in computing or engineering exceeds the number of girls contemplating such a career.
By contrast, boys seem to be better prepared to enter the work force or to look for a job than girls. PISA finds that the share of 15-year-old girls who reported that they had not learned how to prepare for a job interview is more than 10 percentage points larger than the share of boys who so reported. And larger proportions of boys than girls reported that they had participated in such “hands-on” activities as internships and job shadowing.
As boys mature and become young men, they also acquire, at work and through life experience, some of the reading skills that they hadn’t acquired at school. Results from the 2012 Survey of Adult Skills, a product of the OECD Programme for the International Assessment of Adult Competencies, finds that there are no significant gender differences in literacy proficiency among 16-29 year-olds. Among workers in their 30s, 40s and particularly those in their 50s and 60s, men appear to be considerably more likely than women to read, write and use problem-solving skills at work.
How to narrow – or close – the gender gaps in education
Parents can give their sons and daughters equal support and encouragement for all of their school work and aspirations for their future. PISA results show that this doesn’t always happen. In all countries and economies that surveyed the parents of students who sat the PISA test, parents were more likely to expect their sons, rather than their daughters, to work in a science, technology, engineering or mathematics field – even when their 15-year-old boys and girls perform at the same level in mathematics.
Teachers can help by becoming more aware of their own gender biases that may affect how they award marks to students. They could also receive additional training in how to provide extra support to socio-economically disadvantaged students, since PISA finds that boys are more likely to underachieve when they attend schools with a large proportion of disadvantaged students. In addition, teachers can use teaching strategies that demand more of their students, since all students, but particularly girls, perform better in mathematics when their teachers ask them to try to solve mathematical problems independently.
In some of the top-performing countries and economies in PISA, such as Hong Kong-China, Shanghai-China, Singapore and Chinese Taipei, girls perform on a par with their male classmates in mathematics and attain higher scores than all boys in most other countries and economies around the world. Similarly, while in all countries and economies boys underperform in reading compared to girls – and by a wide margin – boys in the top-performing education systems score much higher in reading than girls elsewhere. These results strongly suggest that gender gaps in school performance are not determined by innate differences in ability. A concerted effort by parents, teachers, policy makers and opinion leaders is needed if both boys and girls are to be able to realise their full potential and contribute to the economic growth and well-being of their societies.
Data underlying the figures
The data tables are listed in Annex B and available on line at www.oecd.org/pisa. Five symbols are used to denote missing data:
a The category does not apply in the country concerned. Data are therefore missing. c There are too few observations or no observation to provide reliable estimates (i.e. there
are fewer than 30 students or less than five schools with valid data).
m Data are not available. These data were not submitted by the country or were collected but subsequently removed from the publication for technical reasons.
w Data have been withdrawn or have not been collected at the request of the country concerned.
x Data are included in another category or column of the table.
Country coverage
This publication features data on 64 countries and economies: 34 OECD countries (indicated in black in the figures) and 30 partner countries and economies (indicated in blue in the figures).
Calculating international averages
An OECD average was calculated for most indicators presented in this report. The OECD average corresponds to the arithmetic mean of the respective country estimates. Readers should, therefore, keep in mind that the term “OECD average” refers to the OECD countries included in the respective comparisons.
Rounding figures
Because of rounding, some figures in tables may not exactly add up to the totals. Totals, differences and averages are always calculated on the basis of exact numbers and are rounded only after calculation. All standard errors in this publication have been rounded to one or two decimal places. Where the value 0.00 is shown, this does not imply that the standard error is zero, but that it is smaller than 0.005.
Bolding of estimates
This report discusses only statistically significant differences or changes (statistical significance at the 5% level). These are denoted in darker colours in figures and in bold in tables.
Reporting student data
The report uses “15-year-olds” as shorthand for the PISA target population. PISA covers students who are aged between 15 years 3 months and 16 years 2 months at the time of assessment and who have completed at least 6 years of formal schooling, regardless of the type of institution in which they are enrolled and of whether they are in full-time or part-time education, of whether they attend academic or vocational programmes, and of whether they attend public or private schools or foreign schools within the country.
Note regarding Israel
The statistical data for Israel are supplied by and under the responsibility of the relevant Israeli authorities. The use of such data by the OECD is without prejudice to the status of the Golan Heights, East Jerusalem and Israeli settlements in the West Bank under the terms of international law.
Note regarding the Russian Federation in the Survey of Adult Skills
Readers should note that the sample for the Russian Federation does not include the population of the Moscow municipal area. The data published, therefore, do not represent the entire resident population aged 16-65 in Russia but rather the population of Russia excluding the population residing in the Moscow municipal area.
More detailed information regarding the data from the Russian Federation as well as that of other countries that participated in the Survey of Adult Skills can be found in the Technical Report of the Survey of Adult Skills (OECD, 2013).
This chapter examines trends in achievement among girls and boys and identifies the school subjects – and the specific sets of skills associated with those subjects – in which boys and girls appear to excel – or fail.
Emerging Gender Gaps
in Education
Over the past century, OECD countries have made significant progress in narrowing or closing long-standing gender gaps in many areas of education and employment, including educational attainment, pay and labour market participation. This one fact implies another: that aptitude knows no gender. Given equal opportunities, boys and girls, men and women have equal chances of fulfilling their potential.
But new gender gaps are opening. Young men are significantly more likely than young women to have low levels of skills and poor academic achievement, and are more likely to leave school early, often with no qualifications. Meanwhile, in higher education and beyond, young women are under-represented in the fields of mathematics, physical science and computing, but dominate the fields of biology, medicine, agriculture and humanities (Osborne et al., 2003; Charles and Grusky, 2004).
Many boys find school out of sync with their interests and preferences and, as a result, often feel disaffected and not motivated to work in school. Given the findings of the 2012 Survey of Adult Skills1 – that poor proficiency in numeracy and literacy severely limits access to better paying and more rewarding occupations, and has a negative impact on health and on social and political participation (OECD, 2013) – the underachievement of young men has severe consequences not only for their own futures (Erikson et al., 2005; Rose and Betts, 2004), but for societies as a whole (OECD, 2010). Indeed, poor performance in school is a strong predictor of early school dropout, which is related to far worse social outcomes later in life (Balfanz et al., 2007; OECD, 2010; Oreopoulos, 2007; Rumberger, 2011).
What the data tell us
• Across OECD countries in 2012, 14% of boys and 9% of girls did not attain the PISA baseline level of proficiency in any of the three core subjects.
• In 2012, boys outperformed girls in mathematics in 38 participating countries and economies by an average of 11 score points (across OECD countries) while no gender gap was observed in science performance. However, among the top 10% of students in mathematics performance, the gender gap averages 20 score points; and among the top 10% in science, boys score an average of 11 points higher than girls.
• Only 14% of young women who entered university for the first time in 2012 chose science-related fields, including engineering, manufacturing and construction; by contrast, 39% of young men who entered university that year chose to pursue one of those fields of study.
There are other, and considerable, social costs associated with low-performing students. If a large share of the workforce does not have basic skills, the long-term growth of an economy is compromised. Public finances may be squeezed to fund social benefits and higher healthcare costs. Moreover, since low-performing students are less likely to engage politically later on, the government has fewer incentives to unearth and examine the roots of their underperformance at school.
According to a recent estimate based on data from the OECD Programme for International Student Assessment (PISA), there would be massive long-term economic gains for OECD countries if reforms to reduce the number of low-performing students were implemented today (OECD, 2010). Equality of opportunity for men and women is first and foremost a moral imperative; but it is also key to economic growth and well-being. Investments in education improve economic and social opportunities, helping to reduce poverty and foster technological progress. The overall increase in educational attainment in OECD countries over the past 50 years accounted for about 50% of the economic growth in those countries during that period; and more than half of that growth can be attributed to higher educational attainment among women. In addition, education – especially education for girls and women – reduces child mortality rates, improves individual health and, in doing so, promotes investment in the education and health of future generations (OECD, 2012).
Progress in addressing gender segregation in occupations has been far slower (Sikora and Pokropek, 2011). Yet reducing occupation segregation could pay off in a couple of important ways. First, segregation suggests that there are impediments to choosing an occupation that are related to gender. Identifying and removing such impediments may improve efficiency in the transition from school to work, since then all students will feel encouraged to pursue studies in the field that interests them and in which they can fully express their potential. As a result, participation in the labour market will grow. Dismantling such barriers can also help the economy to respond to rapid changes in the demand for skills stemming from technological change. In addition, greater occupation equality may help to eliminate gender stereotypes that have a negative impact on the status of women (Anker, 1997).
To tackle the double disadvantage of having too many boys who drop out of school or leave school with low skills and/or skills that are not well matched with labour market requirements, and not having enough students, particularly female students, enrolled in the science, technology, engineering and mathematics (STEM) fields of study, countries need first to understand why there are gender gaps in academic achievement. Knowing how boys and girls develop their skills while at school and what factors – including such intangibles as behaviour and self-confidence – influence their decisions about their future education and career pathways is critical. Only then will educators and policy makers be able to ensure that each individual has the opportunity to realise his or her potential. Only then will countries be able to develop strong, dynamic and inclusive economies, particularly as they confront the economic, demographic and fiscal challenges that are sure to arise in the years ahead.
Historic progress in young Women’s education
Figure 1.1 shows that, since the early 1900s, the average number of years spent in education among the working-age population in OECD countries increased from 6 to 12 years for men and from 5 to 13 years for women. As OECD countries have made education compulsory, usually between the ages of 5 to 7 and 14 to 16, attaining secondary education has become the norm for men and women.
•
Figure 1.1 [1/2]•
Long-term trends in gender gaps in education, 1896-1980
Years
Source: Barro and Lee, 2013.
Men Women
Trends in years of schooling over the 20th century, OECD average
Trends in the percentage of men and women whose highest level of educational attainment is primary school, OECD average
Average years of schooling
14 12 10 8 6 4 2 0 1896-1900 1901-05 1906-10 1911-15 1916-20 1921-25 1926-30 1931-35 1936-40 1941-45 1946-50 1951-55 1956-60 1961-65 1966-70 1971-75 1976-80 Years % 100 90 80 70 60 50 40 30 20 10 0 1896-1900 1901-05 1906-10 1911-15 1916-20 1921-25 1926-30 1931-35 1936-40 1941-45 1946-50 1951-55 1956-60 1961-65 1966-70 1971-75 1976-80
Not only are more young women than ever before participating in formal education and enrolling in higher education, over the past decade the gender hierarchy in educational attainment has been inverted. In 2000, adult men had higher tertiary attainment rates than adult women; but by 2012, that had changed: 34% of women across OECD countries had attained a tertiary education compared with 30% of men (Table 1.1a). That same year, more young women (87%) than young men (81%) had graduated from an upper secondary programme (Table 1.1b). This trend is even more striking among students younger than 25. In 2012, 54% of graduates from upper secondary general programmes were women and 43% were men of that age group, on average. In Austria, the Czech Republic, Italy, Poland, the Slovak Republic and Slovenia, women outnumbered men as upper secondary graduates by at least three to two (Table 1.1b). Women are also participating more in advanced research programmes. In 2010, the proportion of advanced research degrees awarded to women ranged between 40% and 50% in most OECD countries (Table 1.1c).
•
Figure 1.1 [2/2]•
Long-term trends in gender gaps in education, 1896-1980
Source: Barro and Lee, 2013.
Men Women
Trends in the percentage of men and women who earned a tertiary degree, OECD average Years % 100 90 80 70 60 50 40 30 20 10 0 1896-1900 1901-05 1906-10 1911-15 1916-20 1921-25 1926-30 1931-35 1936-40 1941-45 1946-50 1951-55 1956-60 1961-65 1966-70 1971-75 1976-80
Young women are even making inroads into some education pathways that had traditionally attracted mostly men. Graduation rates from pre-vocational and vocational upper secondary programmes have been higher among men (50%, on average across OECD countries) than among women (46%, on average) (Table 1.1b). But in recent years, this trend has reversed in some countries. For example, in 2012 in Belgium, Denmark, Finland, Ireland, the Netherlands and Spain, the proportions of young women who graduated from upper secondary pre-vocational and vocational programmes were at least 5 percentage points larger than the proportions of men who did.
And, as results from PISA have shown, girls do very well in school, too. In all countries and economies that participated in PISA 2012, girls outperformed boys in reading by an average of 38 score points (across OECD countries) – the equivalent of one year of school – as they have done consistently throughout all the PISA cycles since 2000. Boys, however, continued to outperform girls in mathematics in 38 participating countries and economies by an average of 11 score points (across OECD countries) – equivalent to around three months of school. PISA also reveals that there is very little difference in science performance between boys and girls (Tables 1.2a, 1.3a, 1.4a).
The changing landscape in education and labour markets has been accompanied by major shifts in what young boys and girls expect for their future. Over the past decade, PISA has asked the 15-year-old students who sit the triennial test in reading, mathematics and science to describe what they expect for their future education and occupation. Their reports suggest that girls hold more ambitious educational and occupational expectations than boys. At the same time, not only do boys seem less ambitious than girls, they are also more likely – far more likely – to expect that their formal education will end after earning an upper secondary degree, even when they do just as well as girls on the PISA assessment.
What these results imply is that, in the shadow of the progress that has been made in both education and employment over the past century, other problems are festering.
LoW-performing boys
Among the countries and economies that showed a gender gap, in favour of boys, in mathematics performance in 2003, by 2012 the gender gap had narrowed by nine PISA score points or more in Finland, Greece, Macao-China, the Russian Federation and Sweden. In Greece, while boys outperformed girls in mathematics by 19 points in 2003, by 2012 this difference had shrunk to 8 score points. In Finland, Macao-China, the Russian Federation, Sweden, Turkey and the United States, there was no longer a gender gap in mathematics performance favouring boys in 2012 compared to 2003. In Austria, Luxembourg and Spain, the gender gap favouring boys widened between 2003 and 2012. For example, in Austria in 2003, there was no observed gender gap in mathematics performance; but by 2012 there was a 22 score-point difference in performance in favour of boys. Iceland was one of the few countries where girls outperformed boys in mathematics in 2003; in 2012, girls still outperformed boys, but the gender gap had narrowed (Table 1.3b).
While a narrower gender gap in mathematics, in favour of boys, is undeniably good news, it comes as the result of a worrying trend: many low-performing boys are failing to improve. In Latvia, Portugal, the Russian Federation and Thailand, the share of girls who perform below proficiency Level 2 shrunk between 2003 and 2012 with no concurrent change in the share of low-performing boys. In Macao-China and the Russian Federation during the period, the share of top-performing girls increased with no such increase among boys. In addition, Italy, Poland, Portugal and the Russian Federation show a reduction in the share of girls who perform below Level 2 and an increase in the share of girls who perform at Level 5 or 6 (see Table I.2.2b in OECD, 2014a). Across all three of the core school subjects that PISA assesses – reading, mathematics and science – and across all PISA-participating countries and economies, girls are as likely as boys to be academic all-rounders, meaning that they score at PISA proficiency Level 5 or 6 in all subjects. On average across OECD countries, 4% of girls and 4% of boys are academic all-rounders, meaning that they are top performers in all three subjects. But while the gender gap among students who are top performers only in science is small (1% of boys and girls), it is large among top performers in mathematics only (3% of girls and 6% of boys) and in reading only (3% of girls and less than 1% of boys) (Table 1.7).
Stark gender differences are observed among the lowest-performing students – those who score below PISA proficiency Level 2, which is considered to be the baseline level of proficiency, in all subjects. While the proportion of girls is marginally larger than that of boys among poor performers in mathematics, in all but six countries, a larger proportion of boys than girls does not even achieve the baseline level of proficiency in any of the three PISA core subjects. In fact, six out of ten students who are low achievers in all three subjects are boys (Table 1.8).
Results presented in Figure 1.2 suggest that, across OECD countries, boys are 4 percentage points more likely than girls to be low-achievers in reading, science and mathematics. In 2012, 14% of boys and 9% of girls did not attain the PISA baseline level of proficiency in any of the three core subjects. The percentage of boys who failed to reach the baseline level of proficiency in any subject is worryingly high in many countries. More than one in five students in Chile, Greece, Israel, Mexico, the Slovak Republic and Turkey failed to make the grade in any of the three core PISA subjects. Among partner countries and economies, the proportions are even larger. In Indonesia, Jordan, Peru and Qatar more than one in two students failed to make the grade. The proportion of girls who failed to make the grade is much smaller. Peru is the only country that participated in PISA 2012 where more than one in two girls did not reach the baseline level of proficiency in any of the three subjects. In Chile and Mexico, more than one in five girls failed to make the grade in all three subjects, and in eight partner countries, more than one in three girls failed to make the grade (Table 1.8).
Among OECD countries, gender differences were particularly large in Israel, where the proportion of boys who scored below the baseline level in all three subjects was 12 percentage points larger than the proportion of girls with similar scores. The gender gap was 11 percentage points wide in Greece and Turkey, and more than 10 percentage points wide in the partner countries Bulgaria, Indonesia, Jordan, Malaysia, Montenegro, Qatar, Thailand and the United Arab Emirates.
•
Figure 1.2•
gender differences in the percentage of students who are low achievers in all subjects % Qatar Peru Jordan Indonesia Brazil Argentina Montenegro Colombia Tunisia Malaysia Albania Uruguay United Arab Emirates Bulgaria Mexico Thailand Kazakhstan Romania Serbia Chile Costa Rica Israel Greece Turkey Slovak Republic Sweden Iceland Lithuania Croatia Hungary France Portugal United States Luxembourg Italy Norway OECD average Russian Federation New Zealand Belgium Slovenia Spain Austria Latvia United Kingdom Australia Czech Republic Denmark Germany Chinese Taipei Netherlands Switzerland Ireland Poland Canada Finland Singapore Japan Macao-China Viet Nam Korea Liechtenstein Hong Kong-China Estonia Shanghai-China
Note: Gender differences that are statistically significant are marked in a darker tone.
Countries and economies are ranked in descending order of the percentage of boys who are low performers (below PISA proficiency Level 2) in reading, mathematics and science.
Source: OECD, PISA 2012 Database, Table 1.8.
70 60 50 40 30 20 10 0 Boys Girls
The sizeable number of boys who fail to make the grade in all three core PISA subjects is a major challenge for education systems. Students who perform poorly in all subjects are hard to motivate and keep in school because there is very little that teachers, school principals and parents can build on to promote improvement. Because of their very low levels of skills, these students may also feel disconnected from and disengaged with school. It may then become easier for these students to build an identity based on rebellion against school and formal education than to engage and invest the effort needed to break the vicious cycle of low performance and low motivation.
As Chapter 2 shows, boys’ behaviour, both in and outside of school, has a strong impact on their performance. Education systems in most countries appear to be unable to develop learning environments, pedagogical practices and curricula that relate to and engage the interests and dispositions of many teenage boys. What emerges from the analyses in Chapter 4 on the skills of adult men and women suggests that once young men have opportunities to practice their skills in real-world settings, they often thrive and pick up some of the skills, like reading skills, that they had failed to develop while at school.
HigH-performing girLs
Across OECD countries in 2012, women were awarded only a small proportion of university degrees in the fields of engineering, manufacturing and construction (28%) and computing (20%). Only in Estonia, Iceland, Italy, Luxembourg and Poland – and the partner countries Argentina and Colombia – was at least one in three graduates from these fields a woman (OECD, 2014b). This situation has changed only slightly since 2000, despite many initiatives to promote gender equality in OECD countries. In 2000, the European Union established a goal to increase the number of university graduates in mathematics, science and technology by at least 15% by 2010, and to reduce the gender imbalance in these subjects. So far, however, progress towards this goal has been marginal. The Czech Republic, Germany, Portugal, the Slovak Republic and Switzerland are the only five OECD countries in which the proportion of women in the broad field of science (which includes life sciences, physical sciences, mathematics and statistics, and computing) grew by at least 10 percentage points between 2000 and 2012. As a result, these countries are now closer to or even above the OECD average in this respect. Across OECD countries, the proportion of women in these fields has grown slightly, from 40% in 2000 to 41% in 2012 – even as the proportion of female graduates in all fields grew from 54% to 58% during the same period (Table 1.1d).
Although the proportion of women in engineering, manufacturing and construction is small, it also increased slightly, from 23% to 28%, over the past decade. But in 2012, only 14% of young women who entered university for the first time chose science-related fields, including engineering, manufacturing and construction; by contrast, 39% of young men who entered university that year chose to pursue one of those fields of study (Table 1.1e). This is significant not only because women are severely under-represented in the STEM fields of study and occupations, but also because graduates of these fields are in high demand in the labour market and because jobs in these fields are among the most highly paid (OECD, 2012).
•
Figure 1.3•
gender differences in mathematics across the performance distribution
Score-point difference (B - G) Colombia Luxembourg Chile Costa Rica Liechtenstein Austria Peru Italy Korea Japan Brazil Spain Hong Kong-China Ireland Tunisia New Zealand Mexico Denmark Argentina Germany Switzerland United Kingdom Australia Czech Republic Israel Croatia Uruguay Portugal Belgium OECD average Netherlands Canada Viet Nam Slovak Republic Serbia Hungary France Greece Turkey Shanghai-China Chinese Taipei Estonia United States Indonesia Poland Romania Slovenia Macao-China Norway Kazakhstan Lithuania Montenegro Albania Russian Federation Bulgaria Sweden Finland Singapore Latvia United Arab Emirates
Iceland Malaysia Thailand Qatar Jordan Colombia Luxembourg Chile Costa Rica Liechtenstein Austria Peru Italy Korea Japan Brazil Spain Hong Kong-China Ireland Tunisia New Zealand Mexico Denmark Argentina Germany Switzerland United Kingdom Australia Czech Republic Israel Croatia Uruguay Portugal Belgium OECD average Netherlands Canada Viet Nam Slovak Republic Serbia Hungary France Greece Turkey Shanghai-China Chinese Taipei Estonia United States Indonesia Poland Romania Slovenia Macao-China Norway Kazakhstan Lithuania Montenegro Albania Russian Federation Bulgaria Sweden Finland Singapore Latvia
United Arab Emirates
Iceland
Malaysia Thailand Qatar Jordan
Note: Gender differences among each group that are statistically significant are marked in a darker tone.
Countries and economies are ranked in descending order of the score-point difference between boys and girls (boys – girls) among average students.
Source: OECD, PISA 2012 Database, Table 1.3a.
50 40 30 20 10 0 -10 -20 -30 -40 Average
Lowest-achieving students (10th percentile) Highest-achieving students (90th percentile)
•
Figure 1.4•
gender differences in science across the performance distribution
Score-point difference (B - G) Note: Gender differences among each group that are statistically significant are marked in a darker tone.
Countries and economies are ranked in descending order of the score-point difference between boys and girls (boys – girls) among average students.
Source: OECD, PISA 2012 Database, Table 1.4a .
40 30 20 10 0 -10 -20 -30 -40 -50 -60 Average
Lowest-achieving students (10th percentile) Highest-achieving students (90th percentile)
Colombia Liechtenstein Luxembourg United Kingdom Costa Rica Japan Denmark Austria Spain Slovak Republic Chile Hong Kong-China Mexico Switzerland Peru Shanghai-China Australia New Zealand Ireland Belgium Korea Netherlands Hungary Canada Italy OECD average Viet Nam Tunisia Chinese Taipei Czech Republic Brazil Germany Singapore Israel Uruguay Macao-China United States Portugal Croatia Estonia France Poland Iceland Indonesia Norway Serbia Romania Russian Federation Argentina Albania Sweden Kazakhstan Slovenia Turkey Malaysia Greece Lithuania Latvia Finland Montenegro Thailand Bulgaria United Arab Emirates Qatar Jordan Colombia Liechtenstein Luxembourg United Kingdom Costa Rica Japan Denmark Austria Spain Slovak Republic Chile Hong Kong-China Mexico Switzerland Peru Shanghai-China Australia New Zealand Ireland Belgium Korea Netherlands Hungary Canada Italy OECD average Viet Nam Tunisia Chinese Taipei Czech Republic Brazil Germany Singapore Israel Uruguay Macao-China United States Portugal Croatia Estonia France Poland Iceland Indonesia Norway Serbia Romania Russian Federation Argentina Albania Sweden Kazakhstan Slovenia Turkey Malaysia Greece Lithuania Latvia Finland Montenegro Thailand Bulgaria
United Arab Emirates Qatar
PISA results show that boys continue to perform better than girls in mathematics, particularly among the highest-achieving students. While gender differences in science and problem-solving performance are small, on average, boys tend to be over-represented among the highest achievers. As noted above, in PISA 2012 boys outperformed girls in mathematics in 38 participating countries and economies by an average of 11 score points (across OECD countries); but among the top 10% of students in mathematics performance, this gap is as wide as 20 score points, on average across OECD countries (Figure 1.3 and Table 1.3a). In science, among the best-performing 10% of students, boys have an advantage of 11 points over girls. Only in Jordan and Qatar do high-achieving girls have better scores in science than high-achieving boys. On average, however, girls outperform boys in science in 16 countries and economies, while boys outperform girls in 10 countries and economies (Figure 1.4 and Table 1.4a).
A closer look at girls’ performance in mathematics and science reveals that girls still lag behind boys in being able to “think like scientists”. For example, girls tend to underachieve compared to boys when they are asked to formulate situations mathematically, translating a word problem into a mathematical expression (Table 1.10a). On average across OECD countries, boys outperform girls in this skill by around 16 points, while the average gender gap in mathematics as a whole is 11 score points. The largest differences in favour of boys are observed in Luxembourg (33 points), Austria (32 points), Chile (29 points), Italy (24 points), New Zealand (23 points) and Korea (22 points). Ireland, Mexico and Switzerland show a gender difference of 20 points, while the United States shows a gender gap of 8 points. Among partner countries and economies, boys outperform girls in this skill by 33 points in Costa Rica, and by between 20 and 30 points in Brazil, Colombia, Hong Kong-China, Liechtenstein, Peru, Tunisia and Uruguay. In several partner countries and economies, the gap is less than 10 points: Macao-China (9 points), Shanghai-China (8 points), Kazakhstan (7 points) and Montenegro (6 points). Only in Qatar do girls outperform boys (by 9 points) in this specific skill (Table 1.10a).
•
Figure 1.5•
boys’ and girls’ strengths and weaknesses in mathematics Score-point difference between boys and girls, OECD countries
Mathematics Formulating situations mathematically Employing mathematical concepts and procedures Interpreting mathematical outcomes Note: Gender differences that are statistically significant are marked in a darker tone.
Source: OECD, PISA 2012 Database, Tables 1.3a, 1.10a, 1.10b and 1.10c.
Score-point difference (B – G) 30 25 20 15 10 5 0 -5 -10 10th percentile Average 90th percentile
Girls also lag behind boys when they are required to explain phenomena scientifically (Table 1.11b). Boys’ strength in science lies in their greater capacity, on average, to apply their knowledge of science to a given situation, to describe or interpret phenomena scientifically and predict changes. On average across OECD countries, boys outperform girls in this specific skill by 15 score points. The gender gap is particularly large in Chile (34 score points), Luxembourg (25 points), Hungary and the Slovak Republic (both 22 points), and in the Czech Republic, Denmark, Germany and the United Kingdom (21 points) (Table 1.11b).
The analysis presented in Chapter 3 suggests that high-performing girls’ underachievement in mathematics and science, particularly in tasks that require them to formulate problems mathematically or to explain phenomena scientifically, may have a lot to do with girls’ confidence in their own ability in these subjects. When students are more self-confident, they give themselves the freedom to fail, to engage in trial-and-error processes that are fundamental to acquiring knowledge in mathematics and science. Girls tend to be more fearful of making mistakes, perhaps because they cannot distinguish, psychologically, between “I made a mistake” and “I am mistaken”.
Self-confidence is also what enables high-achieving students to reach their potential and not choke under pressure. PISA reveals that self-efficacy (the extent to which students believe in their own ability to solve specific mathematics tasks) and self-concept (students’ beliefs in their own mathematics abilities) are much more strongly associated with performance among high-achieving than low-high-achieving students (see Chapter 3); but at every level of performance, girls tend to have much lower levels of self-efficacy and self-concept in mathematics and science. For example, among students who perform at Level 5 or 6 in mathematics, boys have much higher levels of mathematics self-efficacy and mathematics self-concept, and much less mathematics
•
Figure 1.6•
boys’ and girls’ strengths and weaknesses in science Score-point difference between boys and girls, OECD countries
Science Identifying
scientific issues Explaining phenomena scientifically scientific evidenceUsing Note: All gender differences are statistically significant.
Source: OECD, PISA 2006 Database, Tables 1.4b, 1.11a, 1.11b and 1.11c.
Score-point difference (B – G) 30 20 10 0 -10 -20 -30 10th percentile Average 90th percentile
It is harder for girls to perform well in these types of tasks, even among low achievers It is harder for boys to perform well
in these types of tasks, even among high achievers
anxiety than girls (Table 3.6c). And while girls have less self-efficacy and lower self-concept, they tend to be highly motivated to do well in school and to believe that doing well at school is important (Table 2.15). They also tend to fear negative evaluations by others more than boys do, and are eager to meet others’ expectations for them. Given girls’ keen desire to succeed in school and to please others, their fear of negative evaluations, and their lower self-confidence in mathematics and science, it is hardly surprising that high-achieving girls choke under (often self-imposed) pressure.
WHat Happens as girLs and boys pursue furtHer education or Work
The underachievement of boys in reading and in completing secondary and tertiary education, and the underachievement of girls in STEM subjects are particularly worrying because they are likely to have long-lasting consequences for young people’s participation in the labour market and on countries’ economic growth. For example, educational attainment, literacy proficiency and field of study jointly determine the likelihood that 16-29 year-olds will find themselves neither employed nor in education or training (NEET). Educational attainment and field of study also have an impact on people’s wages, especially young people’s wages. According to analyses conducted across countries, fields like teacher training, education science and humanities appear to carry a wage penalty for young workers (OECD, 2014b).
When individuals’ potential is realised through education, people are more productive at work and their capacity to innovate may increase (Lucas, 1988; Romer, 1990; Howitt and Aghion, 1998; Nelson and Phelps, 1966; Benhabib and Spiegel, 2005; Arnold et al., 2011; Eberhardt and Teal, 2010; Canton, 2007; Thévenon et al., 2012). Conversely, economic growth is hindered when parts of the population do not reach their full potential. When young people choose to pursue a field of study based on someone else’s idea of what is appropriate, rather than on their own preference, it is both a waste of individual potential and a loss for society.
Not surprisingly, PISA has consistently found that 15-year-old girls have higher expectations for their future careers than boys. But as the Survey of Adult Skills shows, by the time those students are in their late 20s, their reality looks very different. As noted in Chapter 4, in 2000, 36% of 15-year-old boys and 43% of girls that age expected to work as managers or professionals when they were 30; but in 2012, when those students were around 27 years old, only 22% of 25-34 year-old men and 23% of 25-34 year-old women worked in such occupations.
What the findings above imply is that there is something going on at the two ends of the performance spectrum, specifically among boys who are low achievers, particularly in reading, and among girls who are high achievers, particularly in mathematics. Low-achieving boys appear to be trapped in a cycle of poor performance, low motivation, disengagement with school and lack of ambition, while high-achieving girls are somehow thwarted from using their mathematical skills in more specialised higher education and, ultimately, in their careers.
What’s going on? An analysis of results from PISA 2012 can try to answer that question. With a sample of more than 400 000 students from over 65 education systems around the world and data collection at regular intervals since the year 2000, PISA is invaluable for understanding the origins
of gender differences in academic achievement. PISA data indicate that students’ performance varies more depending on where the student lives than on whether the student is a boy or a girl, and that, across countries, boys and girls show similar, albeit gender-specific, approaches to school and learning. PISA also collects a wealth of information about how individual students use their time, and how they feel about school and about the subjects they study in school, so that performance results can be analysed in the context of students’ attitudes and behaviours. While PISA cannot measure the effect of gender stereotyping on students’ academic achievement, it can go a long way towards showing how students’ actions and attitudes – which are often, even unconsciously, influenced by social norms, including gender stereotypes – can make all the difference in whether or not boys and girls success in school – and beyond.
Note
1. The Survey of Adult Skills is a product of the OECD Programme for the International Assessment of Adult Competencies (PIAAC).
Note regarding israel
The statistical data for Israel are supplied by and under the responsibility of the relevant Israeli authorities. The use of such data by the OECD is without prejudice to the status of the Golan Heights, East Jerusalem and Israeli settlements in the West Bank under the terms of international law.
References
Anker, R. (1997), “Occupational Segregation by Sex”, International Labour Review, Geneva, Vol. 13. Arnold J., A. Bassanini and S. Scarpetta (2011), “Solow or Lucas? Testing the speed of convergence on a panel of OECD countries”, Research in Economics, Vol. 65, pp. 110-23.
Balfanz, R., L. Herzog, L and D.J. Mac Iver (2007), “Preventing student disengagement and keeping students on the graduation path in urban middle-grades schools: Early identification and effective interventions”, Educational Psychologist, Vol. 42/4, pp. 223-235.
Barro, R. and J.W. Lee (2013), “A New Data Set of Educational Attainment in the World, 1950-2010”, Journal of Development Economics, Vol. 104, pp. 184-198.
Benhabib, and M. Spiegel (2005), “Human capital and technology diffusion”, in P. Aghion and Steven Durlauf (ed.), Handbook of Economic Growth, first edition, Vol. 1, Elsevier, pp. 935-966.
Canton, E. (2007), “Social returns to education: Macro-evidence”, De Economist, Vol. 155/4, pp. 449-66. Charles, M. and D.B. Grusky (2004), Occupational Ghettos: The Worldwide Segregation of Women and Men, Stanford University Press, Stanford, CA.
Eberhardt, M. and F. Teal (2010), “Aggregation versus heterogeneity in cross-country growth empirics”, CSAE Working Paper Series, Vol. 32, University of Oxford.
Erikson, R. et al. (2005), “On class differentials in educational attainment”, Proceedings of the National Academy of Sciences, Vol. 102/27, pp. 9730-9733.
Howitt, P. and P. Aghion (1998), “Capital accumulation and innovation as complementary factors in long-run growth,” Journal of Economic Growth, Vol. 3/2, pp. 111-30.
Lucas, R.E. (1988), “On the mechanics of economic development”, Journal of Monetary Economics, Vol. 22/3, pp. 3-42.
Nelson, R. and E. Phelps (1966), “Investments in human, technological diffusion, and economic growth”, American Economic Review, Vol. 56/2, pp. 69-75.
OECD (2014a), PISA 2012 Results: What Students Know and Can Do (Volume I, Revised edition, February 2014): Student Performance in Mathematics, Reading and Science, PISA, OECD Publishing, Paris, http://dx.doi.org/ 10.1787/9789264208780-en.
OECD (2014b), OECD Employment Outlook 2014, OECD Publishing, Paris, http://dx.doi.org/10.1787/ empl_outlook-2014-en.
OECD (2013), OECD Skills Outlook 2013: First Results from the Survey of Adult Skills, OECD Publishing, Paris, http://dx.doi.org/10.1787/9789264204256-en.
OECD (2012), Closing the Gender Gap: Act Now, OECD Publishing, Paris, http://dx.doi.org/10.1787/ 9789264179370-en.
OECD (2010), The High Cost of Low Educational Performance: The Long-Run Economic Impact of Improving PISA Outcomes, OECD Publishing, Paris, http://dx.doi.org/10.1787/9789264077485-en.
Oreopoulos, P. (2007). “Do dropouts drop out too soon? Wealth, health and happiness from compulsory schooling,” Journal of Public Economics, Vol. 91/11-12, pp. 2213-2229.
Osborne, J.F., S. Simon and S. Collins (2003), “Attitudes towards science: A review of the literature and its implications”, International Journal of Science Education, Vol. 25/9, pp. 1049-1079.
Romer, Paul M. (1990), “Human capital and growth: Theory and evidence,” Carnegie-Rochester Conference Series on Public Policy, Vol. 32/1, pp. 251-286.
Rose, H. and J.R. Betts, (2004), “The effect of high school courses on earnings”, The Review of Economics and Statistics, Vol. 86/2, pp. 497-513.
Rumberger, R.W. (2011), Why Students Drop Out of High School and What Can Be Done About It, Harvard University Press, Cambridge, MA.
Sikora, J. and A. Pokropek (2011), “Gendered career expectations of students: Perspectives from PISA 2006”, OECD Education Working Papers, No. 57, OECD Publishing, Paris, http://dx.doi.org/10.1787/ 5kghw6891gms-en. Thévenon, O. et al. (2012), “The effects of reducing gender gaps in education and labour force participation on economic growth in the OECD “, OECD Social, Employment and Migration Working Papers, No. 138, OECD Publishing, Paris, http://dx.doi.org/10.1787/5k8xb722w928-en.
This chapter examines gender differences in the activities in which boys and girls engage outside of school, in their ability to regulate their behaviour and emotions, in engagement with school and attitudes towards learning, and in the marks boys and girls receive in school. All of these ultimately have an impact on students’ futures, both in school and beyond.
Tackling Underperformance
among Boys
PISA results have consistently shown that boys are more likely than girls to be overall low-achievers, meaning that they are more likely than girls to perform below the baseline level of proficiency in all three of the subjects that are tested in PISA: reading, mathematics and science. And boys are especially more likely to struggle with reading. Why do boys underachieve, particularly in reading? Sifting through the many stories told through PISA data, the story of gender differences in 15-year-old students’ performance involves two main characters: low-achieving boys – particularly in reading – and high-achieving girls – particularly in mathematics and science. How do these characters navigate their way through education while being pushed and pulled by the strong, sometimes contradictory, pressures of adolescence? To what extent do their peers shape their attitudes towards school and learning? In school, how do they behave with their teachers and their fellow students? Which education pathways do they choose, and why? And when they get home from school, how do they spend their afternoons and evenings? What do they do over the weekend and during school holidays? What do they tear themselves away from when their parents call them to the dinner table?
What the data tell us
• On average across OECD countries, only one in four boys, but more than one in two girls, reported that they had never played a one-player game on a computer; and 29% of boys but 71% of girls reported that they had never played collaborative online games.
• Across OECD countries, girls spend 5.5 hours per week doing homework, while boys spend a little less than 4.5 hours, on average. For each hour per week students spend doing homework, their score in reading, mathematics and science is 4 points higher, on average.
• Boys in OECD countries are twice as likely as girls to report that school is a waste of time, and are 5 percentage points more likely than girls to agree or strongly agree that school has done little to prepare them for adult life when they leave school.
Tackling underperformance among boys requires first examining some of the differences in how boys and girls spend their time, both in school and after school, and in their behaviour and attitudes towards each other and towards their teachers. This chapter discusses gender differences in the activities boys and girls engage in outside of school, such as the amount of time they spend on line and how they use this time, and how much they read for enjoyment rather than, for example, playing chess or programming a computer. It then examines gender differences in self-regulation, engagement with school, and attitudes towards learning, such as intrinsic motivation. All of these factors help to explain the gender gap in academic performance in a standardised assessment like PISA. They are also reflected in the marks boys and girls receive in school, which have significant consequences for students’ future.
In a nutshell:
• Boys are more likely than girls to play video games.
• Boys are more likely than girls to spend time on computers and the Internet.
• Boys are less likely than girls to read outside of school for enjoyment.
• Boys are less likely than girls to enjoy activities connected with reading.