repository: http://orca.cf.ac.uk/105464/
This is the author’s version of a work that was submitted to / accepted for publication.
Citation for final published version:
Lagos, Claudia del P., Stevens, Adam R. H., Bower, Richard G., Davis, Timothy, Contreras, Sergio,
Padilla, Nelson D., Obreschkow, Danail, Croton, Darren, Trayford, James W., Welker, Charlotte
and Theuns, Tom 2018. Quantifying the impact of mergers on the angular momentum of simulated
galaxies. Monthly Notices of the Royal Astronomical Society 473 (4) , pp. 4956-4974.
10.1093/mnras/stx2667 file
Publishers page: https://doi.org/10.1093/mnras/stx2667 <https://doi.org/10.1093/mnras/stx2667>
Please note:
Changes made as a result of publishing processes such as copy-editing, formatting and page
numbers may not be reflected in this version. For the definitive version of this publication, please
refer to the published source. You are advised to consult the publisher’s version if you wish to cite
this paper.
This version is being made available in accordance with publisher policies. See
http://orca.cf.ac.uk/policies.html for usage policies. Copyright and moral rights for publications
made available in ORCA are retained by the copyright holders.
Quantifying the impact of mergers on the angular momentum of
simulated galaxies
Claudia del P. Lagos
1,2⋆, Adam R. H. Stevens
3, Richard G. Bower
4, Timothy A. Davis
5,
Sergio Contreras
6, Nelson D. Padilla
6,7, Danail Obreschkow
1,2, Darren Croton
3, James
W. Trayford
4, Charlotte Welker
1,2, Tom Theuns
41International Centre for Radio Astronomy Research (ICRAR), M468, University of Western Australia, 35 Stirling Hwy, Crawley, WA 6009, Australia. 2Australian Research Council Centre of Excellence for All-sky Astrophysics (CAASTRO), 44 Rosehill Street Redfern, NSW 2016, Australia.
3Centre for Astrophysics & Supercomputing, Swinburne University of Technology, Hawthorn, VIC 3122, Australia.
4Institute for Computational Cosmology, Department of Physics, University of Durham, South Road, Durham, DH1 3LE, UK. 5Astronomy, Cardiff University, Queens Buildings, The Parade, Cardiff CF24 3AA, United Kingdom.
6Instituto de Astrof´ısica, Pontificia Universidad Cat´olica de Chile, Avda. Vicu˜na Mackenna 4860, 782-0436 Macul, Santiago, Chile. 7Centro de Astro-Ingenier´ıa, Pontificia Universidad Cat´olica de Chile, Avda. Vicu˜na Mackenna 4860, 782-0436 Macul, Santiago, Chile.
12 October 2017
ABSTRACT
We useEAGLEto quantify the effect galaxy mergers have on the stellar specific angular momentum of
galax-ies,jstars. We split mergers into: dry (gas-poor)/wet (gas-rich), major/minor, and different spin alignments
and orbital parameters. Wet (dry) mergers have an average neutral gas-to-stellar mass ratio of1.1(0.02),
while major (minor) mergers are those with stellar mass ratios>0.3(0.1−0.3). We correlate the positions
of galaxies in thejstars-stellar mass plane atz = 0with their merger history, and find that galaxies of low
spins suffered dry mergers, while galaxies of normal/high spins suffered predominantly wet mergers, if any.
The radialjstarsprofiles of galaxies that went through dry mergers are deficient by≈0.3dex atr.10r50
(withr50 being the half-stellar mass radius), compared to galaxies that went through wet mergers.
Study-ing the merger remnants reveals that dry mergers reducejstars by≈ 30%, while wet mergers increase it
by≈ 10%, on average. The latter is connected to the build-up of the bulge by newly formed stars of high
rotational speed. Moving from minor to major mergers accentuates these effects. When the spin vectors of
the galaxies prior to the dry merger are misaligned,jstars decreases to a greater magnitude, while in wet
mergers co-rotation and high orbital angular momentum efficiently spun-up galaxies. We predict what would
be the observational signatures in thejstarsprofiles driven by dry mergers: (i) shallow radial profiles and (ii)
profiles that rise beyond≈10r50, both of which are significantly different from spiral galaxies.
Key words: galaxies: formation galaxies: evolution galaxies: fundamental parameters -galaxies: structure
1 INTRODUCTION
Galaxy mergers are a natural consequence of the hierarchical growth of structures (White & Rees 1978) and since early on have been posed to be a key physical process in their morphological transformation (e.g.Toomre & Toomre 1972;Toomre 1977;White 1978;Farouki & Shapiro 1982;Barnes 1988). Since then, galaxy mergers have become an essential process in cosmological galaxy formation models (e.g.Cole et al. 2000;Springel et al. 2001;De Lucia et al. 2006;Bower et al. 2006;Lagos et al. 2008; seeBaugh 2006for a review).
In the context of the angular momentum (AM) of galaxies,Fall(1983) presented the first observational compilation of the specific AM of the stellar component of galaxies,jstars, and its relation with stellar mass,Mstars.Fall(1983) found that elliptical and spiral galaxies follow parallel sequences, with the former havingjstarsa factor of≈ 6lower than the latter.Fall(1983) concluded that in hierarchical cosmologies thejstarsvalues of spirals and ellipticals could be understood if spirals roughly conservejin their formation process (see also Mo et al. 1998), while ellipticals suffer efficientjdissipation. Galaxy mergers are a natural dissipative phenomenon which could account for the galaxy population of low spins. Early simulations (e.g.Barnes & Efstathiou 1987;Navarro & White 1994;Heyl et al. 1996;Zavala et al. 2008) showed that dynamical friction can efficiently move highjmaterial to the outer regions of galaxies, effectively lowering thejstarsof the stellar component that is easily measurable. Later on,Romanowsky & Fall(2012), via idealised models within theΛcold dark matter
(ΛCDM) paradigm, showed that galaxy mergers can naturally explain the positions of elliptical galaxies in thejstars−Mstarsplane, and that disks and bulges follow fundamentally differentjstars−Mstarsrelations. Recently, using theEAGLEsimulations,Zavala et al.(2016) showed that the AM loss of a galaxy’s stellar component follows closely that of the inner parts of its halos, which would be naturally explained by the merging activity of halos and galaxies at low redshifts. Using the same simulations,Lagos et al.(2017) found that mergers were not the only responsible of small spins, but that galaxies could also have lowjstarsdue to early quenching.
Recent observational measurements ofjstarsusing the Sydney-AAO Multi-object Integral field unit (IFU) spectrograph (SAMI;Croom et al. 2012) byCortese et al.(2016), have suggested that galaxies form a continuous sequence in thejstars−Mstarsplane, instead of the two se-quences originally found byFall(1983).Cortese et al.(2016) found that the positions of galaxies in thejstars−Mstarsplane were strongly correlated with the Hubble morphological type, S`ersic index and the spin parameter of the starsλR, which provides a measurement of how rotationally supported a galaxy is (Emsellem et al. 2007).Cortese et al.(2016) concluded that the large-scale morphology of galaxies is regulated by their mass and dynamical state. Similarly,Obreschkow & Glazebrook(2014) showed that the relation between the diskjand mass has a scatter that correlates with the bulge-to-total mass ratio, arguing that the physical processes giving rise to the bulge also affect the formation of the disk, and thus there may not be a fundamental distinction between bulges and disks. It is unclear though how much of this result is driven by the sample being dominated by pseudo rather than classic bulges.
This may not, however, be the full story.Emsellem et al.(2011) showed that early-type galaxies, from theAT LAS3D
survey, have a large variety ofλRvalues and thus they cannot be seen as one uniform type of galaxy.Emsellem et al.(2011) found two broad classifications for early-type galaxies: fast and slow rotators. Some important trends found byEmsellem et al.(2011) and extended recently to higher stellar masses byVeale et al.(2017), is that the fraction of slow rotators increases steeply with stellar mass, and that the vast majority of S0 galaxies are fast rotators. All these observations measure kinematics of galaxies within a relatively small area of the galaxy (typically1
effective radius), which leaves open the question of whether galaxies with low spins are the result of a major loss of totaljstarsor simply a rearrangement ofjstarsin spite of totaljconservation. These formation scenarios are not mutually exclusive, and thus one has to ask what gives rise to such variety of observed dynamical states in galaxies, and particularly, early-types.
Jesseit et al.(2009),Bois et al. (2011) andNaab et al.(2014) found that the formation paths of slow and fast rotators can be very varied. For example,Naab et al.(2014) showed that slow rotators could be formed as a result of wet major mergers, dry major mergers and dry minor mergers. In the case of wet mergers, the remnant can be either fast or slow rotators, or even disks (e.g.Bekki 1998;Springel 2000;Cox et al. 2006;Robertson et al. 2006;Johansson et al. 2009;Peirani et al. 2010;Lotz et al. 2010;Naab et al. 2014;Moreno et al. 2015;Sparre & Springel 2016b).Di Matteo et al.(2009) showed that even dry major mergers of pressure supported galaxies can result in a rotation-supported disk if the orbital AM is large enough and efficiently transferred into the orbits of stars. Many of these mergers may result in a dramatic change in the morphology and spin of galaxies, but ultimately mergers are one of many physical processes at play, and continuing gas accretion and star formation can reshape the remnant morphology and kinematics. Recently, using cosmological hydrodynamical simulations,Sparre & Springel(2016a) found that galaxy remnants of major mergers evolve into star-forming disk galaxies unless sufficiently strong feedback is present to prevent the disk regrowth. This feedback is an essential mechanism in the new generation of cosmological hydrodynamical simulations, such as EAGLE(Schaye et al. 2015), Illustris (Vogelsberger et al. 2014) and Horizon-AGN (Dubois et al. 2014), and most likely plays a major role in reproducing the morphological diversity seen in galaxies (Dubois et al. 2016; Correa et al. 2017).
Although there is extensive literature for how different merger configurations can affect galaxies, cosmological hydrodynamical simula-tions are necessary to realistically represent the frequency of them in a galaxy population, and thus it is the best way of shedding light on why galaxies display the diversity ofjstarsseen in observations, especially as modern simulations reproduce the observations well (Teklu et al. 2015;Pedrosa & Tissera 2015;Genel et al. 2015;Zavala et al. 2016;Lagos et al. 2017;Sokolowska et al. 2016). This is the motivation of this work. We use theEAGLE(Schaye et al. 2015) cosmological hydrodynamical simulations to statistically study how galaxy mergers drive the positions of galaxies in thejstars−Mstarsplane. We also study the main parameters determining how much spin-up or down occurs, and the cumulative effect mergers may have in thez= 0galaxy population.EAGLEhas a good compromise between volume,(100 Mpc)3
, and resolution,700pc, that allows to us have a statistically significant sample of galaxies (several thousands withMstar >109M⊙) and with enough structural detail to be able to study mean radialjstarsprofiles.
EAGLEhas now been extensively tested against local and high-redshift observations of galaxy sizes (Furlong et al. 2015a), colours (Trayford et al. 2015), stellar masses and star formation rates (SFRs;Schaye et al. 2015;Furlong et al. 2015b), and the gas contents of galax-ies (Bah´e et al. 2016;Lagos et al. 2015,2016;Crain et al. 2016), among other properties, with high success. This gives us some confidence that we can useEAGLEto learn about the role of galaxy mergers in thejstars−Mstarsplane. The advent of IFU surveys, such as SAMI, MaNGA (Bundy et al. 2015) and MUSE (Bacon et al. 2010), and the first global measurements of jstars at high redshift (Burkert et al. 2016;Swinbank et al. 2017;Harrison et al. 2017), make our study very timely. Previous work studying AM inEAGLEhas focused on the galaxy/halo connection (Zavala et al. 2016), the star formation history effect on the AM (Lagos et al. 2017) and the structure of the AM and cooling gas in star-forming galaxiesStevens et al.(2016b). In this paper, we therefore present an independent, but complementary study of AM in galaxies.
This paper is organised as follows.§2briefly describes theEAGLEsimulation and introduces the parameters of mergers we study. Here we also present a comparison with observational measurements of merger rates, to show that the frequency of mergers is well represented inEAGLE. In§3we study the cumulative effect of galaxy mergers as seen by dissecting thez= 0galaxy population. We also compare the mean radialjstarsprofiles inEAGLEwith observations of early-type galaxies. We then focus on the effect galaxy mergers have on the net
Table 1. Features of the Ref-L100N1504EAGLEsimulation used in this paper. The row list: (1) comoving box size, (2) number of particles, (3) initial particle masses of gas and (4) dark matter, (5) comoving gravitational softening length, and (6) maximum physical comoving Plummer-equivalent gravitational softening length. Units are indicated in each row.EAGLEadopts (5) as the softening length atz>2.8, and (6) atz <2.8.
Property Units Value
(1) L [cMpc] 100
(2) # particles 2×15043
(3) gas particle mass [M⊙] 1.81×10⁶ (4) DM particle mass [M⊙] 9.7×10⁶
(5) Softening length [ckpc] 2.66
(6) max. gravitational softening [pkpc] 0.7
value ofjstarsas well as its radial distribution in galaxies, splitting mergers into minor/major, wet/dry and in spin and orbital parameters. Here we also connect the change injstarswith changes in the stellar mass distribution, and analyse the distribution of the stellar components of the galaxies prior to the merger and in the remnant. We present a discussion of our results and our main conclusions in§4. Finally, in AppendixAwe present a convergence study to show thatjstarsis well converged for the purpose of our study, in AppendixBwe analyse the robustness of our result against the time resolution of the main simulation used here, while AppendixCpresents additional plots that aid the interpretation of our results.
2 THE EAGLE SIMULATION
TheEAGLEsimulation suite (Schaye et al. 2015, hereafter S15, andCrain et al. 2015, hereafter C15) consists of a large number of cosmolog-ical hydrodynamic simulations with different resolutions, volumes and subgrid models, adopting thePlanck Collaboration(2014) cosmology. S15 introduced a reference model, within which the parameters of the sub-grid models governing energy feedback from stars and accreting black holes (BHs) were calibrated to ensure a good match to thez= 0.1galaxy stellar mass function, the sizes of present-day disk galaxies and the black hole-stellar mass relation (see C15 for details).
In Table1 we summarise the parameters of the simulation used in this work. Throughout the text we use pkpc to denote proper kiloparsecs and cMpc to denote comoving megaparsecs. A major aspect of theEAGLEproject is the use of state-of-the-art sub-grid models that capture unresolved physics. The sub-grid physics modules adopted byEAGLEare: (i) radiative cooling and photoheating, (ii) star formation, (iii) stellar evolution and enrichment, (iv) stellar feedback, and (v) black hole growth and active galactic nucleus (AGN) feedback. In addition, the fraction of atomic and molecular gas in each gas particle is calculated in post-processing followingLagos et al.(2015).
TheEAGLEsimulations were performed using an extensively modified version of the parallelN-body smoothed particle hydrodynamics (SPH) code GADGET-3 (Springel et al. 2008;Springel 2005). Among those modifications are updates to the SPH technique, which are collectively referred to as ‘Anarchy’ (seeSchaller et al. 2015afor an analysis of the impact of these changes on the properties of simulated galaxies compared to standard SPH). We use SUBFIND (Springel et al. 2001;Dolag et al. 2009) to identify self-bound overdensities of particles within halos (i.e. substructures). These substructures are the galaxies inEAGLE.
2.1 Merger parameters studied
We identify mergers using the merger trees available in theEAGLEdatabase (McAlpine et al. 2015). These merger trees were created using theD−Treesalgorithm ofJiang et al.(2014).Qu et al.(2017) described how this algorithm was adapted to work withEAGLEoutputs. Galaxies that went through mergers have more than one progenitor, and for our purpose, we track the most massive progenitors of merged galaxies, and compare the properties of those with that of the merger remnant to analyse the effect onjstars. The trees stored in the public database ofEAGLEconnect29epochs. The time span between snapshots can range from≈0.3Gyr to≈1Gyr. We use these snapshots to analyse the evolution ofjstarsin galaxies and the effect of mergers. We consider the interval between outputs appropriate, as our purpose is to analyse galaxies before and after, rather than during the merger. We study the robustness of our analysis to the time interval between outputs used in the simulations in AppendixBusing much finer time intervals (i.e. snipshots; S15). We find that our calculations are robust and do not sensitively depend on how fine the time interval between outputs are.
We split mergers into major and minor mergers. The former are those with a stellar mass ratio between the secondary and the primary galaxy> 0.3, while minor mergers have a mass ratio between0.1and 0.3. Lower mass ratios are considered unresolved and thus are classified as accretion (Crain et al. 2016).
In addition to defining minor and major mergers, we estimate the ratio of gas to stellar mass of the merger with the aim of classifying them as gas-rich (wet) or gas-poor (dry) mergers. This ratio is defined as:
fgas,merger≡ Ms neutral+M p neutral Ms stars+M p stars , (1) whereMs neutralandM p
neutralare the neutral gas masses of the secondary and primary galaxies, respectively, whileM s
starsandMstarsp are the corresponding stellar masses. Masses are measured within an aperture of30pkpc. Neutral gas fractions of individual particles inEAGLE are calculated as inLagos et al.(2015). Here, neutral gas refers to atomic plus molecular gas.
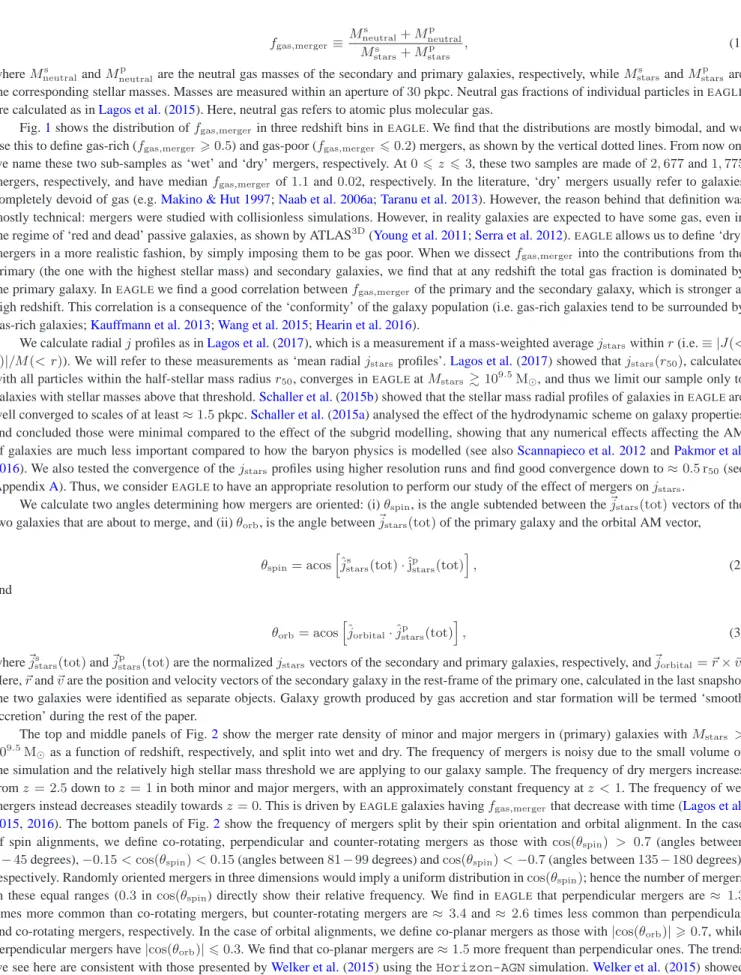
Fig.1shows the distribution offgas,mergerin three redshift bins inEAGLE. We find that the distributions are mostly bimodal, and we use this to define gas-rich (fgas,merger>0.5) and gas-poor (fgas,merger60.2) mergers, as shown by the vertical dotted lines. From now on, we name these two sub-samples as ‘wet’ and ‘dry’ mergers, respectively. At06z 63, these two samples are made of2,677and1,775
mergers, respectively, and have medianfgas,merger of1.1and0.02, respectively. In the literature, ‘dry’ mergers usually refer to galaxies completely devoid of gas (e.g.Makino & Hut 1997;Naab et al. 2006a;Taranu et al. 2013). However, the reason behind that definition was mostly technical: mergers were studied with collisionless simulations. However, in reality galaxies are expected to have some gas, even in the regime of ‘red and dead’ passive galaxies, as shown by ATLAS3D(Young et al. 2011;Serra et al. 2012).EAGLEallows us to define ‘dry’ mergers in a more realistic fashion, by simply imposing them to be gas poor. When we dissectfgas,mergerinto the contributions from the primary (the one with the highest stellar mass) and secondary galaxies, we find that at any redshift the total gas fraction is dominated by the primary galaxy. InEAGLEwe find a good correlation betweenfgas,mergerof the primary and the secondary galaxy, which is stronger at high redshift. This correlation is a consequence of the ‘conformity’ of the galaxy population (i.e. gas-rich galaxies tend to be surrounded by gas-rich galaxies;Kauffmann et al. 2013;Wang et al. 2015;Hearin et al. 2016).
We calculate radialjprofiles as inLagos et al.(2017), which is a measurement if a mass-weighted averagejstarswithinr(i.e.≡ |J(< r)|/M(< r)). We will refer to these measurements as ‘mean radialjstarsprofiles’.Lagos et al.(2017) showed thatjstars(r50), calculated with all particles within the half-stellar mass radiusr50, converges inEAGLEatMstars&109.5M⊙, and thus we limit our sample only to galaxies with stellar masses above that threshold.Schaller et al.(2015b) showed that the stellar mass radial profiles of galaxies inEAGLEare well converged to scales of at least≈1.5pkpc.Schaller et al.(2015a) analysed the effect of the hydrodynamic scheme on galaxy properties and concluded those were minimal compared to the effect of the subgrid modelling, showing that any numerical effects affecting the AM of galaxies are much less important compared to how the baryon physics is modelled (see alsoScannapieco et al. 2012andPakmor et al. 2016). We also tested the convergence of thejstarsprofiles using higher resolution runs and find good convergence down to≈0.5 r50(see AppendixA). Thus, we considerEAGLEto have an appropriate resolution to perform our study of the effect of mergers onjstars.
We calculate two angles determining how mergers are oriented: (i)θspin, is the angle subtended between the~jstars(tot)vectors of the two galaxies that are about to merge, and (ii)θorb, is the angle between~jstars(tot)of the primary galaxy and the orbital AM vector,
θspin= acos h ˆ jsstars(tot)·ˆj p stars(tot) i , (2) and θorb= acos h ˆ
jorbital·ˆjstarsp (tot) i
, (3)
where~jstarss (tot)and~j p
stars(tot)are the normalizedjstarsvectors of the secondary and primary galaxies, respectively, and~jorbital=~r×~v. Here,~rand~vare the position and velocity vectors of the secondary galaxy in the rest-frame of the primary one, calculated in the last snapshot the two galaxies were identified as separate objects. Galaxy growth produced by gas accretion and star formation will be termed ‘smooth accretion’ during the rest of the paper.
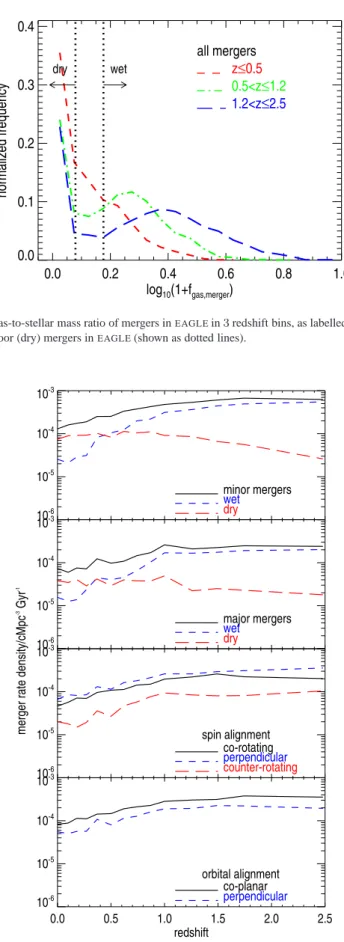
The top and middle panels of Fig.2show the merger rate density of minor and major mergers in (primary) galaxies withMstars >
109.5M
⊙as a function of redshift, respectively, and split into wet and dry. The frequency of mergers is noisy due to the small volume of the simulation and the relatively high stellar mass threshold we are applying to our galaxy sample. The frequency of dry mergers increases fromz = 2.5down toz = 1in both minor and major mergers, with an approximately constant frequency atz <1. The frequency of wet mergers instead decreases steadily towardsz= 0. This is driven byEAGLEgalaxies havingfgas,mergerthat decrease with time (Lagos et al. 2015,2016). The bottom panels of Fig.2show the frequency of mergers split by their spin orientation and orbital alignment. In the case of spin alignments, we define co-rotating, perpendicular and counter-rotating mergers as those withcos(θspin) > 0.7 (angles between
0−45degrees),−0.15<cos(θspin)<0.15(angles between81−99degrees) andcos(θspin)<−0.7(angles between135−180degrees), respectively. Randomly oriented mergers in three dimensions would imply a uniform distribution incos(θspin); hence the number of mergers in these equal ranges (0.3incos(θspin) directly show their relative frequency. We find inEAGLEthat perpendicular mergers are≈ 1.3
times more common than co-rotating mergers, but counter-rotating mergers are≈ 3.4and≈ 2.6times less common than perpendicular and co-rotating mergers, respectively. In the case of orbital alignments, we define co-planar mergers as those with|cos(θorb)|>0.7, while perpendicular mergers have|cos(θorb)|60.3. We find that co-planar mergers are≈1.5more frequent than perpendicular ones. The trends we see here are consistent with those presented byWelker et al.(2015) using theHorizon-AGNsimulation.Welker et al.(2015) showed that satellite galaxies on a decaying orbit towards the central galaxy tend to align with the galactic plane of the central in a way that, by the time they merge, are most likely to come in an orbit aligned with the galactic plane of the primary.Welker et al.(2015) also found that mergers taking place in filaments are more likely to be of galaxies withcos(θspin)≈0if the primary galaxy is a passive, spheroidal galaxy,
0.0 0.2 0.4 0.6 0.8 1.0 log10(1+fgas,merger) 0.0 0.1 0.2 0.3 0.4 normalized frequency all mergers z≤0.5 0.5<z≤1.2 1.2<z≤2.5 dry wet
Figure 1. The distribution of the neutral gas-to-stellar mass ratio of mergers inEAGLEin3redshift bins, as labelled. Distributions are mostly bimodal, and we use this to define gas-rich (wet) and gas-poor (dry) mergers inEAGLE(shown as dotted lines).
10-6 10-5 10-4 10-3 minor mergers wet dry 10-6 10-5 10-4 10-3
merger rate density/cMpc
-3 Gyr -1 major mergers wet dry 10-6 10-5 10-4 10-3 co-rotating perpendicular counter-rotating spin alignment 0.0 0.5 1.0 1.5 2.0 2.5 redshift 10-6 10-5 10-4 10-3 orbital alignment co-planar perpendicular
Figure 2. Merger rate density as a function of redshift inEAGLE. The top panel shows minor mergers and the subsamples of wet and dry minor mergers, as labelled. The middle panel is the same but for major mergers, while the bottom panels show mergers split into spin (i.e. co-rotating, perpendicular and counter-rotating) and orbital (i.e. co-planar and perpendicular) alignments, respectively.
0.0 0.5 1.0 1.5 2.0 2.5 3.0 redshift 0.01 0.10 1.00 10.00 merger rate/Gyr -1 Mstars≥10 11 MO • 1:3 1:4 1:5 Lopez-Sanjuan+12 Bundy+0.9 Bluck+09 Bluck+12 Robotham+14
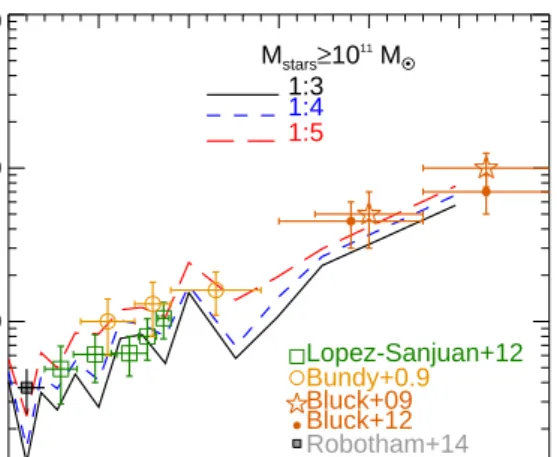
Figure 3. Merger rate in galaxies withMstars>1011M⊙inEAGLEas a function of redshift. We show merger ratios>1 : 3(solid line),>1 : 4 (short-dashed line) and>1 : 5(long-dashed line). We also show the observational measurements ofBundy et al.(2009),Bluck et al.(2009),L ´opez-Sanjuan et al. (2012),Bluck et al.(2012) andRobotham et al.(2014). Most of these observational works assume major mergers are those with stellar mass ratios>1 : 4. EAGLEpredicts major merger rates of massive galaxies that are in excellent agreement with the observations in the entire redshift range where measurements are available.
while co-rotation is expected if the primary galaxy is a spiral, star-forming galaxy. The frequencies we report in the bottom panels of Fig.2 are consistent with this picture.
Fig.3compares the major merger rate ofEAGLEgalaxies withMstars > 1011M⊙ at different redshifts against a compilation of observations. Here we employ3different stellar mass ratios to define major mergers:>1 : 5,>1 : 4and>1 : 3, to show the systematic variations produced by this definition. The observations shown in Fig.3correspond to measurements coming from the characterisation of pair frequency (Bundy et al. 2009;Bluck et al. 2009;L´opez-Sanjuan et al. 2012;Robotham et al. 2014), and from the identification of galaxies with disturbed morphologies (Bluck et al. 2012). Both set of measurements agree remarkably well. We find that the major merger rate of massive galaxies is in excellent agreement with the observations. For our purpose this means that the effect of galaxy mergers on the AM of galaxies is not going to be over(under)-represented.
3 THE EFFECT OF MERGERS ON THE STELLAR SPECIFIC AM OF GALAXIES THROUGHOUT COSMIC TIME
In§3.1, we present an analysis of the accumulated effect of mergers by studying the galaxy population atz = 0. In§3.2we analyse the effect of mergers by comparing measurements of galaxy properties before and after the mergers, and how these depend on the nature of the merger. In§3.3we analyse the radial rearrangement ofjstarsas a result of mergers.
3.1 The net effect of galaxy mergers seen atz= 0
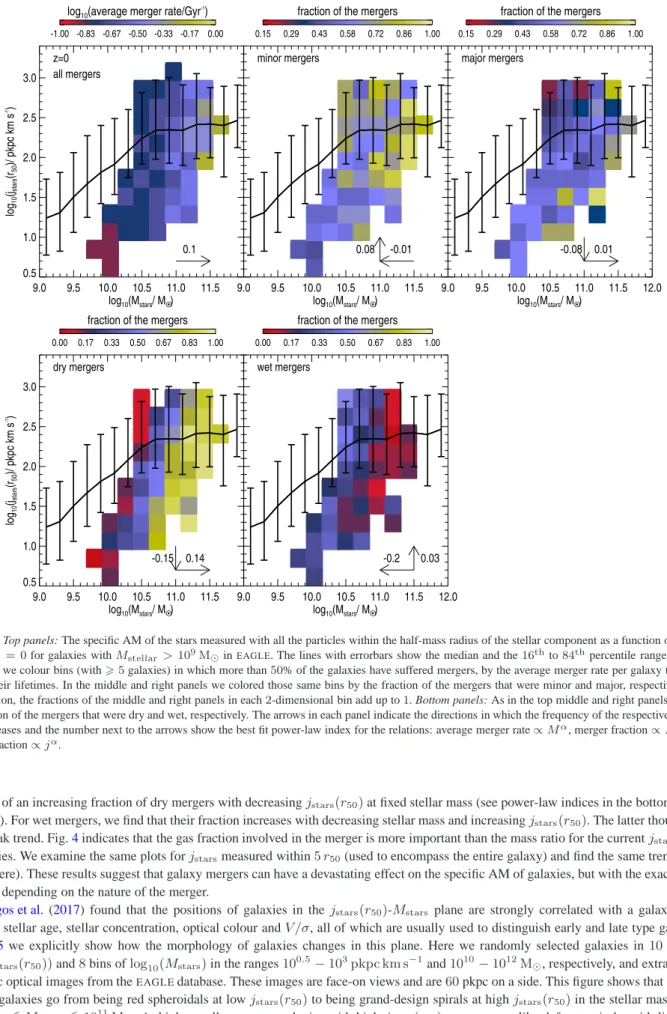
The top-left panel of Fig.4shows how the galaxy merger rate changes with the position of galaxies in thejstars(r50)-Mstarsplane. We define the average merger rate of individual galaxies as the number of mergers divided by the stellar-mass weighted age. Here we do not distinguish recent from past mergers, but just count their occurrence. We colour only those bins in which at least50% of the galaxies have undergone mergers during their lifetimes. This is why belowMstars≈1010M⊙there are very few coloured bins.At1010M⊙.Mstars.1010.5M⊙ mostly galaxies with low spins have a significant contribution from mergers. These galaxies are hosted by halos that are on average20% more massive than those of galaxies of the same stellar mass but that never had mergers. AtMstars&1010.5M⊙the vast majority of galaxies had at least one merger byz = 0. The merger rate increases with increasing mass (best power-law fit is∝M0.1
stars), and no clear correlation is seen withjstars(r50)at fixed stellar mass.
In the top middle and right panels of Fig.4we calculate the fraction of the mergers shown in the left panel that were minor and major, respectively. We also performed power-law best fits to the relationship between the merger fraction andMstarsandjstars(r50)to quantify the trends. The best fit power-law indices are shown in each panel of Fig.4.
The fraction of major and minor mergers weakly increase and decrease, respectively, with increasing stellar mass (see power-law indices in Fig.4). We also see a slightly stronger trend withjstars(r50): at fixed stellar mass, the frequency of major and minor mergers decrease and increase, respectively with increasingjstars(r50). The directions in which the frequency of mergers increase are shown as arrows in Fig.4.
In the bottom panels of Fig.4we split the mergers into dry and wet, following the definition of Fig.1. We find stronger trends with both
9.0 9.5 10.0 10.5 11.0 11.5 log10(Mstars/ MO •) 0.5 1.0 1.5 2.0 2.5 3.0 log 10 (jstars (r50 )/ pkpc km s -1 ) z=0 all mergers 0.1
log10(average merger rate/Gyr
-1 ) -1.00 -0.83 -0.67 -0.50 -0.33 -0.17 0.00 9.0 9.5 10.0 10.5 11.0 11.5 log10(Mstars/ MO •) minor mergers 0.08 -0.01
fraction of the mergers
0.15 0.29 0.43 0.58 0.72 0.86 1.00
9.0 9.5 10.0 10.5 11.0 11.5 12.0
log10(Mstars/ MO •)
major mergers
-0.08 0.01
fraction of the mergers
0.15 0.29 0.43 0.58 0.72 0.86 1.00 9.0 9.5 10.0 10.5 11.0 11.5 log10(Mstars/ MO •) 0.5 1.0 1.5 2.0 2.5 3.0 log 10 (jstars (r50 )/ pkpc km s -1 ) dry mergers 0.14 -0.15
fraction of the mergers
0.00 0.17 0.33 0.50 0.67 0.83 1.00
9.0 9.5 10.0 10.5 11.0 11.5 12.0
log10(Mstars/ MO •)
wet mergers
-0.2 0.03
fraction of the mergers
0.00 0.17 0.33 0.50 0.67 0.83 1.00
Figure 4. Top panels: The specific AM of the stars measured with all the particles within the half-mass radius of the stellar component as a function of stellar
mass atz= 0for galaxies withMstellar>109M⊙inEAGLE. The lines with errorbars show the median and the16thto84thpercentile ranges. In the left panel we colour bins (with>5galaxies) in which more than50% of the galaxies have suffered mergers, by the average merger rate per galaxy they had during their lifetimes. In the middle and right panels we colored those same bins by the fraction of the mergers that were minor and major, respectively. By construction, the fractions of the middle and right panels in each2-dimensional bin add up to1. Bottom panels: As in the top middle and right panels, but for the fraction of the mergers that were dry and wet, respectively. The arrows in each panel indicate the directions in which the frequency of the respective merger type increases and the number next to the arrows show the best fit power-law index for the relations: average merger rate∝Mα, merger fraction∝Mαand merger fraction∝jα.
gradient of an increasing fraction of dry mergers with decreasingjstars(r50)at fixed stellar mass (see power-law indices in the bottom panel of Fig.4). For wet mergers, we find that their fraction increases with decreasing stellar mass and increasingjstars(r50). The latter though is a very weak trend. Fig.4indicates that the gas fraction involved in the merger is more important than the mass ratio for the currentjstars(r50) of galaxies. We examine the same plots forjstarsmeasured within5r50(used to encompass the entire galaxy) and find the same trends (not shown here). These results suggest that galaxy mergers can have a devastating effect on the specific AM of galaxies, but with the exact effect strongly depending on the nature of the merger.
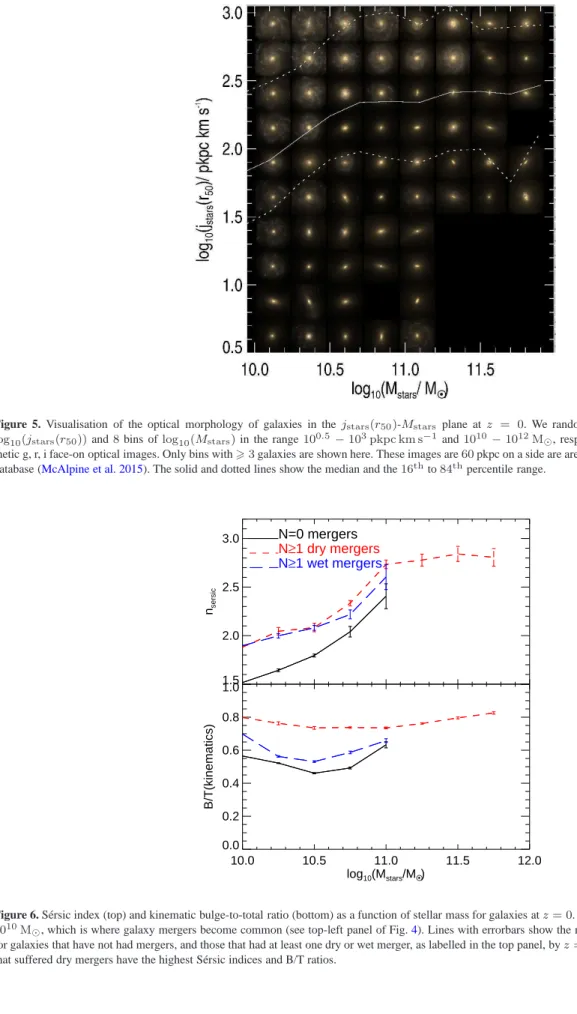
Lagos et al. (2017) found that the positions of galaxies in thejstars(r50)-Mstars plane are strongly correlated with a galaxy’s gas fraction, stellar age, stellar concentration, optical colour andV /σ, all of which are usually used to distinguish early and late type galaxies. In Fig.5we explicitly show how the morphology of galaxies changes in this plane. Here we randomly selected galaxies in10bins of
log10(jstars(r50))and8bins oflog10(Mstars)in the ranges100.5−103pkpc km s−1and1010−1012M⊙, respectively, and extract their synthetic optical images from theEAGLEdatabase. These images are face-on views and are60pkpc on a side. This figure shows that at fixed
Mstars, galaxies go from being red spheroidals at lowjstars(r50)to being grand-design spirals at highjstars(r50)in the stellar mass range
1010M
Figure 5. Visualisation of the optical morphology of galaxies in thejstars(r50)-Mstars plane at z = 0. We randomly select galaxies in10bins of log10(jstars(r50))and8bins oflog10(Mstars)in the range100.5−103pkpc km s−1and1010−1012M⊙, respectively, and show here their syn-thetic g, r, i face-on optical images. Only bins with>3galaxies are shown here. These images are60pkpc on a side are are publicly available from theEAGLE database (McAlpine et al. 2015). The solid and dotted lines show the median and the16thto84thpercentile range.
1.5 2.0 2.5 3.0 nsersic N=0 mergers N≥1 dry mergers N≥1 wet mergers 10.0 10.5 11.0 11.5 12.0
log10(Mstars/MO •)
0.0 0.2 0.4 0.6 0.8 1.0 B/T(kinematics)
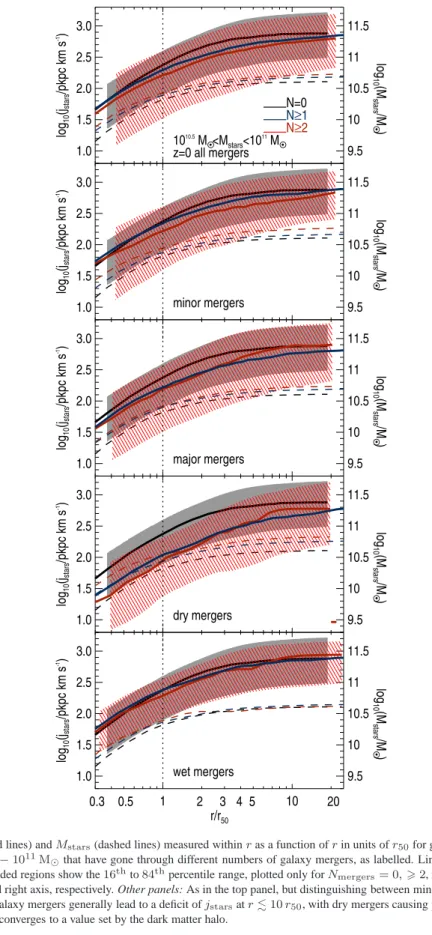
Figure 6. S´ersic index (top) and kinematic bulge-to-total ratio (bottom) as a function of stellar mass for galaxies atz= 0. We show galaxies withMstellar> 1010M⊙, which is where galaxy mergers become common (see top-left panel of Fig.4). Lines with errorbars show the median and1σerror on the median for galaxies that have not had mergers, and those that had at least one dry or wet merger, as labelled in the top panel, byz= 0. This figure shows that galaxies that suffered dry mergers have the highest S´ersic indices and B/T ratios.
1.0 1.5 2.0 2.5 3.0 log 10 (jstars /pkpc km s -1 ) 11.5 11 10.5 10 9.5 log 10 (M stars /M O • ) 1010.5 M O •<Mstars<10 11 M O • z=0 all mergers N=0 N≥1 N≥2 1.0 1.5 2.0 2.5 3.0 log 10 (jstars /pkpc km s -1 ) 11.5 11 10.5 10 9.5 log 10 (M stars /M O • ) minor mergers r/r50 1.0 1.5 2.0 2.5 3.0 log 10 (jstars /pkpc km s -1 ) 11.5 11 10.5 10 9.5 log 10 (M stars /M O • ) major mergers 1.0 1.5 2.0 2.5 3.0 log 10 (jstars /pkpc km s -1 ) 11.5 11 10.5 10 9.5 log 10 (M stars /M O • ) dry mergers 1 10 r/r50 1.0 1.5 2.0 2.5 3.0 log 10 (jstars /pkpc km s -1 ) 11.5 11 10.5 10 9.5 log 10 (M stars /M O • ) wet mergers 0.3 0.5 2 3 4 5 20
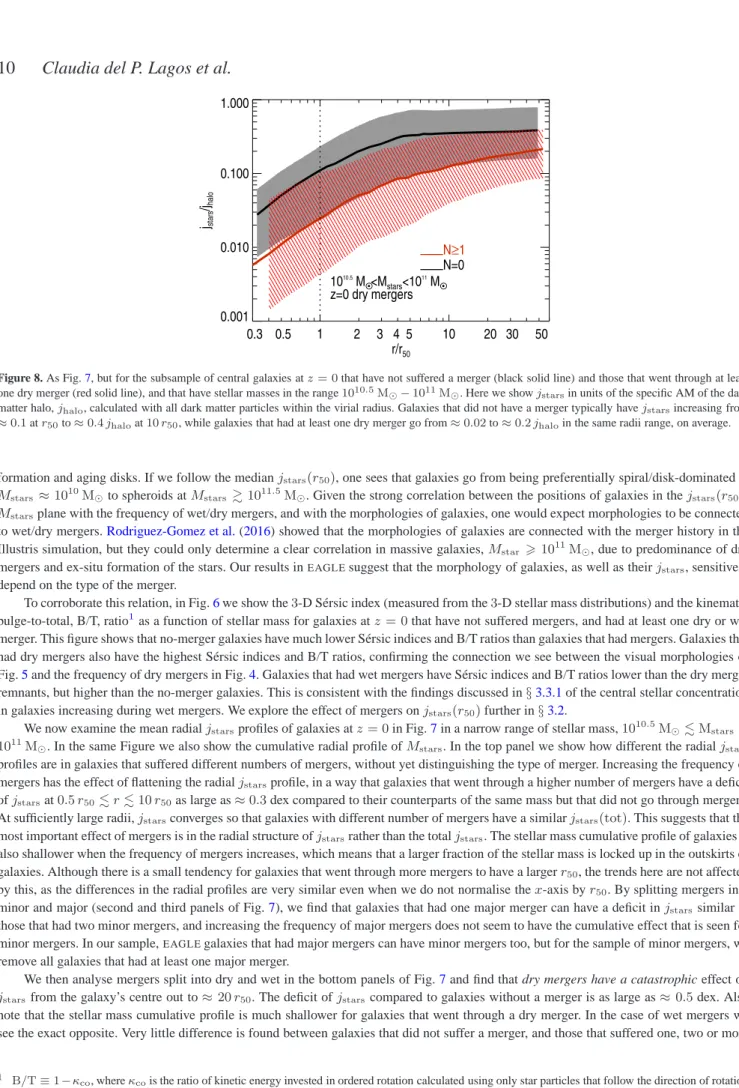
Figure 7. Top panel:jstars(solid lines) andMstars(dashed lines) measured withinras a function ofrin units ofr50for galaxies atz= 0with total stellar masses in the range1010.5M
⊙−1011M⊙that have gone through different numbers of galaxy mergers, as labelled. Lines show the median of thejstars profiles of galaxies, while the shaded regions show the16thto84thpercentile range, plotted only forN
mergers= 0,>2, for clarity. The scale ofjstarsand Mstarsare marked in the left and right axis, respectively. Other panels: As in the top panel, but distinguishing between minor, major, dry and wet mergers, as labelled. This figure shows that galaxy mergers generally lead to a deficit ofjstarsatr.10r50, with dry mergers causing pronounced deficits of≈0.5dex. At sufficiently large radii,jstarsconverges to a value set by the dark matter halo.
1 10 r/r50 0.001 0.010 0.100 1.000 jstars /jhalo 0.3 0.5 2 3 4 5 20 30 50 1010.5 M O •<Mstars<10 11 M O • z=0 dry mergers N=0 N≥1
Figure 8. As Fig.7, but for the subsample of central galaxies atz= 0that have not suffered a merger (black solid line) and those that went through at least one dry merger (red solid line), and that have stellar masses in the range1010.5M
⊙−1011M⊙. Here we showjstarsin units of the specific AM of the dark matter halo,jhalo, calculated with all dark matter particles within the virial radius. Galaxies that did not have a merger typically havejstarsincreasing from ≈0.1atr50to≈0.4jhaloat10r50, while galaxies that had at least one dry merger go from≈0.02to≈0.2jhaloin the same radii range, on average.
formation and aging disks. If we follow the medianjstars(r50), one sees that galaxies go from being preferentially spiral/disk-dominated at Mstars≈1010M⊙to spheroids atMstars &1011.5M⊙. Given the strong correlation between the positions of galaxies in thejstars(r50) -Mstarsplane with the frequency of wet/dry mergers, and with the morphologies of galaxies, one would expect morphologies to be connected to wet/dry mergers.Rodriguez-Gomez et al.(2016) showed that the morphologies of galaxies are connected with the merger history in the Illustris simulation, but they could only determine a clear correlation in massive galaxies,Mstar > 1011M⊙, due to predominance of dry mergers and ex-situ formation of the stars. Our results inEAGLEsuggest that the morphology of galaxies, as well as theirjstars, sensitively depend on the type of the merger.
To corroborate this relation, in Fig.6we show the3-D S´ersic index (measured from the3-D stellar mass distributions) and the kinematic bulge-to-total, B/T, ratio1as a function of stellar mass for galaxies atz= 0that have not suffered mergers, and had at least one dry or wet merger. This figure shows that no-merger galaxies have much lower S´ersic indices and B/T ratios than galaxies that had mergers. Galaxies that had dry mergers also have the highest S´ersic indices and B/T ratios, confirming the connection we see between the visual morphologies of Fig.5and the frequency of dry mergers in Fig.4. Galaxies that had wet mergers have S´ersic indices and B/T ratios lower than the dry merger remnants, but higher than the no-merger galaxies. This is consistent with the findings discussed in§3.3.1of the central stellar concentration in galaxies increasing during wet mergers. We explore the effect of mergers onjstars(r50)further in§3.2.
We now examine the mean radialjstarsprofiles of galaxies atz= 0in Fig.7in a narrow range of stellar mass,1010.5M⊙.Mstars.
1011M
⊙. In the same Figure we also show the cumulative radial profile ofMstars. In the top panel we show how different the radialjstars profiles are in galaxies that suffered different numbers of mergers, without yet distinguishing the type of merger. Increasing the frequency of mergers has the effect of flattening the radialjstarsprofile, in a way that galaxies that went through a higher number of mergers have a deficit ofjstarsat0.5r50.r.10r50as large as≈0.3dex compared to their counterparts of the same mass but that did not go through mergers. At sufficiently large radii,jstarsconverges so that galaxies with different number of mergers have a similarjstars(tot). This suggests that the most important effect of mergers is in the radial structure ofjstarsrather than the totaljstars. The stellar mass cumulative profile of galaxies is also shallower when the frequency of mergers increases, which means that a larger fraction of the stellar mass is locked up in the outskirts of galaxies. Although there is a small tendency for galaxies that went through more mergers to have a largerr50, the trends here are not affected by this, as the differences in the radial profiles are very similar even when we do not normalise thex-axis byr50. By splitting mergers into minor and major (second and third panels of Fig.7), we find that galaxies that had one major merger can have a deficit injstarssimilar to those that had two minor mergers, and increasing the frequency of major mergers does not seem to have the cumulative effect that is seen for minor mergers. In our sample,EAGLEgalaxies that had major mergers can have minor mergers too, but for the sample of minor mergers, we remove all galaxies that had at least one major merger.
We then analyse mergers split into dry and wet in the bottom panels of Fig.7and find that dry mergers have a catastrophic effect on
jstarsfrom the galaxy’s centre out to≈20r50. The deficit ofjstarscompared to galaxies without a merger is as large as≈0.5dex. Also note that the stellar mass cumulative profile is much shallower for galaxies that went through a dry merger. In the case of wet mergers we see the exact opposite. Very little difference is found between galaxies that did not suffer a merger, and those that suffered one, two or more
1 B/T≡1−κco, whereκ
cois the ratio of kinetic energy invested in ordered rotation calculated using only star particles that follow the direction of rotation of the galaxy (seeCorrea et al. 2017for more details). We also analysed theAbadi et al.(2003) andSales et al.(2010) definitions of kinetic B/T and found the same trends as in the bottom panel of Fig.6.
1.0 1.5 2.0 2.5 3.0 3.5
Romanowsky & Fall (2012) 2.6<log10(jstars(r50)/pkpc km s-1 )<2.8 1010.5 MO •<Mstars<1011.5 MO • 1.0 1.5 2.0 2.5 3.0 3.5 log 10 (jstars /pkpc km s -1 ) 2.3<log10(jstars(r50)/pkpc km s-1)<2.6 1 10 r/r50 1.0 1.5 2.0 2.5 3.0 3.5 0.3 0.5 2 3 4 5 20 30 50 2<log10(jstars(r50)/pkpc km s-1 )<2.3
Figure 9. Mean radialjstarsprofiles for galaxies inEAGLEatz= 0and with stellar masses in the range1010.5M
⊙−1011.5M⊙in3bins ofjstars(r50), as labelled in each panel. In dotted lines we show all galaxies in that range, while the thick and thin solid lines show the median, and the16thand84th percentile ranges, respectively. We show observations of early-type galaxies fromRomanowsky & Fall(2012) as dashed lines. Their sampled galaxies have stellar masses in the range we selected here, and we show each galaxy in their corresponding bin ofjstars(r50). Here we only show the median measurement, but errorbars around those measurements can be as large as≈0.5dex, particularly atr&3r50.
wet mergers. This reinforces the conclusion that tojstarsof a galaxy, what matters most is whether the merger is dry or wet. We will show in Fig.11that this is also true when we studyjstarsbefore and after the merger. Note that in the case of dry mergers, we still see that the mean radialjstarsprofile converges at sufficiently large radii to ajstars(tot)that does not strongly depend on the merging history of galaxies.
3.1.1 The galaxy/halo specific AM connection
We comparejstarsof the galaxies with the specific AM of their dark matter halos in the top panel of Fig.8. We find that galaxies that went through at least one dry merger on average have ajstars(tot)that is5times smaller than that of their halo, while galaxies that did not go through a merger typically retain≈40−50% of their haloj. This latter result agrees very well with the prediction byStevens et al.(2016a) for spiral galaxies. With a semi-analytic model, those authors evolved the one-dimensional structure of disks in a series of annuli of fixed
j. They assumed that when gas cooled or accreted onto a galaxy, it carried the same totaljof the halo at that time in both magnitude and direction, and that is was distributed exponentially. Stars were formed in annuli that were Toomre unstable or had sufficient H2. Atz = 0, they found spiral galaxies (which had not suffered dry mergers) hadjstars/jhalo= 0.4±0.29, independent of galaxy mass (see their Fig. 13). Despite the completely different methodology, this aligns almost perfectly with the result ofEAGLEgalaxies that have not participated in a dry merger.
Fall(1983) suggested that spiral galaxies need to have ajstarsclose to that of their halo (within≈80% according toFall & Romanowsky 2013), while ellipticals had to lose90% of theirj, postulating a fundamental difference between the two galaxy populations. The conclusions reached by these authors were biased by the available observations, that in the best case went out to≈10r50. According toEAGLE, early-type galaxies only reach≈0.1of the expected halojatr≈10r50, on average.EAGLEshows thatjstarscontinues to rise out to much larger radii due to the effect of adding halo stars.EAGLEpredicts that this difference shrinks at larger radii, although still not converging to a fraction of
jhaloas high as galaxies with no mergers in their lifetime. Early simulations of mergers predicted that dynamical friction could redistribute AM from the inner to the outer regions (e.g.Barnes & Efstathiou 1987;Navarro & White 1994;Heyl et al. 1996). From those simulations one would expect a net weak conservation ofj. Our findings withEAGLEshow a significant disparity between the stellar and the haloj, but that is not as large as suggested by some of the idealised models (Romanowsky & Fall 2012).
3.1.2 Comparison with observations of early-type galaxies
We compare EAGLEgalaxies of low jstars with the observations of Romanowsky & Fall(2012) in Fig.9. Romanowsky & Fall(2012) presented mean radialjstarsprofiles for7ellipticals and S0 galaxies in the stellar mass range of1010.5M⊙ . Mstars .1011.5M⊙. We took these7galaxies and separated them into3bins oflog10(jstars(r50)/pkpc km s−1),2−2.3,2.4−2.6and2.6−2.8, which inEAGLE
1.0 1.5 2.0 2.5 3.0 3.5 ATLAS3D 2.6<log10(jstars(r50)/pkpc km s-1 )<2.8 1010.5 MO •<Mstars<1011.5 MO • 1.0 1.5 2.0 2.5 3.0 3.5 log 10 (jstars /pkpc km s -1 ) ATLAS3D 2.3<log10(jstars(r50)/pkpc km s-1)<2.6 1 r/r50 1.0 1.5 2.0 2.5 3.0 3.5 0.3 0.4 0.5 2 3 4 5 ATLAS3D 2<log10(jstars(r50)/pkpc km s-1 )<2.3
Figure 10. Mean radialjstarsprofile for the sameEAGLEgalaxies of Fig.9. For the simulated galaxies, we show the median and the16thand84thpercentile ranges. Individual dotted lines show ATLAS3Dgalaxies that have stellar masses in the range1010.5M
⊙−1011.5M⊙and havejstars(r50)in the ranges shown in each panel. The agreement betweenEAGLEand the observations is excellent.
would correspond to galaxies below, close to and above the medianjstars(r50)at that stellar mass, and compare them withEAGLEin Fig.9. InEAGLEmost galaxies of such stellar mass are expected to be early-type (see Figs.5and6). We find that at lowjstars(bottom panel of Fig.9) the scatter in the mean radial profiles becomes increasingly larger compared to galaxies of higherjstars, and galaxies with flat mean jstarsprofiles become more common. The diversity of mean radialjstarsprofiles observed byRomanowsky & Fall(2012) is well captured byEAGLE, even in the cases wherejstarsceases to increase atr&3r50.
With the aim of testingEAGLEwith a larger number of galaxies, we extracted mean radialjstarsprofiles for every ATLAS3Dgalaxy (Cappellari et al. 2011), following the procedure described inLagos et al.(2017). These profiles sample up to≈2r50in the best cases, but they inform us of the shape of the radialjstarsprofile in the inner regions of galaxies. Fig.10shows the comparison betweenEAGLEand ATLAS3Din the same stellar mass andjstars(r50)ranges of Fig.9. From top to bottom, each panel shows8,10and15ATLAS3Dgalaxies, respectively. The agreement with the observations is excellent. ATLAS3Dgalaxies show a larger scatter in the radialjstarsprofiles with decreasing galaxy’s spins, which is very similar to the trend seen inEAGLE. This gives us confidence that the simulation not only reproduces the averagej-mass relation, as shown byLagos et al.(2017), but also the radial profiles of galaxies, where observations exists. The number of galaxies in the Universe in which this comparison can be done is still very sparse, but the advent of IFU instruments (e.g. SAMI, MaNGA, MUSE) is likely to change this.
3.2 jstarsbefore and after galaxy mergers
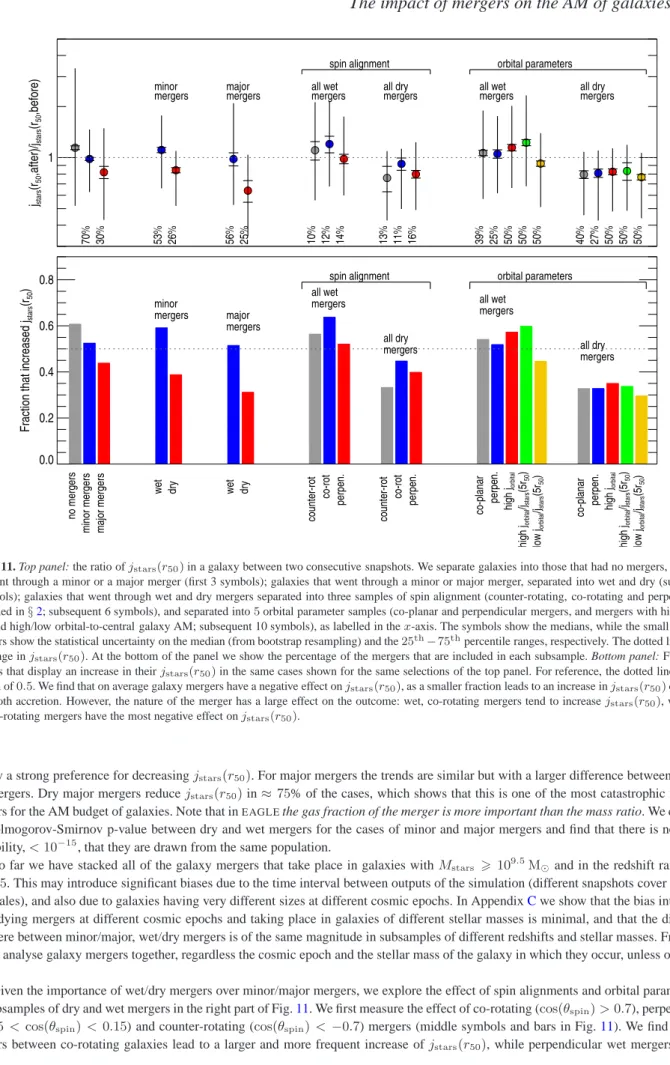
We analyse how muchjstars(r50) changes between two consecutive snapshots for galaxies withMstars > 109.5M⊙and in the redshift range06z62.5, separating galaxies into those that had and did not have a merger, and splitting mergers into different types: minor/major, wet/dry and with different spin alignments and orbital parameters. This is shown in the top panel of Fig.11(the equivalent forjstars(5r50) is shown in Fig.C1). The bottom panel of Fig.11shows the fraction of galaxies displaying an increase injstars(r50)for the same cases analysed in the top panel. The first3data points compare the change injstars(r50)due to smooth accretion and a minor or major merger. In the latter case, star formation and gas accretion may continue, and thus, we cannot fully separate this effect from the merger. Galaxies that did not suffer mergers on average increase theirjstars(r50)by≈15% in between snapshots, and are likely to undergo an important increase injstars(r50)(i.e.≈35% of the galaxies at least double theirjstars(r50)in a snapshot). On the contrary, galaxy mergers are more likely to not change or reduce theirjstars(r50), depending on whether they are minor or major mergers, respectively. From the bottom panel of Fig.11, one sees that smooth accretion increasesjstars(r50)≈60% of the time, while minor and major mergers only do this in≈54% and ≈43% of the cases, respectively.
Fig.11also splits mergers into several subsamples to pin down the circumstances in whichjstarschange the most. We first take all of the minor and major mergers and split them into dry and wet (shown from the4th to the7th symbols and bars in Fig.11). We find that wet minor mergers produce a similar increase ofjstars(r50)to smooth accretion, with a smaller percentage of galaxies going through a major increase injstars(r50)(≈20% of wet minor mergers produce an increase of a factor of&2). Dry minor mergers, on the other hand,
1 jstars (r50 ,after)/j stars (r50 ,before) 70% 30% wet minor mergers 53% 26% wet major mergers 56% 25% 10% 12% spin alignment all wet mergers perpen. 14% 13% 11% all dry mergers perpen. 16% co-planar 39% perpen. 25% orbital 50% 50% 50% orbital parameters all wet mergers co-planar 40% perpen. all dry mergers 27% orbital 50% 50% 50% 0.0 0.2 0.4 0.6 0.8
Fraction that increased j
stars
(r50
)
no mergers
minor mergers major mergers
wet minor mergers dry wet major mergers dry counter-rot co-rot spin alignment all wet mergers perpen. counter-rot co-rot all dry mergers perpen. co-planar perpen. high j orbital high j orbital /jstars (5r 50 ) low j orbital /jstars (5r 50 ) orbital parameters all wet mergers co-planar perpen. all dry mergers high j orbital high j orbital /jstars (5r 50 ) low j orbital /jstars (5r 50 )
Figure 11. Top panel: the ratio ofjstars(r50)in a galaxy between two consecutive snapshots. We separate galaxies into those that had no mergers, and those that went through a minor or a major merger (first 3 symbols); galaxies that went through a minor or major merger, separated into wet and dry (subsequent 4 symbols); galaxies that went through wet and dry mergers separated into three samples of spin alignment (counter-rotating, co-rotating and perpendicular, as defined in§2; subsequent 6 symbols), and separated into5orbital parameter samples (co-planar and perpendicular mergers, and mergers with high orbital AM, and high/low orbital-to-central galaxy AM; subsequent 10 symbols), as labelled in thex-axis. The symbols show the medians, while the small and large errorbars show the statistical uncertainty on the median (from bootstrap resampling) and the25th−75thpercentile ranges, respectively. The dotted line shows no change injstars(r50). At the bottom of the panel we show the percentage of the mergers that are included in each subsample. Bottom panel: Fraction of galaxies that display an increase in theirjstars(r50)in the same cases shown for the same selections of the top panel. For reference, the dotted line shows a fraction of0.5. We find that on average galaxy mergers have a negative effect onjstars(r50), as a smaller fraction leads to an increase injstars(r50)compared to smooth accretion. However, the nature of the merger has a large effect on the outcome: wet, co-rotating mergers tend to increasejstars(r50), while dry, counter-rotating mergers have the most negative effect onjstars(r50).
display a strong preference for decreasingjstars(r50). For major mergers the trends are similar but with a larger difference between dry and wet mergers. Dry major mergers reducejstars(r50)in≈75% of the cases, which shows that this is one of the most catastrophic forms of mergers for the AM budget of galaxies. Note that inEAGLEthe gas fraction of the merger is more important than the mass ratio. We calculate
the Kolmogorov-Smirnov p-value between dry and wet mergers for the cases of minor and major mergers and find that there is negligible probability,<10−15
, that they are drawn from the same population.
So far we have stacked all of the galaxy mergers that take place in galaxies withMstars > 109.5M⊙and in the redshift range0 6 z62.5. This may introduce significant biases due to the time interval between outputs of the simulation (different snapshots cover different timescales), and also due to galaxies having very different sizes at different cosmic epochs. In AppendixCwe show that the bias introduced by studying mergers at different cosmic epochs and taking place in galaxies of different stellar masses is minimal, and that the difference seen here between minor/major, wet/dry mergers is of the same magnitude in subsamples of different redshifts and stellar masses. From here on, we analyse galaxy mergers together, regardless the cosmic epoch and the stellar mass of the galaxy in which they occur, unless otherwise stated.
Given the importance of wet/dry mergers over minor/major mergers, we explore the effect of spin alignments and orbital parameters in the subsamples of dry and wet mergers in the right part of Fig.11. We first measure the effect of co-rotating (cos(θspin)>0.7), perpendicular (−0.15<cos(θspin) <0.15) and counter-rotating (cos(θspin) <−0.7) mergers (middle symbols and bars in Fig.11). We find that wet mergers between co-rotating galaxies lead to a larger and more frequent increase ofjstars(r50), while perpendicular wet mergers tend to
produce little changes injstars(r50).64% of the co-rotating wet minor mergers increasejstars(r50), a frequency that is even higher than smooth accretion. The effect of counter-rotating mergers is in between the co-rotating and perpendicular mergers. Perpendicular mergers are the most common configuration inEAGLE(see Fig.2) and that is why the bars for wet minor and major mergers are skewed towards the results of perpendicular rather than co-rotating mergers. For dry mergers we find the same trend: co-rotating mergers tend to be less damaging than perpendicular or counter-rotating mergers forjstars(r50).
In the rightmost part of Fig.11we analyse the effect of the orbital parameters. Particularly, we analyse co-planar and perpendicular mergers, the subsample with highjorbital(i.e. higher than the median), and with high and lowjorbital/jstars(5r50)(above and below the median, respectively).§2.1presents the definition ofjorbital, and here we comparejorbitaltojstars(5r50)of the primary galaxy prior to the merger.jstars(5r50)is a good measurement of the galaxy’s totaljstars(see Fig.7). We do not find a strong effect of the orientation of the mergers onjstars(5r50), as both the distributions of the co-planar and perpendicular mergers are statistically indistinguishable (the KS p-value is0.56). When comparing mergers of high and lowjorbital, however, we find a significant difference (with a KSp-value of10−5) in which mergers with highjorbitalpreferentially result in an increase injstars(5r50)of≈15%. The largest systematic is found when we separate wet mergers by theirjorbital/jstars(5r50)(thep-value comparing the two subsamples of high/lowjorbital/jstars(5r50)is10−24). High values ofjorbital/jstars(5r50)efficiently spin-up the galaxy, increasingjstars(r50)by≈22%, on average, and in60% of the cases. This suggests that galaxies spin-up because part of the orbital AM is transferred to the remnant galaxy. We study the subsample of wet, co-rotating (cos(θspin) > 0.7) and highjorbital/jstars(5r50)mergers, and find that they increasejstars(r50)in≈ 70% of the cases, by ≈44% on average, and thus this form of merger is the most efficient at spinning-up galaxies. In the case of dry mergers we do not find a strong dependence on any of the orbital parameters studied here.
When studying jstars(5r50) (Fig.C2) we find very similar results. The only major difference is that dry mergers show a stronger dependence on the orbital parameters, with highjorbital/jstars(5r50)and co-planar mergers leading to a higher fraction of galaxies displaying and increase injstars(5r50). Thus, we conclude that the AM in the inner parts of galaxies during dry mergers is not greatly affected by the orbital parameters of the mergers, but when focusing on the totaljstars, we see that perpendicular and lowjorbital/jstars(5r50)mergers, are the most catastrophic.
We conclude that inEAGLEwet, co-rotating mergers can spin-up galaxies very efficiently, and even more if they have a highjorbital/jstars(5r50). On the contrary, dry, counter-rotating mergers are the most effective at spinning down galaxies. The environment in which these mergers take place may have a significant impact. We find that wet mergers generally happen in halos of higher spins compared to the median of all halos. This could be interpreted as accretion spinning up halos, as well as making the galaxies gas-rich and resulting in a high spin merger remnant. The consequences of such correlation are very interesting but beyond the scope of this paper, so we defer it to future investigation.
3.3 Rearrangement ofjstarsduring galaxy mergers
In Fig.12we study the mean radialjstarsprofile of the primary galaxy before and after the merger in two bins of stellar mass and for minor/major mergers that are wet/dry. Before the merger here means the last snapshot in which the galaxy participating in the merger was individually identified, and for ‘after’ the merger we look at the two consecutive snapshots in which the galaxies has been identified as one (i.e. already merged in the merger tree). Given the time period in between snapshots, the two consecutive snapshots roughly correspond to≈0.5Gyr and≈ 1Gyr, respectively, after the merger. We study two snapshots after the merger because visual inspection of mergers inEAGLEreveals that in some cases the merger tree algorithm considers a galaxy pair as already merged even though the process is still ongoing. Another motivation to study two consecutive snapshots after the merger is to test the effect of relaxation if any is present.
In the low stellar mass bin of Fig.12, we show that both dry minor and major mergers have the effect of reducingjstarsacross the entire radii range considered. Studyingjstarsat≈0.5or≈1Gyr after the merger makes little difference in this case. Major dry mergers tend to reducejstarsby≈0.2dex on average in both low and high stellar mass bins, while minor dry mergers drive a more modest reduction of ≈0.1dex, on average. In the case of wet mergers we see a differential effect on thejstarsprofiles: inner regions of galaxies,r . 5kpc (typically≈2r50; see filled and open circles in Fig.12), tend to increasejstars, while at larger radii,jstarstends to decrease if one looks at the merger remnant≈0.5Gyr after the merger, or very modestly increase if studied≈1Gyr after. The latter could be due to a combination of relaxation and continuing gas accretion and star formation. Separating the latter is not obvious in a simulation likeEAGLEwhere all the physical processes are interplaying at any given time.
3.3.1 The physical origin of thejstarsincrease in wet mergers
To further understand the differential effect wet mergers have on the mean radialjstarsprofile, we study in Fig.13the change in the stellar surface density of the primary galaxy before and after the merger. For clarity, we only plot the mass bin1010M
⊙ <Mstars<1010.5M⊙ as the lower mass bin gives very similar results. Fig.13shows that wet major and minor mergers drive a significant increase in the central stellar surface density by a factor& 0.2dex, on average. At intermediate radii,5 pkpc. r .30 pkpcthere is also an increase, but of a less significant magnitude. If the central stellar mass (i.e. bulge) is increasing, and the rotational velocity increases asv≈p
GM/r,jstars is also expected to increase. This effect has been seen before in non-cosmological simulations of gas-rich mergers (Springel 2000;Cox et al. 2006;Robertson et al. 2006;Johansson et al. 2009;Peirani et al. 2010;Moreno et al. 2015).
-0.8 -0.6 -0.4 -0.2 0.0 0.2 0.4 log 10 (jstars (after)/j stars (before)) minor mergers 109.5<M
stars/MO •<1010 major mergers 109.5<Mstars/MO •<1010
0 10 20 30 40 50 r/pkpc -0.8 -0.6 -0.4 -0.2 0.0 0.2 0.4 log 10 (jstars (after)/j stars (before)) minor mergers 1010<M stars/MO •<1010.5 dry (~0.5Gyr) wet (~0.5Gyr) dry (~1Gyr) wet (~1Gyr) 10 20 30 40 50 r/pkpc major mergers 1010<M stars/MO •<1010.5
Figure 12. The ratio between the mean radialjstarsprofiles after and before the galaxy merger, measured in an aperturer, as a function ofr. We measurejstars post-merger in the snapshot right after the merger, and two snapshots after, which correspond approximately to0.5and1Gyr after the merger, respectively. Minor and major mergers are shown in the left and right panels, respectively, in two bins of the neutral gas fraction of the merger, as labelled. The top panels show galaxies with109.5M
⊙<Mstars<1010M⊙, while the bottom panels show galaxies with1010M⊙<Mstars<1010.5M⊙. Lines and the shaded regions show the median and the25th-75thpercentile ranges. The latter are calculated using the snapshots right after the merger. The filled and empty circles with the error bar at the bottom of each panel show the medianr50before and after the merger, respectively, for each sample and the25th-75thpercentile range, respectively. Horizontal lines mark no change injstars(r), and so values above (below) correspond tojstarsincreasing (decreasing). The figure reveals that wet mergers tend to increasejstarsin the inner regions of galaxies, while decreasing it in the outer regions.
the centre, by dynamical friction moving stars of the primary galaxy to the centre, or the preferential formation of new stars in the centre. To answer this question we identified in the merger remnant the stars that belonged to the secondary (i.e. progenitor satellite stars) and primary (i.e. progenitor central stars) galaxy before the merger, and those that formed during the merger (i.e. new stars), and calculate their50% and
90% stellar mass radii. We do this for all mergers that took place in the redshift range≈0.2−0.8, which is of particular interest, as it is the time when the universe goes from being dominated by wet to dry mergers inEAGLE(see Fig.2). Fig.14shows the ratio ofr50andr90 between the progenitor satellite stars and the progenitor central stars, and between the new stars and the progenitor central stars in the case of wet minor mergers. For the new stars, we find that in≈73% of cases they end up more concentrated and withr50andr90typically≈1.3 times smaller than the progenitor central stars. For the progenitor satellite stars, we find that in≈70% of the cases they end up more extended and withr50andr90values that are≈1.8and≈1.3times larger than those of the progenitor central stars. The bottom panel of Fig.14 shows4examples of wet minor merger remnants and how the stars from the3components above are spatially distributed. We generally find that whenr50of the progenitor satellite stars is larger than that of the progenitor central stars there is an associated extended stellar structure in the form of streams or shells (e.g. galaxy ‘D’ in Fig.14). If we focus on the central2pkpc, we find that the bulge mass is dominated by the progenitor central stars (≈70% on average), but with a large contribution from the newly formed stars (≈30% on average). Although there is a significant contribution of newly formed stars, we find that the mass-weighted age of the bulge byz= 0is&9.5Gyr old, on average, due to the stars contributed by the primary and secondary galaxies that end up in the central2pkpc being extremely old.
We also studied the contribution of these stars to the meanjstarsradial profile of the merger remnant in the inner20pkpc in Fig.15. We find that the increase injstarsin the inner regions of galaxies as a result of the wet merger and reported in Fig.12is due to the newly formed stars. Although the progenitor satellite stars also have a highjstarscompared to the progenitor central stars, their contribution to the stellar mass is very small. In fact, in the inner2pkpc, newly formed stars are responsible for33% of thejstarsof the descendant, while progenitor central and satellite stars contribute58% and9%, respectively, on average. At larger radii,jstarsof the descendant is dominated by the stars of the progenitor central galaxy.
The main difference between wet minor and major mergers, in that in the latter (not shown here) the stars belonging to the progenitor secondary galaxy end up more concentrated than the progenitor central stars (typically≈1.5times more concentrated, on average).
We conclude that the increase ofjstarsin the inner regions of galaxies as a result of a wet merger is caused primarily by the flows of gas towards the centre that subsequently form stars. These new stars contribute to the formation of the bulge, and are typically characterised by higherjat fixed radius, thus, producing steeper velocity profiles.
-0.4 -0.2 0.0 0.2 0.4 0.6 0.8 log 10 ( Σstars (after)/ Σstars (before))
minor mergers and 1010
<Mstars/MO •<10 10.5 dry (~0.5Gyr) wet (~0.5Gyr) dry (~1Gyr) wet (~1Gyr) 0 10 20 30 40 50 r/pkpc -0.4 -0.2 0.0 0.2 0.4 0.6 0.8 log 10 ( Σstars (after)/ Σstars (before))
major mergers and 1010<M stars/MO •<10
10.5
Figure 13. Stellar mass surface density profile before and after the mergers for the galaxies in the bottom panel of Fig.12. This figure shows that gas-rich mergers tend to build the central stellar mass concentration (i.e. bulge), while dry mergers increase the stellar mass density towards the outskirts of galaxies. the latter case usually drives an increase inr50, while the former does not changer50significantly.
-0.5 0.0 0.5
log10(rsat/rcen) 0.00 0.05 0.10 0.15 0.20 0.25 0.30 0.35 normalized frequency
wet minor mergers
r50(new)/r50(prog,c) r90(new)/r90(prog,c) r50(prog,s)/r50(prog,c) r90(prog,s)/r90(prog,c) A A B CCB D D
Figure 14. Top panel: The ratio between the50% and90% stellar mass radii of the progenitor satellite (labelled as ‘prog,s’) and the newly formed stars vs. the progenitor central stellar (labelled as ‘prog,c’) components, as labelled, in all wet minor mergers in the redshift range≈0.2−0.8and that took place in primary galaxies withMstars>109.5M⊙inEAGLE. This figure shows that newly formed stars reside in the centre of the galaxy, and are more concentrated than the stars that were in primary galaxy before the merger. Bottom panel: stellar-particle distribution in4examples of wet major mergers that span the range of size ratios shown in the top panel. The images arex-yprojections of200ckpc on a side. Black, yellow and blue points show progenitor stars that belonged to the primary galaxy, progenitor stars that belonged to the secondary galaxy and stars that formed during the merger, respectively. The segments of the same colours at the bottom showr90of the three components.
0 5 10 15 20 r/pkpc -0.4 -0.2 0.0 0.2 0.4 0.6 log 10 (jstars,desc /jstars,prog )
wet minor mergers desc(all)/prog desc(prog,c)/prog
desc(prog,s)/prog desc(new)/prog
Figure 15. The ratio between the mean radialjstarsprofiles after and before the galaxy merger (solid line), measured in an aperturer, as a function ofr, for all wet minor mergers in the redshift range≈0.2−0.8and that took place in primary galaxies withMstars>109.5M⊙inEAGLE. We also show the ratio between the mean radialjstarsprofiles of the descendant and the progenitor but when we measure the former only with the progenitor central (dotted line), progenitor satellite (dot-dashed line) and newly formed stars (dashed line). Here lines show the medians. This figure shows that the increase injstarsin a wet merger is due to the contribution of newly formed stars.
-0.4 -0.2 0.0 0.2 log 10 (jstars (after)/j stars (before)) minor mergers 1010<M stars/MO •<10 10.5 dry co-rot wet co-rot
dry perp. or counter-rot wet perp. or counter-rot
dry high jorbital/jstars wet high jorbital/jstars dry low jorbital/jstars wet low jorbital/jstars
0 10 20 30 40 r/pkpc -0.4 -0.2 0.0 0.2 log 10 (jstars (after)/j stars (before)) major mergers 1010<M stars/MO •<10 10.5 0 10 20 30 40 r/pkpc
Figure 16. The ratio between the mean radialjstarsprofiles after and before the galaxy merger, measured in an aperturer, as a function ofrfor galaxies with stellar masses in the range1010M
⊙ < Mstars < 1010.5M⊙atz < 2. Mergers are split into minor (top panels) and major (bottom panels). In addition, every panel shows wet and dry mergers as red and blue lines split into co-rotating vs. perpendicular or counter-rotating mergers (left panels), high vs. lowjorbital/jstars(right panels), as labelled. Here we study consecutive snapshots, which in practice means that the profile after the merger is measured at≈0.3−0.5Gyr after the merger. Lines correspond to the medians of the distributions. For clarity we do not show here the percentile ranges, but they are of a similar magnitude to those shown in Fig.12.
3.3.2 The effect of spin and orbital alignments
In Fig.16we show the mean radialjstarsprofiles of galaxies before and after the merger. After the merger corresponds to the first snapshot in which the two merging galaxies are identified as one single remnant (typically0.5Gyr after the merger). In the left panels of Fig.16 we separate dry and wet minor (top) and major (bottom) mergers that took place in galaxies with 1010M
⊙ < Mstars < 1010.5M⊙ into the subsamples of co-rotating (cos(θspin) > 0.7; see Eq.2for a definition ofθspin), and perpendicular or counter-rotating galaxies (cos(θspin)<0.15).