University of Massachusetts Medical School
University of Massachusetts Medical School
eScholarship@UMMS
eScholarship@UMMS
Open Access Articles
Open Access Publications by UMMS Authors
2015-06-01
Loss of mTOR signaling affects cone function, cone structure and
Loss of mTOR signaling affects cone function, cone structure and
expression of cone specific proteins without affecting cone
expression of cone specific proteins without affecting cone
survival
survival
Shan Ma
University of Massachusetts Medical School
Et al.
Let us know how access to this document benefits you.
Follow this and additional works at:
https://escholarship.umassmed.edu/oapubs
Part of the
Cellular and Molecular Physiology Commons
,
Eye Diseases Commons
, and the
Ophthalmology Commons
Repository Citation
Repository Citation
Ma S, Venkatesh A, Langellotto F, Le YZ, Hall MN, Ruegg MA, Punzo C. (2015). Loss of mTOR signaling
affects cone function, cone structure and expression of cone specific proteins without affecting cone
survival. Open Access Articles.
https://doi.org/10.1016/j.exer.2015.04.006
. Retrieved from
https://escholarship.umassmed.edu/oapubs/2712
Creative Commons License
This work is licensed under a
Creative Commons Attribution-Noncommercial-No Derivative Works 4.0 License
.
This material is brought to you by eScholarship@UMMS. It has been accepted for inclusion in Open Access Articles
by an authorized administrator of eScholarship@UMMS. For more information, please contact
Loss of mTOR signaling affects cone function, cone structure and
expression of cone speci
fi
c proteins without affecting cone survival
Shan Ma
a,b, Aditya Venkatesh
b, Fernanda Langellotto
b,1, Yun Z. Le
c, Michael N. Hall
d,
Markus A. Rüegg
d, Claudio Punzo
b,*aTianjin Medical University Eye Hospital, No. 251 Fu Kang Road, Nankai District, Tianjin 300384, PR China
bDepartment of Ophthalmology, University of Massachusetts Medical School, 368 Plantation Street, Worcester, MA 01605, USA
cDepartment of Medicine Endocrinology, University of Oklahoma Health Sciences Center, BSEB 302G, 941 S L Young Blvd., Oklahoma City 73104, USA dBiozentrum, University of Basel, Klingelbergstrasse 70, CH-4056 Basel, Switzerland
a r t i c l e i n f o
Article history:Received 22 January 2015 Received in revised form 1 April 2015
Accepted in revised form 9 April 2015 Available online 14 April 2015
Keywords: Photoreceptors Cone survival PI3K mTOR Diabetic retinopathy Retinitis pigmentosa Visual function Neuroprotective
a b s t r a c t
Cones are the primary photoreceptor (PR) cells responsible for vision in humans. They are metabolically highly active requiring phosphoinositide 3-kinase (PI3K) activity for long-term survival. One of the downstream targets of PI3K is the kinase mammalian target of rapamycin (mTOR), which is a key regulator of cell metabolism and growth, integrating nutrient availability and growth factor signals. Both PI3K and mTOR are part of the insulin/mTOR signaling pathway, however if mTOR is required for long-term PR survival remains unknown. This is of particular interest since deregulation of this pathway in diabetes results in reduced PR function before the onset of any clinical signs of diabetic retinopathy. mTOR is found in two distinct complexes (mTORC1&mTORC2) that are characterized by their unique accessory proteins RAPTOR and RICTOR respectively. mTORC1 regulates mainly cell metabolism in response to nutrient availability and growth factor signals, while mTORC2 regulates pro-survival mechanisms in response to growth factors. Here we analyze the effect on cones of loss of mTORC1, mTORC2 and simultaneous loss of mTORC1 &mTORC2. Interestingly, neither loss of mTORC1 nor mTORC2 affects cone function or survival at one year of age. However, outer and inner segment morphology is affected upon loss of either complex. In contrast, concurrent loss of mTORC1 and mTORC2 leads to a reduction in cone function without affecting cone viability. The data indicates that PI3K mediated pro-survival signals diverge upstream of both mTOR complexes in cones, suggesting that they are independent of mTOR activity. Furthermore, the data may help explain why PR function is reduced in diabetes, which can lead to deregulation of both mTOR complexes simultaneously. Finally, although mTOR is a key regulator of cell metabolism, and PRs are metabolically highly active, the data suggests that the role of mTOR in regulating the metabolic transcriptome in healthy cones is minimal.
©2015 The Authors. Published by Elsevier Ltd. This is an open access article under the CC BY-NC-ND license (http://creativecommons.org/licenses/by-nc-nd/4.0/).
1. Introduction
Photoreceptors (PR) are among the highest energy consuming cells in the human body (Ames, 2000). Two reasons contribute to
the fact that PRs have such a high energy demand. First, like all neurons PRs need large quantities of ATP to re-equilibrate light evoked membrane potentials (Ames, 2000). Second, because PRs shed their outer segments (OS) daily (Young, 1971) they need to resynthesize their lost lipids and proteins. The PR-OS is so densely packed (Bownds et al., 1971; Lisman and Bering, 1977; Young, 1971) to optimize absorption of light photons that in average, the lipid and protein content of a PR is 10e15higher than that of a normal cell (Lowry et al., 1951; Scott et al., 1988; Whikehart, 2003). Since PRs shed approximately 10% of their OSs every day, the lipid and protein content that needs to be re-synthesized amounts roughly to that of a cell division per day, suggesting that the metabolic profile of PRs should at least in part be similar to that of dividing cells.
*Corresponding author.
E-mail addresses: [email protected] (S. Ma), Aditya.Venkatesh@ umassmed.edu (A. Venkatesh), [email protected]
(F. Langellotto), [email protected] (Y.Z. Le), [email protected] (M.N. Hall),
[email protected] (M.A. Rüegg), [email protected]
(C. Punzo).
1 Present address: Department of Pathology, Children's Hospital, Harvard Medical
School, Enders 1126, 300 Longwood Ave, Boston, MA 02115, USA.
Contents lists available atScienceDirect
Experimental Eye Research
j o u r n a l h o m e p a g e :w w w . e l s e v i e r . c o m / l o c a t e / y e x e r
http://dx.doi.org/10.1016/j.exer.2015.04.006
Dividing cells have a high glycolytic rate and diverge large amounts of glycolytic intermediates into the pentose phosphate pathway (PPP) to meet their anabolic needs (Vander Heiden et al., 2009) such as NADPH production for fatty acid synthesis (DeBerardinis et al., 2008). The high glycolytic rate is accompanied by lactate production and secretion in the presence of ample oxy-gen, a phenomenon known as Warburg effect (Vander Heiden et al., 2009). Such metabolic adaptations that allow cells to proliferate are regulated largely by mTORC1, which controls the expression of a gene regulatory network including glycolysis, the PPP, and lipid biosynthesis (Duvel et al., 2010). Similar to dividing cells, most of the glucose taken up by PRs does not enter the Krebs cycle (Winkler et al., 2004). Photoreceptors secrete large amounts of lactate (Chertov et al., 2011; Winkler et al., 2003, 2004) in the presence of almost arterial oxygen concentrations (Bill et al., 1983) indicating that PRs as well have a high glycolyticflux to meet their anabolic needs. Thus, the similarities between PR metabolism and that of proliferating cells suggest that mTORC1 plays a central role in PRs too.
In contrast to mTORC1, which alters its activity in response to nutrient availability and growth factor signals, mTORC2 activity is regulated mainly by growth factors. A key component that medi-ates growth factor signals to both mTOR complexes is the second messenger phosphatidylinositol (3,4,5)-trisphosphate (PIP3), which synthesis depends on PI3K activity. A recent report showed that loss of the p85
a
regulatory subunit of PI3K in cones results in cone death over time (Ivanovic et al., 2011) and accelerates cone death in a mouse model of retinitis pigmentosa (Rajala et al., 2013). We showed that systemic administration of insulin, which activates PI3K, promotes cone survival in retinitis pigmentosa (Punzo et al., 2009). Additionally, we showed that constitutively activated mTORC1 doubles the number of surviving cones in retinitis pig-mentosa by increasing the expression of key metabolic mTORC1 target genes that increase NADPH production, while loss of mTORC1 doubles the speed at which cones die during disease (Venkatesh et al., 2015). The role of insulin/PI3K/mTOR signaling in cones is further exemplified by the fact that patients suffering from diabetes mellitus, which causes systemic deregulation of insulin signaling (Zoncu et al., 2011), show reduced basal retinal insulin signaling (Reiter et al., 2006) and visual dysfunction of rods and cones before the onset of any clinical changes associated with diabetic retinopathy (Jackson and Barber, 2010). While thesefi nd-ings highlight the importance of this signaling pathway to PR function and survival, the role of mTOR, which integrates growth factor signals and nutrient availability, remains unexplored in non-diseased cones. Little is known how different growth factor signals converge and regulate the metabolic demands of one of the body's most active cell type.To dissect the role of the two mTOR complexes in cones we made use of the Cre/lox (Gu et al., 1994) system by crossing a cone specific Cre driver-line (Le et al., 2004) to a line carrying a condi-tional knockout allele for RaptorC/C, thereby generating loss of mTORC1 (Bentzinger et al., 2008) activity, and a line carrying a conditional knockout allele for RictorC/C, causing loss of mTORC2 (Bentzinger et al., 2008) activity. Finally, we generated a line car-rying both conditional alleles and the cone-specific Cre resulting in loss of all mTOR activity. Surprisingly, neither loss of RAPTOR or RICTOR had a significant effect on cone function and survival in one-year-old mice. In contrast concurrent loss of RAPTOR and RICTOR resulted in reduced cone function without affecting cone viability at one year of age. The data shows that PI3K mediated pro-survival signals in cones do not require mTOR activity. It further suggests that even though PR metabolism is similar to that of dividing cells, the metabolic transcriptome that is regulated by mTORC1 in proliferating cells is less dependent on mTORC1 activity
in healthy cones, while loss of mTORC1 in retinitis pigmentosa plays a crucial role in helping cones to adapt to the metabolic deficits caused by the loss of rods. Finally, it suggests that the reduction in PR function seen in patients suffering from diabetes mellitus may in part be caused by simultaneous deregulation of both mTOR complexes.
2. Material and methods
2.1. Animals
All procedures involving animals were in compliance with the ARVO Statement for the Use of Animals in Ophthalmic and Vision Research. Mice were maintained on a 12-h light/dark cycle with unrestricted access to food and water. Lighting conditions were kept constant in all cages with illumination ranging between 10 and 15 lux depending on the level of a cage within the rack. Wild type mice (C57Bl/6J) and the Ai9 Cre reporter line (Madisen et al., 2010) were purchased from Jackson Laboratory. The M-opsin Cre (M-Creþ),RaptorC/C, andRictorC/Cmice have been described previ-ously byLe et al. (2004), Bentzinger et al. (2008)andBentzinger et al. (2008)respectively. Genotyping was performed as described in the original publications (Bentzinger et al., 2008; Le et al., 2004). All mice were genotyped for the absence of the retinal degenera-tion 8 (rd8) allele, which harbors a mutation in the Crumbs 1 gene (Mattapallil et al., 2012).
2.2. Electroretinography (ERG) and Funduscopy
ERG was performed as described inLi et al. (2013) using the Espion3 console in conjunction with the ColorDome (Diagnosys LLC, Lowell, MA, USA). In brief, mice were dark-adapted overnight for scotopic ERGs and anesthetized by an intraperitoneal injection of a ketamine/xylazine (100 mg/kg and 10 mg/kg) mixture. One drop of each, Phenylephrine (2.5%) and Tropicamide (1%) was applied for pupil dilation 10 min prior to recording. Animals were kept on a warming plate during the entire ERG procedure to maintain the body temperature at 37C. The dark-adapted ERG protocol consisted offive steps with increasing stimulus strengths from 0.009 to 100 cd s/m2, with a mixed white light (white 6500 K) produced by a Ganzfeld stimulator. All flashes were presented without background illumination and constant interstimulus in-tervals of 5 s for dimflashes and up to 30 s for brightflashes to maintain dark adaptation. Flash frequency was 0.07 Hz for bright
flashes and up to 0.5 Hz for dimflashes. Band-passfiltering was applied from 0.312 to 300 Hz. Averages ranged from 10 trials for dim flashes to five trials for brightflashes. Photopic ERGs were performed without prior dark adaptation using the anesthesia protocol used for scotopic ERGs. Photopic ERGs were recorded after light adaptation with a background illumination of 34 cd/m2(white 6500 K) for 8 min. Each recording consisted of 10 singleflash of 10 cd s/m2. Five trials were averaged for single-flash responses. Both, scotopic and photopic ERGs were performed with a gold wire electrode. For photopic ERGs a minimum of 6 animals per time point were used except at 12 months of age where a minimum of 5 animals were used. Scotopic ERGs were performed with a mini-mum of 5 animals. Funduscopy was performed as described in
Venkatesh et al. (2013) utilizing the Micron III camera (Phoenix Research Labs, Pleasanto, CA, USA).
2.3. Histological methods
Antibody stainings on retinal cryo-sections and retinal flat mounts were performed as described previously (Punzo et al., 2009; Venkatesh et al., 2013). Retinal flat mount images for the
MW OPSIN expression analyses were acquired by tiling individual images taken at 16(Leica DM5500) over the entire retinal sur-face area with an automated scanning stage. Retinal explants were performed as described (Punzo et al., 2009) and retinas were cultured for 30 min in DMEM (±insulin at 0.03 Units/ml culture media) prior to processing the tissue for antibody stain-ings. The following primary antibodies and concentrations were used: mouse
a
-Cre (1:500) Covance (Cat# MMS-106P); rabbita
-mw-opsin (1:300) Millipore (Cat# AB5405); goata
-sw-blue (1:500) Santa Cruz (sc-14365); rabbita
-Cone arrestin (1:300) Millipore (Cat# 15282); rabbita
-Cone transducin (gamma sub-unit) (1:1000) Vadim Y. Arshavsky, Duke University, Durham, NC, USA; rabbita
-p-AKT473(1:1000) (Cat# 4060); rabbita
-p-Ndrg1346 (1:2000) (Cat# 5482); rabbita
-pS6235 (1:1000) (Cat# 2211); rabbita
-raptor (1:200) (Cat# 2280); rabbita
-rictor (1:200) (Cat# 2140), all from Cell Signaling; mousea
-raptor (1:200) Millipore (Cat# 05-1470); mousea
-rictor (1:200) Novus Biologicals (Cat# NBP1-51645); Fluorescein labeled peanut agglutinin lectin (PNA) (1:500) Vector Laboratories (Cat# FL-1071). All secondary anti-bodies (donkey) were purchased from Jackson ImmunoResearch and are purified F(ab)2 fragments that display minimal cross reactivity to other species. Transmission Electron Microscopy (TEM) was performed as described (Li et al., 2013). In brief, mouse eyes were enucleated andfixed in 2.5% glutaraldehyde in 0.1 M sodium cacodylate buffer (pH 7.2) for 20 min at RT. Then, cornea and lens was removed and eyecups werefixed overnight at 4C in the samefixative. Eyecups were washed three times with 0.1 M sodium cacodylate buffer and postfixed in 1% osmium tetroxide/ 0.1 M cacodylate buffer, dehydrated through an ethanol gradient to 100%, and embedded in epoxy resin. Semi-thin sections (1m
m) and ultrathin sections (70 nm) were cut with an ultramicrotome (Leica Reichart-Jung; Leica Microsystems) and stained with tolu-idine blue or 2% uranyl acetate and 4% lead citrate respectively. Semi-thin sections were visualized with a Leica DM5500 micro-scope and ultrathin sections were visualized with a transmission electron microscope (Philips CM-10; Philips, Eindhoven, The Netherlands).2.4. Quantification of cone survival
Antibody staining and image acquisition was performed as described above. Retinas were divided into 2 sectors with radiuses of 1 mm and 1.5 mm, respectively (Fig. 6B). Cones were counted manually in 4 squares per sector, each square measuring 40,000
m
m2, to determine the average cone density per sector and genotype (cones/mm2). Only two retinas per genotype were analyzed as no difference was observed between the two different genotypes.2.5. Molecular methods
For Western blotting retinas of one month oldCreþand Cree
animals were pooled and homogenized by sonication in Ripa buffer containing protease and phosphatase inhibitors (Roche; cOmplete: Protease inhibitor cocktail; and PhosStop: Phosphatase inhibitor cocktail). Protein concentration was assessed (BioRad: Protein Assay Kit) and 10
m
g of protein was loaded per lane. Proteins were separated on a 4e20% Tris-Glycine gradient gel (BioRad) and transferred onto a nitrocellulose membrane. Incubations were done according to the recommendations of the antibody manufacturer. Signal was detected with SuperSignal West Dura (Pierce). The following primary antibodies were used: rabbita
-raptor (1:1000) (Cat# 2280); rabbita
-rictor (1:1000) (Cat# 2140) both from Cell Signaling; mousea
-b
-actin (1:2000) Sigma (Cat# A5316); mousea
-Cre (1:2000) Novagen (Cat# 69050-3); rabbita
-mw-opsin (1:300)Millipore (Cat# AB5405); goat
a
-sw-blue (1:500) Santa Cruz (sc-14365); rabbita
-Cone arrestin (1:300) Millipore (Cat# 15282); rabbita
-Cone transducin (gamma subunit) (1:1000) Vadim Y. Arshavsky, Duke University, Durham, NC, USA; the secondary antibody (HRP coupled, Santa Cruz) was used at a dilution of 1:10,000. PCR analysis was performed on genomic DNA from ret-inas of one month oldCreþandCreeanimals using a standard DNA extraction method for genotyping. PCR reactions were performed as described byBentzinger et al. (2008)to detect the conditional allele with primer 1þ2 and the recombined allele with primers 1þ3. The presence of theCreallele was detected as described byLe et al. (2004).3. Results
3.1. Raptor and Rictor are efficiently deleted in cones
To study the role of the two mTOR complexes in cones, the
Raptor(Bentzinger et al., 2008) andRictor(Bentzinger et al., 2008) conditional knockout alleles were crossed to a cone-specific Cre driver-line that expresses CRE recombinase under the control of the human medium and long wave length promoter (Le et al., 2004) (hence referred to asM-Creþ). The new lines,M-Creþ/e_RaptorC/C,
M-Creþ/e_RictorC/C, and M-Creþ/e RaptorC/C_RictorC/C were then backcrossed to their respectiveCreeparent linesRaptorC/C,RictorC/C
andRaptorC/C_RaptorC/Cto generateCreþandCreelittermates that were used for analysis. Both conditional knockout alleles used here have been used successfully in previous studies to address the role of mTORC1 and mTORC2 in various tissues (Bentzinger et al., 2008; Cybulski et al., 2009; Romanino et al., 2011; Thomanetz et al., 2013; Venkatesh et al., 2015). Similarly, theM-Creþline has been used successfully to study the role of various genes in cones (Busskamp et al., 2014; Crouse et al., 2014; Ivanovic et al., 2011; Venkatesh et al., 2015). To verify that CRE recombinase is active in all cones across the retina wefirst crossed theM-Creþ/eline to the Ai9 Cre-reporter line (Madisen et al., 2010), which expresses tdTomato upon CRE recombinase expression. The uniform distribution of tdTomato inCreþretinas (compareFig. 1A and B toFig. 1CeE) shows that CRE recombinase is active across the entire retina suggesting that loss of the conditional alleles should occur uniformly. To confirm that CRE expression resulted in recombination of the conditional knockout alleles ofRaptorandRictor, we performed a qualitative PCR analysis with genomic DNA isolated from retinas of one month old Creþ and Cree littermates. In both cases the recombined alleles were identified (Fig. 1F); however, the sensi-tivity of PCR makes it difficult to address the efficiency of recombination.
To test for efficient recombination of theRaptorandRictoralleles in cones we first performed an immunoblot analyses with total retinal extracts. The analysis revealed no appreciable decline in the protein levels of RAPTOR and RICTOR upon loss of either gene in cones (sFig. 1A). The result is explained by the fact that cones ac-count for only ~3% of the total number of cells in the retina (Cepko et al., 1996; Jeon et al., 1998), thus loss of ubiquitously expressed proteins such as RAPTOR and RICTOR is difficult to detect by a technique that uses whole retinal extracts. Immunofluorescence analyses on retinal cross section with two different antibodies directed against RAPTOR and two antibodies directed against RIC-TOR did not reveal any specific signal either (sFig. 1B and C) making it impossible to test for direct loss of RAPTOR or RICTOR in cones. However, since loss ofRaptorandRictoris used to ultimately induce loss of mTORC1 and mTORC2 activity we thought to test if kinase activity is abolished in cones by analyzing the phosphorylation status of their respective downstream targets. The most reliable biomarker to assess mTORC1 activity is ribosomal protein S6. S6 is
phosphorylated by ribosomal protein p70 S6 kinase (S6K), which is activated by mTORC1. One recently identified biomarker for mTORC2 activity is N-myc downstream regulated 1 (Ndrg1) (Garcia-Martinez and Alessi, 2008; Murray et al., 2004). Ndrg1 is directly phosphorylated by serum- and glucocorticoid-induced ki-nase 1 (SGK1), which is directly activated by mTORC2. The only other two mTORC2 targets known are AKT phosphorylated on Ser473 and protein kinase C (PKC) (Guertin et al., 2006; Zoncu et al., 2011).
To test if mTORC1 and mTORC2 kinase activity is lost in cones we
performed immunofluorescence analyses on retinal cross sections of wild-type mice for p-AKT473, p-NDRG1346and p-S6235. None of the three proteins showed any appreciable signal in PRs, while immunoreactivity was readily detectable in the inner nuclear layer (INL) and ganglion cell layer (GCL) (Fig. 2). Thisfinding prompted us to test if phosphorylation of these mTOR targets could be induced in cones by activation of the pathway through insulin. To that end retinas were cultured in regular DMEM media in the presence or absence of insulin for 30 min. This led to phosphorylation of NDRG1 and S6 in PRs while AKT473 phosphorylation did not change. The
finding is consistent with the negative feedback loop between mTORC1 and mTORC2, in which S6K1, which is activated by mTORC1, reduces mTORC2 activity towards AKT473but not SGK1 and PKC (Dibble et al., 2009; Julien et al., 2010; Treins et al., 2010). As expected the increase in phosphorylation of NDRG1 and S6 was higher in retinas cultured in the presence of insulin than in retinas cultured for 30 min in DMEM alone. However, because retinas cultured in DMEM alone showed less phosphorylation of NDRG1 and S6 in rods, the signal in cones was much more apparent (Fig. 2). Thus we performed our mTOR activity assay in retinas that were cultured only in DMEM. As seen on retinalflat mounts deletion of
Raptorand simultaneous deletion ofRaptorandRictorcompletely abolished the increase of p-S6 in cones of retinas cultured for 30 min in DMEM alone. In contrast, deletion ofRictoralone did not abolish the p-S6 signal. Together the data indicate thatRaptorwas indeed efficiently deleted in all cones (Fig. 3A). Similarly, as seen in retinal cross section the increase in p-NDRG1 was lost in cones upon deletion ofRictorand deletion ofRictorandRaptorbut was still present upon deletion ofRaptoralone indicating thatRictorwas also efficiently deleted in cones (Fig. 3B). Moreover, we recently showed using the same Cre-driver line and the sameRaptorand
Rictor conditional alleles that in retinitis pigmentosa loss of RAPTOR in cones abolishes S6 phosphorylation even when mTORC1 is constitutively activated. Similarly, loss of RICTOR prevents the phosphorylation of AKT473in cones, a phosphorylation of AKT in cones that occurs as the disease progresses (Venkatesh et al., 2015). In summary, the data presented inFigs. 1e3combined with our previously reported data suggest thatRaptorand Rictorare effi -ciently deleted in cones.
3.2. Loss of mTORC1 and mTORC2 but not mTORC1 or mTORC2 affects cone function
To evaluate cone function upon loss of Raptor and/or Rictor
electroretinography (ERG) analyses were performed over a time period of one year. Interestingly, neither loss ofRaptor orRictor
resulted in a significant decline in cone function as seen by the photopic b-wave recordings at one year of age (Fig. 4A, C and G). However, in both cases there was a slight reduction in cone function that was statistically significant prior to one year of age. The reduction was observed at 4 months of age whenRaptorwas lost and at 2 months of age whenRictorwas lost. No other time point showed a statistically significant difference between Creþ
and Cree littermates. In contrast, deletion of both Raptor and
Rictorled to a steady decline in PR function (Fig. 4E and G) and by 1 year of age the b-wave amplitude inCreeanimals was 2.4 times higher than that recorded inCreþmice (Fig. 4H). Analyses of the photopoic a-waves, which are a direct readout of PR function did not show any statistically significant differences around the time points at which loss of RAPTOR or RICTOR alone showed a decline in the b-waves (sFig. 2A and C). This is likely due to the fact that a-waves in mouse are rather small due to the small number of cones. B-waves, which represent bipolar responses due to changes in the release of glutamate by PRs, are thus a more reliable readout for cone function as they amplify the rather small Fig. 1.Recombination ofRaptorandRictoralleles. (A, B) Retinalflat mounts showing
Cre recombinase activity across all retinal cones by expression of tdTomato (red signal). (A) Shows only tdTomato signal while (B) shows colocalization between tdTomato and cone arrestin (green signal). Boxed areas below show higher magnifications demon-strating that tdTomato is in cones as it is colocalized with cone arrestin (green signal). (C)Creecontrol retina stained for cone arrestin (green signal) showing no tdTomato signal (absence of red signal in C). (D, E) Higher magnification of an area in (C) showing the red channel (D) for tdTomato and green channel (E) for cone arrestin separately. The absence of signal in (D) shows that tdTomato is not expressed when Cre is not present. (F) Qualitative PCR analysis with genomic DNA extracted from retinas of one month oldCreeandCreþlittermates and from C57Bl/6J control mice. Primers 1þ2 detect the conditional alleles that are absent in C57Bl/6J, while primers 1þ3 detect the recombined alleles only in extracts fromCreþretinas (lane 2 and 6).
signal of cones. In this regard, statistically significant a-wave changes were observed upon simultaneous loss of Raptor and
Rictor(sFig. 2E) as the percentage in b-wave changes were much more apparent upon loss of both genes. Scotopic ERG recordings at one year of age showed a widening gap betweenCreeandCreþ
animals upon concurrent loss of Raptor and Rictor at the two highestflash intensities suggesting that rod function was altered (Fig. 4B, D and F;sFig. 2B, D and F). At the highestflash intensity the difference was almost statistically significant (p¼0.054). The result confirms the reduction in photopic ERGs upon loss of both alleles since at these high light intensities cones contribute to the ERG recordings even under scotopic conditions. To test if CRE recombinase itself had an effect on PR function, control ERGs were performed onM-Creþanimals. Rod and cone ERG recordings were normal at one year of age (Fig. 4A and B;sFig. 2A and B) indicating that the phenotypes observed are not due to expres-sion of the CRE protein in cones. In summary, the steady increase in the ratio of the photopic b-wave amplitude over time between
Cree and Creþ animals upon simultaneous loss of Raptor and
Rictorindicates that both, mTORC1 and mTORC2, are required to maintain cone function. This suggests that both alleles have been efficiently recombined in cones since loss of either allele alone does not alter the b-wave amplitude ratio betweenCreeandCreþ
animals over time.
3.3. Expression of cone specific proteins but not cone number is affected upon loss of Raptor and/or Rictor
To determine if the decline in PR function was caused by a loss of cones we performed a fundus analysis and an immunofluorescence analysis on retinal cross sections at 1 year of age. The fundus analysis showed no significant difference betweenCreþandCree
littermates of all three genotypes suggesting that the overall health of the retina and adjacent retinal-pigmented epithelium (RPE) was not affected (sFig. 3). The immunofluorescence analyses on retinal cross-sections for 4 cone specific genes including cone Arrestin, coneTransducin-
g
,Mw-opsin(medium wavelength opsin) and Sw-opsin(short wavelength opsin) showed that the cone OSs staining appeared less defined and uniform inCreþanimals when compared to Cree control mice (Fig. 5) suggesting some OS abnormalities. Additionally, concurrent loss of Raptor and Rictor caused also a reduction in the expression of the 4 aforementioned proteins in some cone OSs (Fig. 5). Because immunofluorescence is not as quantitative we performed a western blot analysis at 1 year of age to test if the expression of these 4 cone-specific proteins was indeed downregulated. The immunoblot analysis showed that cone ARRESTIN and SW-OPSIN were drastically reduced upon loss ofRaptorand Rictorand slightly reduced upon loss of Raptoralone while TRANSDUCIN and MW-OPSIN showed only a slight reduction Fig. 2.Immunofluorescence analysis for mTOR target genes. (AeC) Immunofluorescence analysis on retinal section of C57Bl/6J mice for p-AKT473(A), p-NDRG1346(B) and p-S6235
(C) (red signal) showing that most of the immunoreactivity is in the ganglion cell layer (GCL) and the inner nuclear layer (INL) and absent from the outer nuclear layer (ONL) (first column: 50% of the PNA and nuclear DAPI signal has been removed to better visualize the protein of interest). After culturing retinas for 300in DMEM with insulin (second column
AeC) p-NDRG1 and p-S6 levels increase in rods and cone while p-AKT remains unaffected. Culturing the retinas in DMEM alone for the same time however results in a preferential increase of p-NDRG1 and p-S6 in cones but still leaves p-AKT unaffected (last column AeC) (green: PNA; blue nuclear DAPI; Scale bar: 25mm).
upon simultaneous loss ofRaptorandRictorand no reduction upon loss of each individual allele (sFig. 4). However, there appeared no significant loss of cones by immunofluorescence on retinal sections between theCreþandCreelittermate of all genotypes at 1 year of age (Fig. 5), a result that was confirmed by an actual cone count in all three genotypes (Fig. 6). Thefindings suggest that the decline in photopic ERG recordings upon complete loss of mTOR signaling was not due to a loss of cones but rather a reduction in the expression of cone specific proteins combined with abnormal OS structure.
We previously showed that treatment of wild-type mice with rapamycin results in a dramatic reduction of ventral MW-OPSIN expression (Punzo et al., 2009). Thus we were surprised that MW-OPSIN was still expressed at 1 year of age even upon com-plete loss of mTOR signaling. Normally, rapamycin inhibits the assembly of the mTORC1 complex thereby preventing mTORC1 activity. However, prolonged exposure to rapamycin has been shown to also affect mTORC2 activity (Lamming et al., 2012; Robida-Stubbs et al., 2012; Sarbassov et al., 2006; Ye et al., 2012). As the previous treatment was performed over a time period of two weeks, the activity of both complexes could have
been downregulated. The question as to which of the two mTOR complexes may regulate ventral MW-OPSIN expression is of in-terest since ventral MW-OPSIN expression is also downregulated in retinitis pigmentosa (Punzo et al., 2009), a retinal degenerative disease where mTOR signaling is altered in cones. To test if MW-OPSIN was lost at any other time its expression was analyzed at 1-month intervals by immunofluorescence on dorsal and ventral regions of the retina.
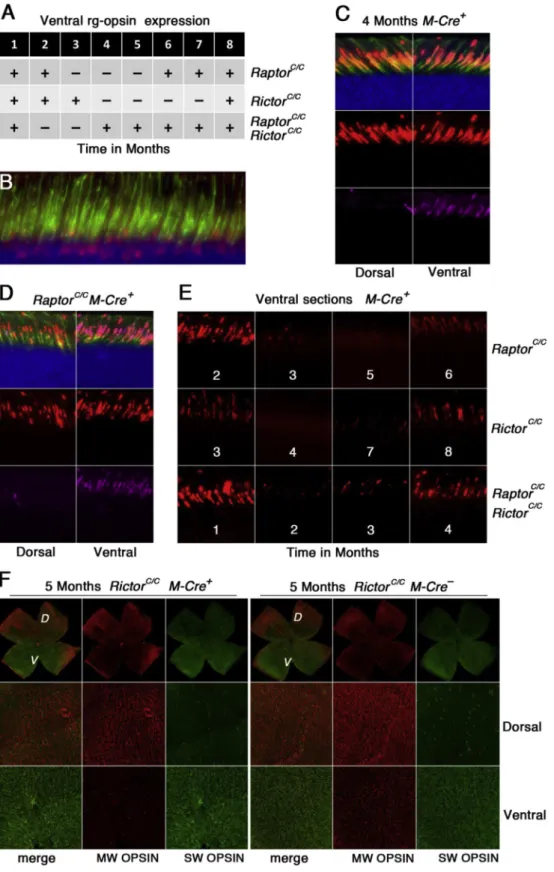
Ventral regions of the retina were identified by the expression of the ventrally enriched SW-OPSIN. The analysis was carried out on retinal sections and retinalflat mounts. Loss ofRaptorresulted in ventral loss of MW-OPSIN expression at around 3 months of age and by 6 months of age ventral MW-OPISIN expression was restored and was still detectable at 1 year of age (Fig. 7A, D and E). Interestingly, loss of Rictor resulted as well in loss of ventral MW-OPSIN. In contrast to loss of Raptor, the reduction in ventral MW-OPSIN expression started one month later, at 4 months of age, and continued until 8 months of age when ventral MW-OPSIN expres-sion was restored (Fig. 7A, E and F). Concurrent loss ofRaptorand
Rictorresulted in a downregulation of ventral MW-OPSIN at 2 and 3 months of age and by 4 months of age the expression was restored Fig. 3.Verification ofRaptorandRictorloss in cones. Immunofluorescence analysis on retinal whole mounts (A) and retinal sections (B) on 1 month old animals of genotypes indicated on top of each column (first column:Creecontrol ofRaptorC/C). In all cases (A, B) retinas were explanted and cultured for 30 min in regular DMEM without insulin. (A)
Increased phosphorylation of S6 is not seen whenRaptoris lost (2nd and 4th column in A). (B) Similarly, increased p-NDRG1 is absent in cones of animals in whichRictorhas been removed (3rd and 4th column in B) (red: p-S6 or p-NDRG1 as indicated; green: PNA; blue: SW-OPSIN in A, nuclear DAPI in B).
(Fig. 7A and E). Control immunofluorescence analyses onM-Creþ
animals showed that while CRE is found in all cones (Fig. 7B) ventral MW-OPSIN expression is maintained at 4 months of age (Fig. 7C) suggesting that the loss is not due to the expression of CRE recom-binase itself. Additionally, none of the other PR proteins tested at 1 year of age showed a ventral reduction at 4 months of age (sFig. 5), when loss of either mTOR complexes reduces ventral MW-OPSIN expression. In summary, the data indicates that neither mTOR complex regulates the expression of ventral MW-OPSIN directly in cones, suggesting that ventral loss MW-OPSIN occurs secondary to changes in the insulin/mTOR signaling pathway.
3.4. Cone structure is affected upon loss of Raptor and/or Rictor
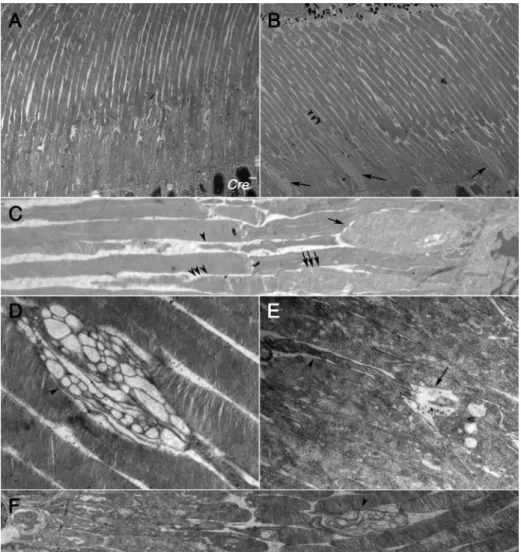
To further analyze the cone OS structural abnormalities seen by immunofluorescence analyses we used transmission electron mi-croscopy (TEM) on retinal sections of 1-year-old animals. TEM revealed thickened cone inner segments (IS) upon loss of Raptor
and concurrent loss ofRaptorandRictor(Fig. 8). Normally, cones are not easy identifiable in mouse by TEM (Fig. 8A); however, loss of
Raptormade it easier to identify cones even at low resolution due to the enlarged IS (Fig. 8B). Higher magnification TEM showed that upon loss ofRaptormany cones with a thickened IS (Fig. 8C; single Fig. 4.Photoreceptor function. (A, C, E) Photopic ERG recordings showing b-wave responses inCreeandCreþRaptorC/Cmice (A),RictorC/Cmice (C), andRaptorC/C_RictorC/Cmice (E).
(B, D, F) Scotopic ERG recordings showing b-wave responses at 12 months of age. Yellow bar and line in (A, B) show control ERG of 12 months oldM-Creþmice without any conditional alleles. (G) Examples of ERG traces at 2 months and 12 months for genotypes indicated. (H) Ratio of photopic b-wave amplitudes ofCree/Creþanimals for each genetic combination, showing that only upon loss ofRaptorandRictor, the difference in cone response betweenCreeand Creþanimals continuously increases over time.
arrow) had strongly reduced OSs, both in length and width (Fig. 8C; single arrowhead). Nonetheless, normal looking cone inner and OSs (Fig. 8C; triple arrows and triple arrowheads respectively) as well as enlarged cone ISs with normal cone OSs were seen (Fig. 8B; middle arrow and triple arrowheads). In contrast to loss ofRaptor, loss of
Rictor did not facilitate the identification of cones based on the thickness of their ISs. Only occasionally were malformed cone OSs with large vacuolar structures seen (Fig. 8D; arrowhead).
Concurrent loss ofRaptorandRictorresulted in a mixture of both phenotypes seen upon loss of each individual gene. Some ISs were enlarged (Fig. 8E, arrow) with small and reduced OSs (Fig. 8E, arrowhead) as seen upon loss of Raptor alone while other OSs looked similar to those seen upon loss ofRictor(Fig. 8F, arrowhead). To quantify how many cones showed structural abnormalities we analyzed cones on semi thin plastic embedded sections rather than the ultra thin sections required for TEM. This allowed us to Fig. 5.Cone specific genes expression at 1 year of age. Immunofluorescence analysis on retinal sections of 12 months oldRaptorC/CCreþ(B, C),RictorC/CCreþ(D, E) andRaptorC/ C_RictorC/CCreþ(F, G) animals. (A) Control stainings (red signal) inCreeanimals for proteins indicated on top of each column. (B, D, F) Show overlay images of nuclear DAPI in blue,
PNA in green and protein named on top of each column in red. (C, E, G) Show only red signal of rows (B, D, F) respectively. Arrows show normal cone OS morphology in control animals while arrowheads show examples of fragmented staining in the inner outer segment area. Examples are only indicated for loss of RAPTOR (Scale bar: 50mm).
analyze more cones since entire cross sections can easily be collected (sFig. 6A). Total cones were scored by the appearance of their nuclear morphology on semi thin sections as has been described previously (Carter-Dawson et al., 1978). The analysis showed that upon loss of Raptor 18% of cones showed inner segment abnormalities, 35% outer segment abnormalities and 10% displayed both abnormalities, while upon simultaneous loss of RAPTOR and RICTOR the number of abnormalities was 30%, 17% and 11%, respectively (sFig. 6B). The OS abnormalities seen by TEM upon loss of RICTOR were not quantifiable by this method, as they were not easily visualized by regular microscopy. The increase in IS width seen in cones upon loss ofRaptor(2.97
m
m±0.37m
m STDEV) or loss ofRaptorandRictor(2.42m
m±0.38m
m STDEV) was statistically significant when compared toCreecontrol mice (1.85m
m±0.26m
m STDEV) (sFig. 6C). Since we were not able to identify abnormal cones by regular light microscopy upon loss ofRictorthe width of 44 random chosen IS was measured (1.87m
m±0.34m
m STDEV) showing no difference fromCreecontrol mice (sFig. 6C). In sum-mary, while loss ofRaptororRictordid not affect cone survival and only moderately the expression of the cone specific genes tested at one year of age, the structure of cone inner and OSs was affected in both cases and upon concurrent loss of both genes. However, the combined loss ofRaptorandRictordid not exacerbate the structural phenotypes in cones seen upon individual loss of these genes making it unlikely that reduced PR function upon complete loss of mTOR activity is due to the structural changes seen in the inner and OSs, but rather to the reduction in PR specific proteins. Because, there were more cones with structural defects upon loss ofRaptoror concurrent loss ofRaptor and Rictorthan upon loss of Rictor
alone, the data suggests that for cones mTORC1 activity may be more important than mTORC2, afinding that is paralleled by the phenotypes seen upon individual loss of each allele in retinitis pigmentosa (Venkatesh et al., 2015).
4. Discussion
4.1. mTORC1 and cone metabolism
In this study we set out to analyze the role of the two mTOR complexes in cones. Surprisingly, neither mTOR complex is
required to promote cone function and survival over a time period of one year and only concurrent loss of both complexes affects cone function without affecting viability. This is quite remarkable for the following reasons. Photoreceptors are metabolically highly active cells with a protein and fatty acid synthesis rate of approximately one cell division a day. Tissues with a high metabolic rate, high protein synthesis rate or a high cell division rate are generally quite affected by loss ofRaptor(Cloetta et al., 2013; Polak et al., 2008; Shende et al., 2011). It is thus surprising that in cones loss of
Raptorover the period of one year did not result in a more severe phenotype than morphological changes at the level of the inner and OSs as seen by TEM. The data suggests that the metabolic tran-scriptome that is generally controlled by mTORC1 in proliferating cells (Duvel et al., 2010) is either independent of mTORC1 activity in cones or its loss does not affect cone survival. In contrast, loss of mTORC1 activity in the retinal degenerative disease retinitis pig-mentosa is quite detrimental as cones die twice as fast in the absence of RAPTOR, while twice as many cones survive when mTORC1 is constitutively activated (Venkatesh et al., 2015). The improved survival coincides with an increase in the expression of genes that are part of the metabolic transcriptome controlled by mTORC1. Similarly, we showed previously that stimulation of the insulin/mTOR pathway by insulin can also prolong survival of metabolically compromised cones in retinitis pigmentosa (Punzo et al., 2009). Together the data suggest that while mTORC1 activ-ity may be less important to healthy cones, is it required to balance demand with supply when cones are metabolically challenged during disease. It is also possible that cone metabolism is less demanding than rod metabolism thus mTORC1 under normal conditions may be less important to cones than to rods. Most of the data on PR metabolism comes from studies that used rod rich retinas, thus little is known about the metabolic demands of cones themselves. It is thus possible that loss ofRaptorin rods may have a much more profound effect than in cones. Indeed, a recent report showed that rapamycin has a different effect on rods versus cones during light induced PR stress (Kunchithapautham et al., 2011). The
finding that loss of mTORC2 caused a milder phenotype than loss of mTORC1; however, is consistent with studies in many tissues, in which cell type specific ablation of the two complexes has been studied (Bentzinger et al., 2008; Kellersch and Brocker, 2013). It also Fig. 6.Cone quantification. (A) Bar graph showing the average number of cones/mm2inCreeandCreþanimals of all three genetic combinations at 1 year of age. (B) Schematic of
retinalflat mount indicating the two sectors in which cones were counted for data in (A). The two sectors have a radius of 1 mm and 1.5 mm, respectively. In each sector cones were counted across 4fields each measuring 40,000mm2. (CeF) Higher magnification of part of an area from sector 2 that was used to count cones for data in (A) showing even
Fig. 7.Reduction in ventral MW-OPISIN expression. (A) Table summarizing the time windows in which loss ofRaptor,Rictorand loss of both cause a reduction in ventral MW-OPSIN expression (plus sign: ventral MW-OPSIN present; minus sign: ventral MW-OPSIN absent). A total of 21 and 11CreþandCreeanimal respectively were analyzed over time for the
RaptorC/Callele, 16 and 13CreþandCreeanimals respectively for theRictorC/Callele, and 13 and 12 for the double loss of function respectively. (BeF) Immunofluorescence analysis on
retinal sections (BeE) and retinal whole mounts (F). (B) Example of CRE recombinase in cones at 4 months of age. (C) Four month oldCreþanimals showing normal expression of MW-OPSIN dorsally and ventrally. (D) Example of analysis performed on sections to determine the loss of MW-OPSIN ventrally. In this case MW-OPSIN is still present ventrally at 2 months of age upon loss ofRaptor. (E) Examples of ventral MW-OPSIN expression at the transition time windows for the three genotypes as indicated. Number in panel indicates age of animal in months. (F) Example of analysis performed on retinalflat mounts to corroboratefindings on sections. At 5 months of age, MW-OPSIN is lost ventrally upon loss ofRictor
parallels our recently published data showing that loss of RICTOR in cones of mice with retinitis pigmentosa did not alter the disease progression in contrast to loss of RAPTOR (Venkatesh et al., 2015).
4.2. Cone function and morphology upon loss of mTOR signaling
Thefindings in this study are also surprising in that the activity of both complexes is required to maintain PR function. Because each complex phosphorylates a different set of target genes redundancy between the two complexes is unlikely, suggesting that the function of at least one target per complex has to be compromised at the same time to affect PR function. Why PR function is affected remains to be determined. It is unlikely that the morphological changes in the inner and OSs alone are responsible for the reduction in cone function, as these morpho-logical changes did not worsen after combined loss of both com-plexes rather both types of morphological changes were seen. Reduced OSs were seen upon loss of RAPTOR, consistent with the role of mTORC1 in regulating protein synthesis. Large vacuolar structures in OSs were seen upon loss of RICTOR, consistent with the role of mTORC2 in regulating actin polymerization (Huang
et al., 2013). The additive effect of these two morphological changes in combination with a reduction in PR specific proteins could explain why cone function was reduced upon loss of both complexes. It is unlikely that the reduction in cone function was due to the temporary loss of ventral MW-OPSIN. This is because cone function declines only temporarily upon individual loss of
Raptor or Rictor, while it continuous to decline upon combined loss ofRaptorandRictor. Additionally, the decline in cone function upon loss ofRictordoes not coincide with the loss of ventral MW-OPSIN. Interestingly, in human diabetic patients PR function is reduced before the onset of any clinical signs associated with diabetic retinopathy (Jackson and Barber, 2010). Insulin signaling in these patients is likely altered in all retinal cells, a result that is supported by thefindings in diabetic animal models where basal retinal insulin receptor signaling is reduced (Rajala et al., 2009; Reiter et al., 2006). A reduction in basal insulin signaling likely affects both mTOR complexes at the same time in cones as well. Our findings in which cone function is reduced only when both complexes are affected may thus explain in part why patients with diabetes mellitus display reduced PR function before the onset of any clinical signs associated with diabetic retinopathy.
Fig. 8.Transmission electron microscopy analysis of inner and outer segment region at 12 months of age. (A)Creecontrol ofRaptorC/Cmice. (BeF) Images fromCreþ_RaptorC/C(B, C),
Creþ_RictorC/C(D) andCreþ_RaptorC/C_RictorC/Cmice (E, F). At low magnification (1450; A, B) cone inner segments are easily identified upon loss ofRaptor(arrows in B) due to the
enlargement of the inner segment. (C) Higher magnification (4600) showing enlarged cone inner segments (single arrows) and reduced cone outer segment (single arrowheads) next to normal cone inner segments (triple arrows) and normal cone outer segments (triple arrowheads). (D) Cone OS seen upon loss ofRictor. (E, F) The types of malformed cone inner and OSs found in the individual mutants are also found in the double mutants (compare to C, D). (E) Shows enlarged IS (arrow) and reduced OS (arrowhead) while (F) shows OS with large vacuoles (arrowhead).
4.3. Loss of MW-OPSIN
Thefinding that loss of either complex or concurrent loss of both complexes affects temporarily ventral MW-OPSIN expression is intriguing for the following reasons. First, none of the other cone specific proteins tested showed such a transient dorso-ventral reduction. Second, thesefindings contrast our previous findings in which 2 weeks of rapamycin administration was sufficient to downregulate ventral MW-OPSIN expression (Punzo et al., 2009). However, because in our previous experiment loss of mTORC1 signaling, and likely mTORC2 signaling due to prolonged rapamycin treatment occurred in all cells as rapamycin administration was systemic, our previous experiments and the ones presented in this study are not quite the same. It is possible that in our previous rapamycin experiment a reduction in mTOR signaling in Mueller Glia or RPE cells could have altered the expression of signals (secreted factors) between these cells and cones causing a rapid loss in ventral MW OPISN expression. In such a case one would not expect loss of ventral MW-OPSIN upon removal of mTOR signaling in cones unless the potential signal between cones and any other cell involves in part the insulin/mTOR pathway. This could explain why in each loss of function case the loss of ventral MW-OPSIN takes more time to occur and why its expression is eventually restored as a new signaling equilibrium is established. The data indicates that any imbalance in mTOR signaling can alter the expression of ventral MW-OPISN.
4.4. Cone survival signals
Various growth and trophic factors, as well as their downstream signaling pathways have been implicated in either being required for PR survival or promoting PR survival during disease (LaVail et al., 1998; Leveillard et al., 2004; Li et al., 2010; Mohand-Said et al., 1998, 2000, 1997; Rajala et al., 2008; Rajala et al., 2010; Steinberg, 1994; Streichert et al., 1999). While most growth factor receptors have their own dedicated signaling cascade most of these pathways alter PI3K activity, which is also an upstream kinase of the insulin/mTOR pathway. A recent report showed that PI3K is required for long-term cone survival (Ivanovic et al., 2011). It is thus surprising that concurrent loss of both complexes does not affect cone survival at one year of age, indicating that PI3K medi-ated pro survival signals are completely independent of mTOR signaling.
5. Conclusions
The aim of this investigation was to analyze the role of the central kinase mTOR to cone survival and function. The present study shows that mTOR activity is not required for cone survival, over the period of one year in mouse suggesting that trophic support for cones downstream of PI3K is independent of mTOR signaling. The data further suggests that the metabolic tran-scriptome that is generally controlled by mTORC1 in proliferating cells is either independent of mTORC1 in healthy cones or its loss does not affect cone survival. This contrasts the role of mTORC1 during retinal degeneration where its activity is required to prolong their survival (Venkatesh et al., 2015). Furthermore, the data suggests that deregulation of mTOR signaling in diabetes may be a contributing factor to the decline in PR function seen in patients suffering from diabetes mellitus since loss of mTOR signaling results in a decline in cone function. Finally, the study suggests that mTOR inhibitors used in clinical settings to treat cancers may be quite safe for cones with regards to their survival although reduced visual function could occur upon prolonged treatment.
Acknowledgments
We thank Vadim Y. Arshavsky (Duke University, Durham, NC) for sharing the cone transducin antibody. This work was supported by the NIH/NEI grant (R01 EY023570).
Appendix A. Supplementary data
Supplementary data related to this article can be found athttp:// dx.doi.org/10.1016/j.exer.2015.04.006.
References
Ames 3rd, A., 2000. CNS energy metabolism as related to function. Brain Res. Brain Res. Rev. 34, 42e68.
Bentzinger, C.F., Romanino, K., Cloetta, D., Lin, S., Mascarenhas, J.B., Oliveri, F., Xia, J., Casanova, E., Costa, C.F., Brink, M., Zorzato, F., Hall, M.N., Ruegg, M.A., 2008. Skeletal muscle-specific ablation of raptor, but not of rictor, causes metabolic changes and results in muscle dystrophy. Cell. Metab. 8, 411e424.
Bill, A., Sperber, G., Ujiie, K., 1983. Physiology of the choroidal vascular bed. Int. Ophthalmol. 6, 101e107.
Bownds, D., Gordon-Walker, A., Gaide-Huguenin, A.C., Robinson, W., 1971. Charac-terization and analysis of frog photoreceptor membranes. J. Gen. Physiol. 58, 225e237.
Busskamp, V., Krol, J., Nelidova, D., Daum, J., Szikra, T., Tsuda, B., Juttner, J., Farrow, K., Scherf, B.G., Alvarez, C.P., Genoud, C., Sothilingam, V., Tanimoto, N., Stadler, M., Seeliger, M., Stoffel, M., Filipowicz, W., Roska, B., 2014. miRNAs 182 and 183 are necessary to maintain adult cone photoreceptor outer segments and visual function. Neuron 83, 586e600.
Carter-Dawson, L.D., LaVail, M.M., Sidman, R.L., 1978. Differential effect of the rd mutation on rods and cones in the mouse retina. Invest. Ophthalmol. Vis. Sci. 17, 489e498.
Cepko, C.L., Austin, C.P., Yang, X., Alexiades, M., Ezzeddine, D., 1996. Cell fate determination in the vertebrate retina. Proc. Natl. Acad. Sci. U. S. A. 93, 589e595.
Chertov, A.O., Holzhausen, L., Kuok, I.T., Couron, D., Parker, E., Linton, J.D., Sadilek, M., Sweet, I.R., Hurley, J.B., 2011. Roles of glucose in photoreceptor survival. J. Biol. Chem. 286, 34700e34711.
Cloetta, D., Thomanetz, V., Baranek, C., Lustenberger, R.M., Lin, S., Oliveri, F., Atanasoski, S., Ruegg, M.A., 2013. Inactivation of mTORC1 in the developing brain causes microcephaly and affects gliogenesis. J. Neurosci. 33, 7799e7810.
Crouse, J.A., Lopes, V.S., Sanagustin, J.T., Keady, B.T., Williams, D.S., Pazour, G.J., 2014. Distinct functions for IFT140 and IFT20 in opsin transport. Cytoskeleton 71, 302e310.
Cybulski, N., Polak, P., Auwerx, J., Ruegg, M.A., Hall, M.N., 2009. mTOR complex 2 in adipose tissue negatively controls whole-body growth. Proc. Natl. Acad. Sci. U. S. A. 106, 9902e9907.
DeBerardinis, R.J., Lum, J.J., Hatzivassiliou, G., Thompson, C.B., 2008. The biology of cancer: metabolic reprogramming fuels cell growth and proliferation. Cell. Metab. 7, 11e20.
Dibble, C.C., Asara, J.M., Manning, B.D., 2009. Characterization of Rictor phosphor-ylation sites reveals direct regulation of mTOR complex 2 by S6K1. Mol. Cell. Biol. 29, 5657e5670.
Duvel, K., Yecies, J.L., Menon, S., Raman, P., Lipovsky, A.I., Souza, A.L., Triantafellow, E., Ma, Q., Gorski, R., Cleaver, S., Vander Heiden, M.G., MacKeigan, J.P., Finan, P.M., Clish, C.B., Murphy, L.O., Manning, B.D., 2010. Activation of a metabolic gene regulatory network downstream of mTOR complex 1. Mol. Cell. 39, 171e183.
Garcia-Martinez, J.M., Alessi, D.R., 2008. mTOR complex 2 (mTORC2) controls hy-drophobic motif phosphorylation and activation of serum- and glucocorticoid-induced protein kinase 1 (SGK1). Biochem. J. 416, 375e385.
Gu, H., Marth, J.D., Orban, P.C., Mossmann, H., Rajewsky, K., 1994. Deletion of a DNA polymerase beta gene segment in T cells using cell type-specific gene targeting. Science 265, 103e106.
Guertin, D.A., Stevens, D.M., Thoreen, C.C., Burds, A.A., Kalaany, N.Y., Moffat, J., Brown, M., Fitzgerald, K.J., Sabatini, D.M., 2006. Ablation in mice of the mTORC components raptor, rictor, or mLST8 reveals that mTORC2 is required for signaling to Akt-FOXO and PKCalpha, but not S6K1. Dev. Cell. 11, 859e871.
Huang, W., Zhu, P.J., Zhang, S., Zhou, H., Stoica, L., Galiano, M., Krnjevic, K., Roman, G., Costa-Mattioli, M., 2013. mTORC2 controls actin polymerization required for consolidation of long-term memory. Nat. Neurosci. 16, 441e448.
Ivanovic, I., Anderson, R.E., Le, Y.Z., Fliesler, S.J., Sherry, D.M., Rajala, R.V., 2011. Deletion of the p85alpha regulatory subunit of phosphoinositide 3-kinase in cone photoreceptor cells results in cone photoreceptor degeneration. Invest. Ophthalmol. Vis. Sci. 52, 3775e3783.
Jackson, G.R., Barber, A.J., 2010. Visual dysfunction associated with diabetic reti-nopathy. Curr. Diab. Rep. 10, 380e384.
Jeon, C.J., Strettoi, E., Masland, R.H., 1998. The major cell populations of the mouse retina. J. Neurosci. 18, 8936e8946.
Julien, L.A., Carriere, A., Moreau, J., Roux, P.P., 2010. mTORC1-activated S6K1 phos-phorylates Rictor on threonine 1135 and regulates mTORC2 signaling. Mol. Cell.
Biol. 30, 908e921.
Kellersch, B., Brocker, T., 2013. Langerhans cell homeostasis in mice is dependent on mTORC1 but not mTORC2 function. Blood 121, 298e307.
Kunchithapautham, K., Coughlin, B., Lemasters, J.J., Rohrer, B., 2011. Differential effects of rapamycin on rods and cones during light-induced stress in albino mice. Invest. Ophthalmol. Vis. Sci. 52, 2967e2975.
Lamming, D.W., Ye, L., Katajisto, P., Goncalves, M.D., Saitoh, M., Stevens, D.M., Davis, J.G., Salmon, A.B., Richardson, A., Ahima, R.S., Guertin, D.A., Sabatini, D.M., Baur, J.A., 2012. Rapamycin-induced insulin resistance is mediated by mTORC2 loss and uncoupled from longevity. Science 335, 1638e1643.
LaVail, M.M., Yasumura, D., Matthes, M.T., Lau-Villacorta, C., Unoki, K., Sung, C.H., Steinberg, R.H., 1998. Protection of mouse photoreceptors by survival factors in retinal degenerations. Invest. Ophthalmol. Vis. Sci. 39, 592e602.
Le, Y.Z., Ash, J.D., Al-Ubaidi, M.R., Chen, Y., Ma, J.X., Anderson, R.E., 2004. Targeted expression of Cre recombinase to cone photoreceptors in transgenic mice. Mol. Vis. 10, 1011e1018.
Leveillard, T., Mohand-Said, S., Lorentz, O., Hicks, D., Fintz, A.C., Clerin, E., Simonutti, M., Forster, V., Cavusoglu, N., Chalmel, F., Dolle, P., Poch, O., Lambrou, G., Sahel, J.A., 2004. Identification and characterization of rod-derived cone viability factor. Nat. Genet. 36, 755e759.
Li, L., Khan, N., Hurd, T., Ghosh, A.K., Cheng, C., Molday, R., Heckenlively, J.R., Swaroop, A., Khanna, H., 2013. Ablation of the X-linked retinitis pigmentosa 2 (Rp2) gene in mice results in opsin mislocalization and photoreceptor degen-eration. Invest. Ophthalmol. Vis. Sci. 54, 4503e4511.
Li, Y., Tao, W., Luo, L., Huang, D., Kauper, K., Stabila, P., Lavail, M.M., Laties, A.M., Wen, R., 2010. CNTF induces regeneration of cone outer segments in a rat model of retinal degeneration. PLoS One 5, e9495.
Lisman, J.E., Bering, H., 1977. Electrophysiological measurement of the number of rhodopsin molecules in single Limulus photoreceptors. J. Gen. Physiol. 70, 621e633.
Lowry, O.H., Rosebrough, N.J., Farr, A.L., Randall, R.J., 1951. Protein measurement with the Folin phenol reagent. J. Biol. Chem. 193, 265e275.
Madisen, L., Zwingman, T.A., Sunkin, S.M., Oh, S.W., Zariwala, H.A., Gu, H., Ng, L.L., Palmiter, R.D., Hawrylycz, M.J., Jones, A.R., Lein, E.S., Zeng, H., 2010. A robust and high-throughput Cre reporting and characterization system for the whole mouse brain. Nat. Neurosci. 13, 133e140.
Mattapallil, M.J., Wawrousek, E.F., Chan, C.C., Zhao, H., Roychoudhury, J., Ferguson, T.A., Caspi, R.R., 2012. The Rd8 mutation of the Crb1 gene is present in vendor lines of C57BL/6N mice and embryonic stem cells, and confounds ocular induced mutant phenotypes. Invest. Ophthalmol. Vis. Sci. 53, 2921e2927.
Mohand-Said, S., Deudon-Combe, A., Hicks, D., Simonutti, M., Forster, V., Fintz, A.C., Leveillard, T., Dreyfus, H., Sahel, J.A., 1998. Normal retina releases a diffusible factor stimulating cone survival in the retinal degeneration mouse. Proc. Natl. Acad. Sci. U. S. A. 95, 8357e8362.
Mohand-Said, S., Hicks, D., Dreyfus, H., Sahel, J.A., 2000. Selective transplantation of rods delays cone loss in a retinitis pigmentosa model. Arch. Ophthalmol. 118, 807e811.
Mohand-Said, S., Hicks, D., Simonutti, M., Tran-Minh, D., Deudon-Combe, A., Dreyfus, H., Silverman, M.S., Ogilvie, J.M., Tenkova, T., Sahel, J., 1997. Photore-ceptor transplants increase host cone survival in the retinal degeneration (rd) mouse. Ophthalmic Res. 29, 290e297.
Murray, J.T., Campbell, D.G., Morrice, N., Auld, G.C., Shpiro, N., Marquez, R., Peggie, M., Bain, J., Bloomberg, G.B., Grahammer, F., Lang, F., Wulff, P., Kuhl, D., Cohen, P., 2004. Exploitation of KESTREL to identify NDRG family members as physiological substrates for SGK1 and GSK3. Biochem. J. 384, 477e488.
Polak, P., Cybulski, N., Feige, J.N., Auwerx, J., Ruegg, M.A., Hall, M.N., 2008. Adipose-specific knockout of raptor results in lean mice with enhanced mitochondrial respiration. Cell. Metab. 8, 399e410.
Punzo, C., Kornacker, K., Cepko, C.L., 2009. Stimulation of the insulin/mTOR pathway delays cone death in a mouse model of retinitis pigmentosa. Nat. Neurosci. 12, 44e52.
Rajala, A., Dighe, R., Agbaga, M.P., Anderson, R.E., Rajala, R.V., 2013. Insulin receptor signaling in cones. J. Biol. Chem. 288, 19503e19515.
Rajala, A., Tanito, M., Le, Y.Z., Kahn, C.R., Rajala, R.V., 2008. Loss of neuroprotective survival signal in mice lacking insulin receptor gene in rod photoreceptor cells.
J. Biol. Chem. 283, 19781e19792.
Rajala, R.V., Tanito, M., Neel, B.G., Rajala, A., 2010. Enhanced retinal insulin receptor-activated neuroprotective survival signal in mice lacking the protein-tyrosine phosphatase-1B gene. J. Biol. Chem. 285, 8894e8904.
Rajala, R.V., Wiskur, B., Tanito, M., Callegan, M., Rajala, A., 2009. Diabetes reduces autophosphorylation of retinal insulin receptor and increases protein-tyrosine phosphatase-1B activity. Invest. Ophthalmol. Vis. Sci. 50, 1033e1040.
Reiter, C.E., Wu, X., Sandirasegarane, L., Nakamura, M., Gilbert, K.A., Singh, R.S., Fort, P.E., Antonetti, D.A., Gardner, T.W., 2006. Diabetes reduces basal retinal insulin receptor signaling: reversal with systemic and local insulin. Diabetes 55, 1148e1156.
Robida-Stubbs, S., Glover-Cutter, K., Lamming, D.W., Mizunuma, M., Narasimhan, S.D., Neumann-Haefelin, E., Sabatini, D.M., Blackwell, T.K., 2012. TOR signaling and rapamycin influence longevity by regulating SKN-1/Nrf and DAF-16/FoxO. Cell. Metab. 15, 713e724.
Romanino, K., Mazelin, L., Albert, V., Conjard-Duplany, A., Lin, S., Bentzinger, C.F., Handschin, C., Puigserver, P., Zorzato, F., Schaeffer, L., Gangloff, Y.G., Ruegg, M.A., 2011. Myopathy caused by mammalian target of rapamycin complex 1 (mTORC1) inactivation is not reversed by restoring mitochondrial function. Proc. Natl. Acad. Sci. U. S. A. 108, 20808e20813.
Sarbassov, D.D., Ali, S.M., Sengupta, S., Sheen, J.H., Hsu, P.P., Bagley, A.F., Markhard, A.L., Sabatini, D.M., 2006. Prolonged rapamycin treatment inhibits mTORC2 assembly and Akt/PKB. Mol. Cell. 22, 159e168.
Scott, B.L., Racz, E., Lolley, R.N., Bazan, N.G., 1988. Developing rod photoreceptors from normal and mutant Rd mouse retinas: altered fatty acid composition early in development of the mutant. J. Neurosci. Res. 20, 202e211.
Shende, P., Plaisance, I., Morandi, C., Pellieux, C., Berthonneche, C., Zorzato, F., Krishnan, J., Lerch, R., Hall, M.N., Ruegg, M.A., Pedrazzini, T., Brink, M., 2011. Cardiac raptor ablation impairs adaptive hypertrophy, alters metabolic gene expression, and causes heart failure in mice. Circulation 123, 1073e1082.
Steinberg, R.H., 1994. Survival factors in retinal degenerations. Curr. Opin. Neuro-biol. 4, 515e524.
Streichert, L.C., Birnbach, C.D., Reh, T.A., 1999. A diffusible factor from normal retinal cells promotes rod photoreceptor survival in an in vitro model of retinitis pigmentosa. J. Neurobiol. 39, 475e490.
Thomanetz, V., Angliker, N., Cloetta, D., Lustenberger, R.M., Schweighauser, M., Oliveri, F., Suzuki, N., Ruegg, M.A., 2013. Ablation of the mTORC2 component rictor in brain or Purkinje cells affects size and neuron morphology. J. Cell. Biol. 201, 293e308.
Treins, C., Warne, P.H., Magnuson, M.A., Pende, M., Downward, J., 2010. Rictor is a novel target of p70 S6 kinase-1. Oncogene 29, 1003e1016.
Vander Heiden, M.G., Cantley, L.C., Thompson, C.B., 2009. Understanding the War-burg effect: the metabolic requirements of cell proliferation. Science 324, 1029e1033.
Venkatesh, A., Ma, S., Langellotto, F., Gao, G., Punzo, C., 2013. Retinal gene delivery by rAAV and DNA electroporation. Curr. Protoc. Microbiol. Chapter 14. Unit14D 14.
Venkatesh, A., Ma, S., Le, Y.Z., Hall, M.N., Ruegg, M.A., Punzo, C., 2015. Activated mTORC1 promotes long-term cone survival in retinitis pigmentosa mice. J. Clin. Invest. 125, 1446e1458.
Whikehart, D.R., 2003. Biochemistry of the Eye, second ed.
Winkler, B.S., Pourcho, R.G., Starnes, C., Slocum, J., Slocum, N., 2003. Metabolic mapping in mammalian retina: a biochemical and 3H-2-deoxyglucose autora-diographic study. Exp. Eye Res. 77, 327e337.
Winkler, B.S., Starnes, C.A., Sauer, M.W., Firouzgan, Z., Chen, S.C., 2004. Cultured retinal neuronal cells and Muller cells both show net production of lactate. Neurochem. Int. 45, 311e320.
Ye, L., Varamini, B., Lamming, D.W., Sabatini, D.M., Baur, J.A., 2012. Rapamycin has a biphasic effect on insulin sensitivity in C2C12 myotubes due to sequential disruption of mTORC1 and mTORC2. Front. Genet. 3, 177.
Young, R.W., 1971. The renewal of rod and cone outer segments in the rhesus monkey. J. Cell. Biol. 49, 303e318.
Zoncu, R., Efeyan, A., Sabatini, D.M., 2011. mTOR: from growth signal integration to cancer, diabetes and ageing. Nat. Rev. Mol. Cell. Biol. 12, 21e35.