Supreme
Industries’
(SIL)
Q1FY16
(June
year
end)
sales,
EBITDA
and
PAT
at
INR7.7bn,
INR0.9bn
and
INR0.25bn
belied
our
INR8.3bn,
INR1.0bn
and
INR0.43bn
estimates,
respectively,
primarily
on
account
of
inventory
loss
and
lower
‐
than
‐
expected
realization.
Key
positives
were:
(1)
robust
volume
growth
of
16.5%
YoY;
(2)
all
segments
clocked
strong
growth,
except
industrial;
(3)
gross
debt
fell
INR3bn
YoY;
and
(4)
composite
cylinder
&
bathroom
fittings
business
remained
on
track.
Supreme
Petrochem
was
impacted
by
inventory
loss,
a
key
negative.
SIL
expects
to
achieve
volume
growth
of
15
‐
18%
YoY
(earlier
14
‐
16%)
along
with
EBITDA
margin
of
13.5
‐
14.5%
in
FY16.
SIL
indicated
that
raw
material
prices
corrected
during
September
quarter
and
expects
them
to
be
range
bound
in
the
near
term.
We
believe,
focus
on
branded
business
bolstered
by
consistent
product
innovations
and
capacity
expansion
across
segments
will
fuel
the
company’s
growth
going
ahead.
We
anticipate
it
to
be
key
beneficiary
of
improvement
in
domestic
macros.
Maintain
‘BUY’.
Volumes
surge;
lower
interest
drives
PAT
Net sales grew 1.7% YoY to INR7.7bn with volume growth of 16.5% YoY during the
quarter. However, realisation dipped on account of passing on of benefits of falling
raw material prices. EBITDA margin jumped 100bps YoY to 11.7% (estimate 12.7%) on
account of declining raw material prices, despite being impacted by inventory loss (not
quantifiable). Interest cost dipped 28.7% YoY (down 9.1% QoQ) due to lower debt
riding reduced inventory level led by correction in raw material prices. Adjusted PAT
declined 2.1% YoY to INR0.25bn. Supreme Petrochem contributed loss of INR74mn
during Q1FY16 on account of inventory loss of INR0.17bn.
Outlook
and
valuations:
Fundamentals
intact;
maintain
‘BUY’
FY14/15 was an abnormal year for SIL with multiple adverse factors impacting it. We
anticipate better business climate in FY16/17. The company is scaling the growth path
led by new business initiatives and consistent product innovations. We maintain ‘BUY’
with target price of INR760 (20x FY17E EPS) with the company’s holding in Supreme
Petrochem at INR21/share and giving 30% holding discount to its share (29.9%) in SPL.
The stock is trading at 17.3xFY17E EPS.
SUPREME
INDUSTRIES
Sustained
volume
spurt
EDELWEISS RATINGS
Absolute Rating BUY
Investment Characteristics Growth
MARKET DATA (R: SUPI.BO, B: SI IN)
CMP : INR 638 Target Price : INR 760 52‐week range (INR) : 747 / 540 Share in issue (mn) : 127.0 M cap (INR bn/USD mn) : 81 / 1,219 Avg. Daily Vol. BSE/NSE (‘000) : 83.3
SHARE HOLDING PATTERN (%)
Current Q1FY16 Q4FY15
Promoters * 49.7 49.7 49.7 MF's, FI's & BKs 7.4 6.4 6.5 FII's 21.2 22.3 21.5 Others 21.7 21.7 22.3
* Promoters pledged shares (% of share in issue) : NIL PRICE PERFORMANCE (%) BSE Midcap Index Stock Stock over Index 1 month 4.6 4.8 0.2 3 months (0.6) (0.7) (0.1) 12 months 20.7 3.2 (17.5) Manish Mahawar +91 22 6623 3481 [email protected]
In
di
a
M
id
India Equity Research| Miscellaneous
October 29, 2015
Financials (INR mn)
Year to June Q1FY16 Q1FY15 % change Q4FY15 % change FY15 FY16E* FY17E
Net revenues 7,728 7,596 1.7 12,544 (38.4) 41,159 32,304 55,516
EBITDA 908 814 11.5 2,412 (62.4) 5,642 4,620 8,327
Adjusted Net Profit 245 251 (2.1) 1,488 (83.5) 3,224 2,469 4,680
EPS (INR) 1.9 2.0 (2.1) 11.7 (83.5) 25.4 19.4 36.8
Diluted P/E (x) 25.1 NA 17.3
EV/EBITDA (x) 14.7 NA 9.7
ROAE (%) 28.6 19.4 31.4
Q1FY16
conference
call:
Key
highlights
Business outlook: During FY16, SIL expects to achieve volume growth of 15‐18% YoY
with EBITDA of 13.5‐14.5%. Management indicated the there was decline in the raw
material prices.
Value‐added products: The share of value‐added products, as percentage of revenue,
stood at 32.3% in Q1FY16 versus 29.2% in Q1FY15. The Company’s focus remains to
increase the share of value added products in its turnover.
Revenue growth: Net sales grew 1.7% YoY led by 13.9% and 14.8% growth in piping,
and consumer segments respectively with a decline of 0.3% and 11.7% in packing and
industrial business. Overall volumes jumped 16.5% YoY led by piping (25.9%), packaging
(3.9%) and Consumer (10.3%).
Operating margin: For Q1FY16, SIL reported operating margin of 13.5%, 15.5%, 9.7%
and 11.2% versus 12.6%, 13.1%, 9.3% and 7.84% in Q1FY15 in piping, packaging,
industrial and consumer businesses, respectively.
Raw Material: Management indicated that cost of raw materials witnessed decreasing
trend owing to declining crude oil. Overall, the raw material prices are expected to
remain in range bound in near term. SIL incurred Inventory loss on account of falling
raw material prices. Management indicated that further inventory loss is expected in
FY16. However, it is beneficial for business in terms of lower cost and working capital. CPVC: Volume grew 32% YoY to 2,712MT in Q1FY16 versus 2,054MT in Q1FY15. Sales
stood at INR742mn during Q1FY16 versus INR557mn in Q1FY15. Management expects
a volume growth of 20% for FY16. It highlighted that unorganized players have lost the
market share during the quarter.
CVPC fire sprinkler system: The company has received its first export order of USD
55,000 of CVPC Fire Sprinkler System “Flameguard” and the management expects the
product to fare well in mere future.
Silpaulin: Volume stood at 1,951MT in Q1FY16 versus 1,945MT in Q1FY15. Revenues
stood at INR497mn during Q1FY16 versus INR466mn in Q1FY15.
Construction business: As on 30th September, 2015, the company has 63,848 sq. feet
area for sale.
Industrial segment: Industrial segment witnessed a tough period with de‐growth of
1.8% in volume and 11.7% in revenue YoY, respectively. Material handling business
grew 7 % YoY in volume and declined 2% YoY in value. Components (automobile and
non automobile) business declined 14% and 6% in volume and value, respectively. Industrial promotion subsidy: The company received subsidy of INR13mn during
Q1FY16 versus INR60mn in Q1FY15. The subsidy entitlement related to the Gadegaon
plant ceased by January FY15 which led to a sharp reduction in subsidy.
Composite cylinder: SIL expects the government refineries to place an educational
order of 8,000‐12,000 pieces during November, 2015. Company expects to supply 5,000
pieces to South Korea during November‐December, 2015. The company is also involved
in active discussion with three countries for their requirement of LPG Cylinders. SIL is
optimistic about its product and its potential.
Capex: Management highlighted that it will incur a CAPEX of INR2bn for FY16. Its new
Malanpur have commenced, but the Commercial production is going to begin during
November, 2015. The management plans to start the packing and plastic piping
production at the Kharagpur plant in November, 2015 and CVPC and Water tank
production in March‐April, 2017.
Debt: The gross debt and net debt as on 30th September, 2016 was INR4.7bn and INR
3.5bn, respectively, versus INR 7.7bn and INR 6bn as on 30th September, 2015. Further
the average cost of capital for the company stood at 8.9% in Q1FY16 versus 8.8% in
Q1FY15.
Supreme Petrochem: SIL volume grew 22% YoY in Q1FY16. Management expects
volume growth of 17‐18% during FY16 (9months).
Q4FY15
conference
call:
Key
highlights
Business outlook: During FY16, SIL expects to achieve volume growth of 14‐16% YoY
with EBITDA of 13.5‐14.0%. Management indicated the there was extreme volatility in
polymer prices in FY15 (June ended). The volatility affected consumption of plastic in
India. Polymer consumption grew at around 8% between July 2014 and June 2015. The
company also believes that during 2015‐16 volatility will not be repeated.
Value‐added products: The share of value‐added products, as percentage of revenue,
stood at 34.2% in FY15 versus 32.3% in FY14. It stood at 34.75% in Q4FY15 versus
31.75% in Q4FY14.
Revenue growth: Net sales grew 5.5% YoY led by 3%, 13%, 8%, 7% growth in piping,
packaging, industrial and consumer segments, respectively. Overall volumes jumped
9.6% YoY led by consumer (5%), packaging (14%), industrial (11%) and piping (9%). Operating margin: For Q4FY15, SIL reported operating margin of 18%, 27%, 16% and
21% in piping, packaging, industrial and consumer businesses, respectively.
CPVC: Volume stood at 4,162MT in Q4FY15 versus 3,190MT in Q4FY14. Sales stood at
INR1,090mn during Q4FY16 versus INR840mn in Q4FY14.
Silpaulin: Volume stood at 5,861MT in Q4FY15 versus 5,201MT in Q4FY14. Revenues
stood at INR1,480mn during Q4FY15 versus INR1,260mn in Q4FY14. For FY15, revenue
stood at INR4,530mn, whereas volumes stood at 19,283MT.
Depreciation: The company has provided a higher depreciation of INR280.4mn during
the year in compliance with Companies Act 2013.
Construction business: During Q4FY15, SIL realised INR336.5mn from sale of 12,540 sq
ft, whereas it realised INR1,393.2mn from the sale of 81,831 sq ft during FY15.
Remaining area available for sale is 53,800 sq ft.
Industrial promotion subsidy: The company received subsidy of INR36.5mn during
Q4FY15 and INR253mn in FY15 (INR177mn in Q4FY14 and INR 469.4mn in FY14). The
subsidy entitlement related to the Gadegaon plant ceased by January FY15 which led to
a sharp reduction in subsidy.
Composite cylinder: The company got approval from Korean Gas Safety Corporation for
2 sizes of 12.5litre and 30.5litre. SIL is optimistic about the product and its potential.
Government refineries have floated an execution order in 2 sizes of cylinders of
12.5litre and 24litre. The company has got special approval for the same . SIL will
participate in these sizes and expects a positive outcome. It expects some more time
Capex: SIL incurred capex expenditure of INR1.97bn during FY15. Further the company
plans to incur INR2bn for FY16. Its new plastic product complex at Kharagpur in West
Bengal is likely to commence production during the current year and the roto molding
unit at Malanpur is likely to be operational during FY16. SIL is introducing several
varieties of molded fittings at Jalgaon and Malanpur plants. It is also constructing a
new building and installing special machine for making varieties of cross laminated film
at Gujarat plant.
Supreme Petrochem: SIL’s share of profit in Supreme Petrochem for Q4FY15 stood at
INR 198mn. Management highlighted that 50% of profits were from inventory gains.
The company started achieving positive volume growth compared to FY12‐13 and FY13‐
14. SIL believes that Supreme Petrochem will require no new investment and will
become a debt free company. It expects to maintain operating margin of 7% for the
coming year.
Table 1: Segmentwise volume breakup
Table 2: Segmentwise volume growth (YoY)
Table 3: Segment revenue
Table 4: Segmentwise Revenue growth (YoY)
Table 5: Segmentwise Realization per unit
Source: Company, Edelweiss research
(MT) Q1FY14 Q2FY14 Q3FY14 Q4FY14 Q1FY15 Q2FY15 Q3FY15 Q4FY15 Q1FY16
Piping 32,337 42,388 50,521 62,705 30,086 47,675 59,714 66,789 37,867 Industrial 7,486 7,747 9,603 8,784 8,519 8,736 10,919 13,131 8,360 Packaging 6,915 12,125 8,556 11,120 7,482 12,836 10,648 9,296 7,771 Consumer 3,240 4,058 3,669 4,209 2,926 3,797 4,432 4,828 3,228
(%) Q1FY14 Q2FY14 Q3FY14 Q4FY14 Q1FY15 Q2FY15 Q3FY15 Q4FY15 Q1FY16
Piping 6.9 3.5 6.4 18.1 (7.0) 12.5 18.2 6.5 25.9 Industrial (12.7) (25.3) (13.6) (16.9) 13.8 12.8 13.7 49.5 (1.9) Packaging (6.4) 16.4 (21.9) 5.1 8.2 5.9 24.5 (16.4) 3.9 Consumer (8.4) (16.5) (25.8) (23.0) (9.7) (6.4) 20.8 14.7 10.3
(Mn) Q1FY14 Q2FY14 Q3FY14 Q4FY14 Q1FY15 Q2FY15 Q3FY15 Q4FY15 Q1FY16
Piping 3,670 4,570 5,420 6,940 3,520 4,920 5,670 7,020 4,015
Industrial 1,290 1,340 1,670 1,550 1,590 1,580 1,770 2,690 1,404
Packaging 1,240 2,470 1,960 2,390 1,590 2,670 2,170 1,540 1,585
Consumer 500 580 630 780 510 660 730 860 581
(%) Q1FY14 Q2FY14 Q3FY14 Q4FY14 Q1FY15 Q2FY15 Q3FY15 Q4FY15 Q1FY16
Piping 22.3 19.0 15.8 28.5 (4.2) 7.7 4.6 1.2 14.1 Industrial ‐ (12.4) (4.0) 6.2 23.1 17.9 6.0 73.5 (11.6) Packaging (0.8) 26.0 9.5 16.6 28.5 8.1 10.7 (35.6) (0.6) Consumer ‐ (15.9) (10.0) (10.3) 1.2 13.8 15.9 10.3 14.8
(INR) Q1FY14 Q2FY14 Q3FY14 Q4FY14 Q1FY15 Q2FY15 Q3FY15 Q4FY15 Q1FY16
Piping 113.5 107.8 107.3 110.7 116.9 103.2 95.0 105.1 106.0 Industrial 172.3 173.0 173.9 176.5 186.4 180.9 162.1 204.9 167.9 Packaging 179.3 203.7 229.1 214.9 213.0 208.0 203.8 165.7 203.9 Consumer 154.3 142.9 171.7 185.3 173.0 173.8 164.7 178.1 180.0
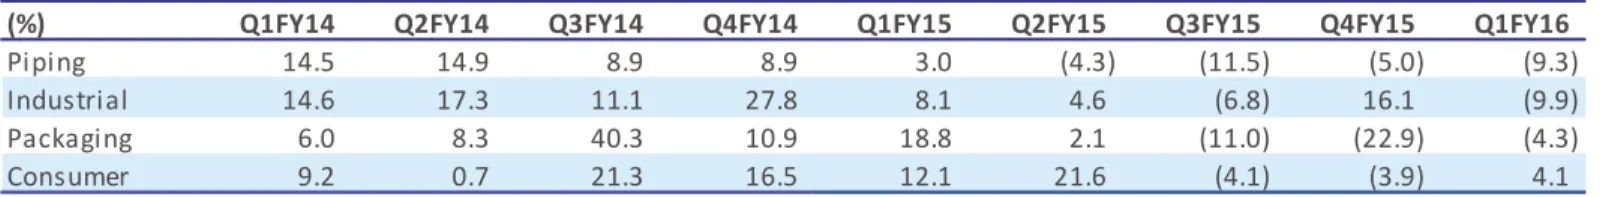
Table 6: Segmentwise Realization per unit growth (%)
Source: Company, Edelweiss research
(%) Q1FY14 Q2FY14 Q3FY14 Q4FY14 Q1FY15 Q2FY15 Q3FY15 Q4FY15 Q1FY16
Piping 14.5 14.9 8.9 8.9 3.0 (4.3) (11.5) (5.0) (9.3) Industrial 14.6 17.3 11.1 27.8 8.1 4.6 (6.8) 16.1 (9.9) Packaging 6.0 8.3 40.3 10.9 18.8 2.1 (11.0) (22.9) (4.3) Consumer 9.2 0.7 21.3 16.5 12.1 21.6 (4.1) (3.9) 4.1
Financial snapshot (INR mn)
Year to March Q1FY16 Q1FY15 % change Q4FY15 % change FY15 FY16E* FY17E
Net revenues 7,728 7,596 1.7 12,544 (38.4) 41,159 32,304 55,516 Raw material 4,941 5,113 (3.4) 8,202 (39.8) 28,666 22,355 38,306 Staff costs 422 366 15.3 527 (19.9) 1,685 1,292 2,054 Other expenses 1,457 1,303 11.9 1,404 3.8 5,165 4,038 6,828 Total expenditure 6,820 6,781 0.6 10,132 (32.7) 35,516 27,685 47,188 EBITDA 908 814 11.5 2,412 (62.4) 5,642 4,620 8,327 Depreciation 335 348 (3.9) 355 (5.8) 1,390 1,094 1,608 EBIT 573 466 23.0 2,057 (72.1) 4,253 3,526 6,719 Other income 15 4 300.5 9 62.5 1,044 320 440 Interest 99 139 (28.2) 109 (9.1) 579 324 377
Add: Prior period items
Profit before tax 489 331 47.6 1,957 (75.0) 4,718 3,522 6,782
Provision for taxes 169 113 50.2 659 (74.3) 1,600 1,162 2,238
Minority interest
Associate profit share (74) 32 NA 190 NA 106 109 136
Profit‐ Discontinued Ops
Exceptional Items ‐ ‐ 110 (100.0) ‐ ‐ ‐
Reported net profit 245 251 (2.1) 1,598 (84.6) 3,224 2,469 4,680
Adjusted Profit 245 251 (2.1) 1,488 (83.5) 3,224 2,469 4,680
Equity capital(FV INR10) 254 254 254 254 254 ‐
Diluted shares (mn) 127 127 127 127 127 127
Adjusted Diluted EPS 1.9 2.0 11.7 25.4 19.4 36.8
Diluted P/E (x) ‐ ‐ ‐ 25.8 ‐ 17.8 EV/EBITDA (x) ‐ ‐ ‐ 14.7 ‐ 9.7 ROAE (%) ‐ ‐ ‐ 28.6 19.4 31.4 As % of net revenues Raw material 63.9 67.3 65.4 69.6 69.2 69.0 Employee cost 5.5 4.8 4.2 4.1 4.0 3.7 Other expenses 18.9 17.1 11.2 12.5 12.5 12.3 EBITDA 11.7 10.7 19.2 13.7 14.3 15.0
Reported net profit 3.2 3.3 11.9 7.8 7.6 8.4
Company
Description
SIL is one of the most prominent plastic manufacturing companies in India, having over 44
years of experience under the current management. It has been consistently increasing
capacity in the plastics processing and has more than 7000 diversified products. It processes
over 0.2 mn metric tonnes of plastic per annum, and has 19 manufacturing locations across
India.
The company’s core operations involve processing polymers and resins into diversified
plastic products spread under four broad categories: industrial products, consumer
products, piping products and packaging products. Over the years, SIL has managed to gain
a significant market share across its product portfolio. It is credited with pioneering various
products including Cross‐ Laminated Films, HMHD Films, Multilayer Films, SWR Piping
Systems, PP Mats etc. The company currently has around 1200 distributors of which 600
distributors are for PVC Pipes, 400 for furniture, 60 for cross laminated films and 140
accounting for others
Investment
Theme
Supreme industries, the largest private plastic processing player in India, is poised to be the
biggest beneficiary of shift from metals to plastic and higher GDP growth of India. Supreme
has detailed a road map that will entail deployment of a sizeable capex of INR 10bn over by
2014‐15. Post the capex, the installed capacity would expand from 3,49,700 MT pa in FY12
to 5,49,500 MT pa by FY15‐16, marking a CAGR increase of 9.5%.
The company has a strong balance sheet with the debt to equity at 0.4x in FY14. SIL has
strong operating and free cash flows to fund its capex from internal accruals – a great
comfort factor. Moreover the company’s net working capital cycle stands at around 20‐30
days, one the best in the industry as it gives cash discounts to customers on early payments
as well as imports raw materials against which it gets a higher credit period. It also has
strong return ratios with ROCE at 39% and ROE at 28.6% for FY15. Shareholders have been
consistently rewarded with its liberal dividend policy (distributing ~30% of its profits as
dividend).
Key
Risks
The plastic industry is highly fragmented with unorganized players accounting for 60% of the
output and posing a stiff competition to SIL .
Sharp increase in raw material prices of PVC,LDPE,HDPE and delays in passing on the same.
The company has an asset heavy model hence needs to invest continuously in the business
to sustain growth. Any delay in expansion plans can affect the turnover of the business as
the same has been factored in our model.
Unavailability of skilled labour might hurt the capacity utilization of one or many plants
thereby affecting the turnover and performance.
The plastic industry has been growing in range of 1.8x‐2x GDP growth rate of India.Hence
any slowdown in GDP growth of the country might affect the topline of the company.
Financial
Statements
Income statement (INR mn)
Year to March FY14 FY15 FY16E* FY17E
Net revenue 39,020 41,159 32,304 55,516 Materials costs 27,284 28,666 22,355 38,306 Gross profit 11,736 12,493 9,950 17,210 Employee costs 1,440 1,685 1,292 2,054 Other Expenses 4,802 5,165 4,038 6,828 Total operating expenses 33,526 35,516 27,685 47,188 EBITDA 5,494 5,642 4,620 8,327 Depreciation 1,015 1,390 1,094 1,608 EBIT 4,479 4,253 3,526 6,719 Add: Other income 426 1,044 320 440 Less: Interest Expense 761 579 324 377 Profit Before Tax 4,143 4,718 3,522 6,782 Less: Provision for Tax 1,399 1,600 1,162 2,238 Associate profit share 91 106 109 136 Reported Profit 2,835 3,224 2,469 4,680 Adjusted Profit 2,835 3,224 2,469 4,680 Shares o /s (mn) 127 127 127 127 Adjusted Basic EPS 22.3 25.4 19.4 36.8 Diluted shares o/s (mn) 127 127 127 127 Adjusted Diluted EPS 22.3 25.4 19.4 36.8 Adjusted Cash EPS 32.4 34.9 28.0 49.5 Dividend per share (DPS) 8.0 9.0 8.0 9.0 Dividend Payout Ratio(%) 41.9 42.6 48.2 28.6
Common size metrics
Year to March FY14 FY15 FY16E* FY17E
Operating expenses 16.0 16.6 16.5 16.0 Cost of goods sold 69.9 69.6 69.2 69.0 Depreciation 2.6 3.4 3.4 2.9 EBITDA margins 14.1 13.7 14.3 15.0 Net Profit margins 7.3 7.8 7.6 8.4 Growth ratios (%)
Year to March FY14 FY15 FY16E* FY17E
Revenues 15.2 5.5 NA NA
EBITDA 4.5 2.7 NA NA
Adjusted Profit (2.3) 13.7 NA NA
EPS (2.3) 13.7 NA NA
*FY16E: July 01, 2015 to March 31, 2016
Key Assumptions
Year to March FY14 FY15 FY16E* FY17E
Macro GDP(Y‐o‐Y %) 6.9 7.4 8.0 8.7 Inflation (Avg) 9.5 6.7 5.0 5.0 Repo rate (exit rate) 8.0 7.5 6.8 6.5 USD/INR (Avg) 60.5 61.2 64.5 65.0 Company
Segment wise rev growth%
Industrial (3.6) 30.4 (25.7) 55.2 Consumer (9.8) 10.8 (15.6) 88.7 Packging 15.1 (1.1) (14.0) 66.0 Pipes 21.8 2.6 (27.1) 84.8 Industrial Products 5,850 7,630 5,672 8,804 Consumer Products 2,490 2,760 2,330 4,399 Packaging Products 8,060 7,970 6,856 11,384 Plastic Piping 20,600 21,130 15,394 28,446 Margins % Industrial Products 11.0 12.1 11.5 13.5 Consumer Products 11.0 14.8 11.5 12.5 Packaging Products 19.0 18.5 19.0 20.0 Plastic Piping 14.0 13.3 12.0 14.0 Financial assumptions Avg. Interest rate (%) 16.2 13.4 11.0 11.0 Depreciation rate (%) 6.0 7.7 7.5 7.5 Tax rate (%) 33.8 33.9 33.0 33.0 Capex (INR mn) 1,471 907 2,000 2,000 Debtor days 20 21 27 18 Inventory days 65 61 85 62 Payable days 42 37 53 37 Cash conversion cycle 43 45 59 43
Peer comparison valuation
Market cap Diluted P/E (X) EV / EBITDA (X) ROAE (%)
Name (USD mn) FY16E FY17E FY16E FY17E FY16E FY17E
Supreme Industries 1,219 32.8 17.3 17.9 9.7 19.4 31.4
Sintex Industries Ltd 701 7.7 6.0 6.2 5.1 11.5 12.9
Median ‐ 20.2 11.7 12.1 7.4 15.4 22.2
AVERAGE ‐ 20.2 11.7 12.1 7.4 15.4 22.2
Source: Edelweiss research
Cash flow metrics
Year to March FY14 FY15 FY16E* FY17E
Operating cash flow 3,351 6,008 3,167 5,259 Investing cash flow (1,337) (1,860) (1,131) (2,093) Financing cash flow (1,903) (2,567) (1,513) (2,715) Net cash Flow 111 1,581 523 451 Capex (1,445) (1,936) (1,131) (2,093) Dividend paid (1,115) (1,197) (1,189) (1,338)
Profitability and efficiency ratios
Year to March FY14 FY15 FY16E* FY17E
ROAE (%) 29.6 28.6 19.4 31.4 ROACE (%) 34.3 34.0 23.1 39.1 ROA 18.4 19.3 14.0 24.2 Interest Coverage Ratio 5.9 7.3 10.9 17.8 Debt / Cap employed (%) 68.8 66.5 66.0 60.2 Operating ratios
Year to March FY14 FY15 FY16E* FY17E
Total Asset Turnover 2.5 2.5 1.8 2.9 Fixed Asset Turnover 3.6 4.0 2.9 4.8
Equity Turnover 8.1 7.3 5.1 7.5
Du pont analysis
Year to March FY14 FY15 FY16E* FY17E
Net Profit Margin 7.3 7.8 7.6 8.4 Total Asset Turnover 2.5 2.5 1.8 2.9 Leverage Multiplier 1.6 1.5 1.4 1.3 ROAE (%) 29.6 28.6 19.4 31.4 Valuation parameters
Year to March FY14 FY15 FY16E* FY17E
Adj. Diluted EPS (INR) 22.3 25.4 19.4 36.8 Y‐o‐Y growth (%) (2.3) 13.7 (23.4) 89.6 Adjusted Cash EPS (INR) 32.4 34.9 28.0 49.5 Diluted P/E (x) 28.6 25.1 32.8 17.3 P/B (x) 7.8 6.7 6.1 4.9 EV / Sales (x) 2.2 2.0 2.6 1.5 EV / EBITDA (x) 15.6 14.7 17.9 9.7 Dividend Yield (%) 1.3 1.4 1.3 1.4
*FY16E: July 01, 2015 to March 31, 2016
Balance sheet (INR mn)
As on 31st March FY14 FY15 FY16E* FY17E
Share capital 254 254 254 254 Reserves & Surplus 10,138 11,861 13,031 16,238 Shareholders' funds 10,392 12,115 13,286 16,492 Short term borrowings 2,053 1,599 1,599 1,099 Long term borrowings 2,646 2,329 2,329 1,829 Total Borrowings 4,699 3,929 3,929 2,929 Long Term Liabilities 111 115 127 139 Def. Tax Liability (net) 1,168 895 895 895 Sources of funds 16,370 17,054 18,236 20,455 Gross Block 17,538 18,445 20,445 22,445 Net Block 10,820 10,151 11,058 11,449 Capital work in progress 181 998 129 222 Intangible Assets 59 174 174 174 Total Fixed Assets 11,060 11,323 11,360 11,845 Non current investments 1,074 1,207 1,207 1,207 Cash and Equivalents 246 1,817 2,340 2,792 Inventories 4,976 4,647 5,716 7,346 Sundry Debtors 2,348 2,380 2,407 3,103 Loans & Advances 2,045 2,179 2,397 2,637 Other Current Assets 18 16 18 19 Current Assets (ex cash) 9,387 9,222 10,539 13,106 Trade payable 2,777 3,004 3,430 4,408 Other Current Liab 2,620 3,512 3,781 4,087 Total Current Liab 5,397 6,517 7,211 8,495 Net Curr Assets‐ex cash 3,990 2,705 3,327 4,611 Uses of funds 16,370 17,054 18,236 20,455 BVPS (INR) 81.8 95.4 104.6 129.8
Free cash flow (INR mn)
Year to March FY14 FY15 FY16E* FY17E
Reported Profit 2,835 3,224 2,469 4,680 Add: Depreciation 1,015 1,390 1,094 1,608 Interest (Net of Tax) 510 388 217 253 Others 390 241 (2) (12) Less: Changes in WC 1,400 (765) 611 1,270 Operating cash flow 3,351 6,008 3,167 5,259 Less: Capex 1,445 1,936 1,131 2,093
Free Cash Flow 1,906 4,072 2,036 3,166
Holding Top ‐10
Perc. Holding Perc. Holding
Nalanda India Fund Ltd 6.44 DSP Black Rock investment Manager 0.95
HDFC Asset Management 3.02 Schroder Investment Mgt Ltd 0.81
Cartica Capital 2.77 William Blair 0.45
Mattews International Capital 2.46 Dimensional Fund Advisors LP 0.45
SBI Funds Management 2.13 Kotak Mahindra 0.43
*as per last available data
Insider Trades
Reporting Data Acquired / Seller B/S Qty Traded
16 Feb 2015 Space Age Chemplast Private Limited Buy 30000.00
*as per last available data
Bulk Deals
Data Acquired / Seller B/S Qty Traded Price
No Data Available
*as per last available data
Additional
Data
Directors Data
B. L. Taparia Chairman M. P. Taparia Managing Director
S. J. Taparia Executive Director V. K. Taparia Executive Director
B. V. Bhargava Director H. S. Parikh Director
N. N. Khandwala Director S. R. Taparia Director
Y. P. Trivedi Director
Auditors ‐ M/s. Chhogmal & Co.,
`
Edelweiss Securities Limited, Edelweiss House, off C.S.T. Road, Kalina, Mumbai – 400 098.
Board: (91‐22) 4009 4400, Email: [email protected]
Nirav Sheth
Head Research
Coverage group(s) of stocks by primary analyst(s): Miscellaneous
Agro Tech Foods, Bayer Cropscience, CCL Products India, Dhanuka Agritech, Jain Irrigation, PI Industries, Rallis India, Supreme Industries, Solar Industries, UPL.
Distribution of Ratings / Market Cap Edelweiss Research Coverage Universe
Rating Distribution* 155 45 8 208
* stocks under review
Market Cap (INR) 151 54 3
> 50bn Between 10bn and 50 bn < 10bn
Date Company Title Price (INR) Recos
Buy Hold Reduce Total
Recent Research
29‐Oct‐15 PI Industries Holding ground in a challenging environment;
Result Update
647 Hold
27‐Oct‐15 Rallis India Trouble piles up;
Result Update
207 Hold 26‐Oct‐15 UPL Commendable show in tough
times; Result Update 448 Buy Rating Interpretation Buy appreciate more than 15% over a 12‐month period Hold appreciate up to 15% over a 12‐month period Reduce depreciate more than 5% over a 12‐month period Rating Expected to
One year price chart
458 542 626 711 795 879 Oc t ‐ 14 No v ‐ 14 De c ‐ 14 Ja n ‐ 15 Fe b ‐ 15 Ma r ‐ 15 Ap r ‐ 15 Ma y ‐ 15 Ju n ‐ 15 Ju l ‐ 15 Au g ‐ 15 Se p ‐ 15 (I N R ) Supreme Industries
DISCLAIMER
Edelweiss Securities Limited (“ESL” or “Research Entity”) is regulated by the Securities and Exchange Board of India (“SEBI”) and is
licensed to carry on the business of broking, depository services and related activities. The business of ESL and its Associates (list
available on www.edelweissfin.com) are organized around five broad business groups – Credit including Housing and SME
Finance, Commodities, Financial Markets, Asset Management and Life Insurance.
This Report has been prepared by Edelweiss Securities Limited in the capacity of a Research Analyst having SEBI Registration
No.INH200000121 and distributed as per SEBI (Research Analysts) Regulations 2014. This report does not constitute an offer or
solicitation for the purchase or sale of any financial instrument or as an official confirmation of any transaction. Securities as
defined in clause (h) of section 2 of the Securities Contracts (Regulation) Act, 1956 includes Financial Instruments and Currency
Derivatives. The information contained herein is from publicly available data or other sources believed to be reliable. This report is
provided for assistance only and is not intended to be and must not alone be taken as the basis for an investment decision. The
user assumes the entire risk of any use made of this information. Each recipient of this report should make such investigation as it
deems necessary to arrive at an independent evaluation of an investment in Securities referred to in this document (including the
merits and risks involved), and should consult his own advisors to determine the merits and risks of such investment. The
investment discussed or views expressed may not be suitable for all investors.
This information is strictly confidential and is being furnished to you solely for your information. This information should not be
reproduced or redistributed or passed on directly or indirectly in any form to any other person or published, copied, in whole or in
part, for any purpose. This report is not directed or intended for distribution to, or use by, any person or entity who is a citizen or
resident of or located in any locality, state, country or other jurisdiction, where such distribution, publication, availability or use
would be contrary to law, regulation or which would subject ESL and associates / group companies to any registration or licensing
requirements within such jurisdiction. The distribution of this report in certain jurisdictions may be restricted by law, and persons
in whose possession this report comes, should observe, any such restrictions. The information given in this report is as of the date
of this report and there can be no assurance that future results or events will be consistent with this information. This information
is subject to change without any prior notice. ESL reserves the right to make modifications and alterations to this statement as
may be required from time to time. ESL or any of its associates / group companies shall not be in any way responsible for any loss
or damage that may arise to any person from any inadvertent error in the information contained in this report. ESL is committed
to providing independent and transparent recommendation to its clients. Neither ESL nor any of its associates, group companies,
directors, employees, agents or representatives shall be liable for any damages whether direct, indirect, special or consequential
including loss of revenue or lost profits that may arise from or in connection with the use of the information. Our proprietary
trading and investment businesses may make investment decisions that are inconsistent with the recommendations expressed
herein. Past performance is not necessarily a guide to future performance .The disclosures of interest statements incorporated in
this report are provided solely to enhance the transparency and should not be treated as endorsement of the views expressed in
the report. The information provided in these reports remains, unless otherwise stated, the copyright of ESL. All layout, design,
original artwork, concepts and other Intellectual Properties, remains the property and copyright of ESL and may not be used in
any form or for any purpose whatsoever by any party without the express written permission of the copyright holders.
ESL shall not be liable for any delay or any other interruption which may occur in presenting the data due to any reason including
network (Internet) reasons or snags in the system, break down of the system or any other equipment, server breakdown,
maintenance shutdown, breakdown of communication services or inability of the ESL to present the data. In no event shall ESL be
liable for any damages, including without limitation direct or indirect, special, incidental, or consequential damages, losses or
expenses arising in connection with the data presented by the ESL through this report.
We offer our research services to clients as well as our prospects. Though this report is disseminated to all the customers
simultaneously, not all customers may receive this report at the same time. We will not treat recipients as customers by virtue of
their receiving this report.
ESL and its associates, officer, directors, and employees, research analyst (including relatives) worldwide may: (a) from time to
time, have long or short positions in, and buy or sell the Securities, mentioned herein or (b) be engaged in any other transaction
involving such Securities and earn brokerage or other compensation or act as a market maker in the financial instruments of the
subject company/company(ies) discussed herein or act as advisor or lender/borrower to such company(ies) or have other
potential/material conflict of interest with respect to any recommendation and related information and opinions at the time of
publication of research report or at the time of public appearance. ESL may have proprietary long/short position in the above
mentioned scrip(s) and therefore should be considered as interested. The views provided herein are general in nature and do not
consider risk appetite or investment objective of any particular investor; readers are requested to take independent professional
ESL or its associates may have received compensation from the subject company in the past 12 months. ESL or its associates may
have managed or co‐managed public offering of securities for the subject company in the past 12 months. ESL or its associates
may have received compensation for investment banking or merchant banking or brokerage services from the subject company in
the past 12 months. ESL or its associates may have received any compensation for products or services other than investment
banking or merchant banking or brokerage services from the subject company in the past 12 months. ESL or its associates have
not received any compensation or other benefits from the Subject Company or third party in connection with the research report.
Research analyst or his/her relative or ESL’s associates may have financial interest in the subject company. ESL and/or its Group
Companies, their Directors, affiliates and/or employees may have interests/ positions, financial or otherwise in the
Securities/Currencies and other investment products mentioned in this report. ESL, its associates, research analyst and his/her
relative may have other potential/material conflict of interest with respect to any recommendation and related information and
opinions at the time of publication of research report or at the time of public appearance.
Participants in foreign exchange transactions may incur risks arising from several factors, including the following: ( i) exchange
rates can be volatile and are subject to large fluctuations; ( ii) the value of currencies may be affected by numerous market
factors, including world and national economic, political and regulatory events, events in equity and debt markets and changes in
interest rates; and (iii) currencies may be subject to devaluation or government imposed exchange controls which could affect the
value of the currency. Investors in securities such as ADRs and Currency Derivatives, whose values are affected by the currency of
an underlying security, effectively assume currency risk.
Research analyst has served as an officer, director or employee of subject Company: No
ESL has financial interest in the subject companies: No
ESL’s Associates may have actual / beneficial ownership of 1% or more securities of the subject company at the end of the month
immediately preceding the date of publication of research report.
Research analyst or his/her relative has actual/beneficial ownership of 1% or more securities of the subject company at the end of
the month immediately preceding the date of publication of research report: No
ESL has actual/beneficial ownership of 1% or more securities of the subject company at the end of the month immediately
preceding the date of publication of research report: No
Subject company may have been client during twelve months preceding the date of distribution of the research report.
There were no instances of non‐compliance by ESL on any matter related to the capital markets, resulting in significant and
material disciplinary action during the last three years except that ESL had submitted an offer of settlement with Securities and
Exchange commission, USA (SEC) and the same has been accepted by SEC without admitting or denying the findings in relation to
their charges of non registration as a broker dealer.
A graph of daily closing prices of the securities is also available at www.nseindia.com
Analyst Certification:
The analyst for this report certifies that all of the views expressed in this report accurately reflect his or her personal views about
the subject company or companies and its or their securities, and no part of his or her compensation was, is or will be, directly or
indirectly related to specific recommendations or views expressed in this report.
Additional Disclaimers
Disclaimer for U.S. Persons
This research report is a product of Edelweiss Securities Limited, which is the employer of the research analyst(s) who has
prepared the research report. The research analyst(s) preparing the research report is/are resident outside the United States
(U.S.) and are not associated persons of any U.S. regulated broker‐dealer and therefore the analyst(s) is/are not subject to
supervision by a U.S. broker‐dealer, and is/are not required to satisfy the regulatory licensing requirements of FINRA or required
to otherwise comply with U.S. rules or regulations regarding, among other things, communications with a subject company, public
appearances and trading securities held by a research analyst account.
This report is intended for distribution by Edelweiss Securities Limited only to "Major Institutional Investors" as defined by Rule
15a‐6(b)(4) of the U.S. Securities and Exchange Act, 1934 (the Exchange Act) and interpretations thereof by U.S. Securities and
Exchange Commission (SEC) in reliance on Rule 15a 6(a)(2). If the recipient of this report is not a Major Institutional Investor as
specified above, then it should not act upon this report and return the same to the sender. Further, this report may not be copied,
Access the entire repository of Edelweiss Research on www.edelresearch.com
In reliance on the exemption from registration provided by Rule 15a‐6 of the Exchange Act and interpretations thereof by the SEC
in order to conduct certain business with Major Institutional Investors, Edelweiss Securities Limited has entered into an
agreement with a U.S. registered broker‐dealer, Edelweiss Financial Services Inc. ("EFSI"). Transactions in securities discussed in
this research report should be effected through Edelweiss Financial Services Inc.
Disclaimer for U.K. Persons
The contents of this research report have not been approved by an authorised person within the meaning of the Financial
Services and Markets Act 2000 ("FSMA").
In the United Kingdom, this research report is being distributed only to and is directed only at (a) persons who have professional
experience in matters relating to investments falling within Article 19(5) of the FSMA (Financial Promotion) Order 2005 (the
“Order”); (b) persons falling within Article 49(2)(a) to (d) of the Order (including high net worth companies and unincorporated
associations); and (c) any other persons to whom it may otherwise lawfully be communicated (all such persons together being
referred to as “relevant persons”).
This research report must not be acted on or relied on by persons who are not relevant persons. Any investment or investment
activity to which this research report relates is available only to relevant persons and will be engaged in only with relevant
persons. Any person who is not a relevant person should not act or rely on this research report or any of its contents. This
research report must not be distributed, published, reproduced or disclosed (in whole or in part) by recipients to any other
person.
Disclaimer for Canadian Persons
This research report is a product of Edelweiss Securities Limited ("ESL"), which is the employer of the research analysts who have
prepared the research report. The research analysts preparing the research report are resident outside the Canada and are not
associated persons of any Canadian registered adviser and/or dealer and, therefore, the analysts are not subject to supervision by
a Canadian registered adviser and/or dealer, and are not required to satisfy the regulatory licensing requirements of the Ontario
Securities Commission, other Canadian provincial securities regulators, the Investment Industry Regulatory Organization of
Canada and are not required to otherwise comply with Canadian rules or regulations regarding, among other things, the research
analysts' business or relationship with a subject company or trading of securities by a research analyst.
This report is intended for distribution by ESL only to "Permitted Clients" (as defined in National Instrument 31‐103 ("NI 31‐103"))
who are resident in the Province of Ontario, Canada (an "Ontario Permitted Client"). If the recipient of this report is not an
Ontario Permitted Client, as specified above, then the recipient should not act upon this report and should return the report to
the sender. Further, this report may not be copied, duplicated and/or transmitted onward to any Canadian person.
ESL is relying on an exemption from the adviser and/or dealer registration requirements under NI 31‐103 available to certain
international advisers and/or dealers. Please be advised that (i) ESL is not registered in the Province of Ontario to trade in
securities nor is it registered in the Province of Ontario to provide advice with respect to securities; (ii) ESL's head office or
principal place of business is located in India; (iii) all or substantially all of ESL's assets may be situated outside of Canada; (iv)
there may be difficulty enforcing legal rights against ESL because of the above; and (v) the name and address of the ESL's agent for
service of process in the Province of Ontario is: Bamac Services Inc., 181 Bay Street, Suite 2100, Toronto, Ontario M5J 2T3 Canada.
Disclaimer for Singapore Persons
In Singapore, this report is being distributed by Edelweiss Investment Advisors Private Limited ("EIAPL") (Co. Reg. No.
201016306H) which is a holder of a capital markets services license and an exempt financial adviser in Singapore and (ii) solely to
persons who qualify as "institutional investors" or "accredited investors" as defined in section 4A(1) of the Securities and Futures
Act, Chapter 289 of Singapore ("the SFA"). Pursuant to regulations 33, 34, 35 and 36 of the Financial Advisers Regulations ("FAR"),
sections 25, 27 and 36 of the Financial Advisers Act, Chapter 110 of Singapore shall not apply to EIAPL when providing any
financial advisory services to an accredited investor (as defined in regulation 36 of the FAR. Persons in Singapore should contact
EIAPL in respect of any matter arising from, or in connection with this publication/communication. This report is not suitable for
private investors.