Research Article
a
April
2018
Computer Science and Software Engineering
ISSN: 2277-128X (Volume-8, Issue-4)
Detection of Leukemia Using Image Processing
Dr. A. Sivasangari*
ECE Dept./GMRIT, Andhra Pradesh, India
Dr. G. Sasikumar
Power Engg. Dept./GMRIT, Andhra Pradesh, India
Abstract— Leukemia disease is one of the leading causes of death among human. Its cure rate and prognosis depends mainly on the early detection and diagnosis of the disease. At the moment, identification of blood disorders is through visual inspection of microscopic images by examining changes like texture, geometry, colour and statistical analysis of images . This project aims to preliminary of developing a detection of leukemia types using microscopic blood sample using MATLAB. Images are used as they are cheap and do not expensive for testing and lab equipment.
Keywords— Leukemia, Blood sample, Image Processing
I. INTRODUCTION
Leukemia is a type of blood cancer occurs in white blood cells (WBCs) generated from the bone marrow. It disrupts the balance of the blood system diagnosed through highly trained specialists using expensive laboratories. But this way of evaluation reported that, 50% of patients are misdiagnosed in regard of subtypes. Diagnostic problem arises due to imitation of similar signs in other disorders and complex nature of blood smear images. Hence the variation in slide preparation techniques, needs more work to meet real clinical demands. The acute leukemia segmentation and classification techniques are based on four main categories such as threshold, boundary, region and hybrid. Most of the techniques combine boundary and region criteria. Threshold based methods such as Otsu and histogram segments the WBCs directly from the blood smear image using the intensity level.
Figure1. Blood Sample
ISSN(E): 2277-128X, ISSN(P): 2277-6451, pp. 61-67
II. MATERIALS AND METHODS
Leukemia is a type of cancer that affects the white blood cells. This affected white blood cells capture the bone marrow and the bone marrow is the soft material inside the of most bone. The abnormal white blood cells stay in bone marrow and reproducing in an uncontrolled way. In this way the normal healthy white blood cells in converted to abnormal uncontrolled cells the effect of this thing is human body is less able to fight off infections. The abnormal white blood cells also affect red blood cells and platelets. This affected red blood cells leads to less oxygen being delivered to the organs and tissues of your body it cause anaemia, and it can make to feel tired and breathless to the patient. And affected platelets due to abnormal cells can lead to problems with the blood-clotting system, and results in bleeding and bruising much more easily than usual.
In initial stage identification of the leukemia type, greatly aids in providing the appropriate treatment for the particular type. Its detection of leukemia starts with a complete blood count. If the count blood cells are abnormal, the patient is suggested to consult the doctors. Therefore, to confirm the presence of leukemic cells, a study of morpho logical bone marrow and peripheral blood slide analysis is done. In order to classify the abnormal cells in their particular types and subtype of leukemia, a haematologist will observe some cells under a light microscopy looking for the abnormalities presented in the nucleus or cytoplasm of the cells. The clinical behaviour of the disease can be predicted using this classification and accordingly treatment should be given to the patient. In leukemia disease, large numbers of abnormal white blood cells are produced by bone marrow due to unknown cause. In pathology manual detection of leukemia is done which is time consuming as well as costly due to high cost pathology instruments. Hence automatic technique is adopted for fast and accurate results. In this technique image of blood sample is processed and nucleus part is segmented and finally cells are classified whether they are blast or normal one.
H-Minima Transform
In recent years, a number of automated microscopic cellular image analysis techniques has been introduced. Especially, there have been several approaches to segmenting the nuclei in the literature and most of them have been performed manually or in a semiautomatic manner to obtain more accurate segmentation results. However, the user-interaction hinders the automated cell image analysis,. Therefore, developing a sophisticated and unsupervised nuclei segmentation method is necessary to assure the success of the automatic cell image analysis.
One of the main factors, which make it hard to accurately segment the nuclei, is the existence of clustered nuclei in the cell images. The watershed algorithm is one of the most widely used segmentation techniques for nuclei extraction. However, watershed usually yields over segmentation since regional minima or ultimate eroded points are employed for segmenting nuclei directly. This is because it is difficult to have one-to-one correspondence between regional minima and nuclei. In addition, it becomes worse when the nuclei are clustered. To handle the over segmentation problem, region, merging and marker-controlled watershed techniques have been reported in the literature. The region merging techniques are highly sensitive to the sizes of nuclei. The marker-controlled watershed schemes formulate the segmentation as a marker extraction problem. In the marker-controlled watershed methods, nuclei should be initially represented by the markers appropriately,. Thus, the step for elimination of spurious markers that result in over segmentation of nuclei needs to be employed in the marker-controlled watershed. Meanwhile, mathematical morphology has been involved to obtain the markers accurately. In, a maker detection technique based on condition erosion has been introduced. However, the segmentation results tend to rely on incorporated morphological structuring elements and erosion thresholds.
The H-minima or H-maxima transform is a powerful mathematical tool to suppress undesired minima or maxima. Performing the H-minima transform on the inverse distance image can effectively decrease over segmentation. On the other hand, the H-maxima transform is applied to the distance image. Let g denote the inverse distance map of clustered nuclei. The H-minima transform is performed by,
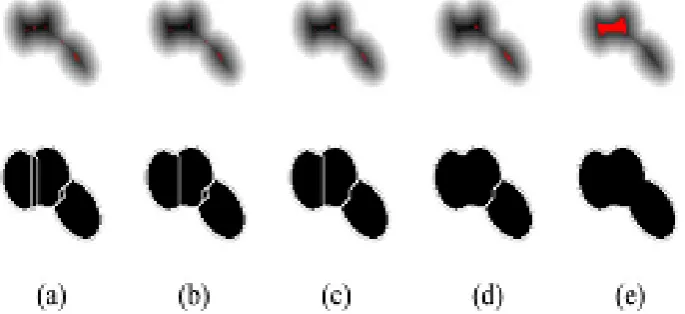
where represents the given depth. In (1), R and ε represent the reconstruction and erosion operators, respectively. By using the H-minima transform, all minima whose depth is lower than or equal to the given h-value are suppressed. Fig. 1 shows regional minima and corresponding watershed segmentation results from a synthetic clustered nuclei with different h-values adopted. As shown in Fig. 1, the h-value has a direct influence on the number of segmented regions. The larger the h-value is, the fewer the numbers of the segmented regions. , we assess the segmentation quality by using a distortion evaluation function.
ISSN(E): 2277-128X, ISSN(P): 2277-6451, pp. 61-67
Figure 2. Regional Minima Marked In Red (Upper Row) And Watershed Segmentation Results With Several H-Values: (A) H = 0, (B) H = 1, (C) H = 2, (D) H = 5, And (E) H = 47.
It is assumed that each nucleus has its own segmentation distortion value, which we call the averaged fitting residual (AFR) and is defined in (4), and the values from all nuclei are averaged to obtain S(wh). Since we know the partial original boundaries of each nucleus, it is possible to mathematically represent each nucleus using the corresponding elliptical model. Let (u, v) be a point on the partial original boundary. However, watershed usually yields over segmentation since regional minima or ultimate eroded points are employed for segmenting nuclei directly.
Read image: Read the images which may have leukemia cells. This image is provided to the program. Gradient image: The received images change in intensity or color is done in the process of gradient.
Dilation: The binary gradient mask is dilated using the vertical structuring element following by the horizontal structuring element.
Fill holes: The holes are present in interior of cell to fill the holes.
Clear border: To remove border of the image by using the Imclear border function.
Final segmented cells: A method for displaying the segmented Object would be to place red marks on the segmented cell.
Image Acquisition
For slide preparation working solutions of Giemsa were made by adding 100 μl stock solution to each millilitre of distilled water. Dried thin blood films were fixed with methanol for 30 s, poured off and stained with Giemsa for 20 min. The stain was rinsed off with tap water for 10 s. Upon drying, slides were used immediately or stored for future use. Image was captured by connecting high resolution Digital camera to microscope. By adjusting microscope magnification image is captured. Pre-processing step includes noise reduction, smoothening of image. In this paper we used median filter for smoothening of color image and Laplacian filter is used for edge sharpening. This result is subtracted from original to enhance the image. The median filter is a non-linear digital filtering technique, used to remove noise from images. In median filtering pixel replaces with the median of its neighbouring pixel values. Laplacian filter takes second order derivative of pixel. After pre-processing image is send to cell segmentation block to segment cells.
Cell Segmentation
To segment foreground from background Global threshold and Otsu threshold is used on gray scale enhanced image. For low contrast image segmentation applied on enhanced green channel of the image. Result of thresholding on both images is added to get binary image of cells. A 3 x 3 median filter was applied on this binary cell mask to fill the holes in blood cells and to remove the unwanted points from binary image of cells and background. Using morphological operation cells having larger area is identified which is overlapping of the cells. Distance transform is applied on it followed by watershed transform. This gives separation of overlapping cells. This final binary image of cells is given to next block.
RBCS Segmentation
ISSN(E): 2277-128X, ISSN(P): 2277-6451, pp. 61-67
SVM Classifier
The SVM is a powerful solution to the classification problems. In this paper, it has been used for the recognition and classification of cells. The main advantage of the SVM network used as a classifier is its very good generalization ability and extremely powerful learning procedure, leading to the global minimum of the defined error function. Linear SVM is a linear discriminant classifier working on the principle of maximum margin between two classes. The decision function of the N dimensional input vector x for K-dimensional feature space (K>N) is defined as D(x) = wT (x) +b through the use of function (x). Where (x) = w as the weight vector of network w=T, and b as the bias weight. All values of weights have been arranged in decreasing order and only the most important have been selected for each pair of classes and then used in the final classification system.
The learning of the SVM network working in the classification mode is aimed at the maximization of the separation margin between two classes. Simple classification algorithm is proposed that classifies points by assigning them to the closer of two parallel planes (in input or feature space). Standard support vector machines (SVMs), which assign points to one of two half spaces. SVM classifier is used for classification of normal and infected cells.
Figure3. A) Original Image, B) Pre-Processed Image, C) Binary Image Of Cells, D) Separation Of Overlapping Cells, E) Detected Parasite Infect Cells
Colour Normalisation
It is essential to apply a colour normalization to the images in order to decrease the effect of different light sources or sensor characteristics (e.g. intensity, white balance). Among many computational colour constancy algorithms based on the different models of illumination change, we have chosen to use an adapted grey world normalisation method based on the diagonal model of illumination change which utilizes certain characteristics of microscopic peripheral blood images. Grey world normalisation assumes that there is a constant grey value of the image which does not change among different conditions.
Figure4. Colour Normalisation
(A) An Input Image Before Normalisation (B) After Normalisation With Its Background Channel Average Values, (C) (B) Normalised With Reference Foreground Channel Averages, (D) A Reference Image.
ISSN(E): 2277-128X, ISSN(P): 2277-6451, pp. 61-67
INPUT IMAGE
GRAY SCALE IMAGE
RESULTIMAGE
100 200 300 400 500 600 700
50
100
150
200
250
300
350
400
450
500
550
100 200 300 400 500 600 700
50
100
150
200
250
300
350
400
450
500
550
100 200 300 400 500 600 700
50
100
150
200
250
300
350
400
450
500
ISSN(E): 2277-128X, ISSN(P): 2277-6451, pp. 61-67
DETECTED REGION
III. CONCLUSION
The detection of Leukemia parasites is done by pathologists manually using Microscopes. So, the chances of false detection due to human error are high, which in turn can result into fatal condition. This project curbs the human error while detecting the presence of leukemia parasites in the blood sample by using image processing. H-minima marker extraction technique is used to detect leukemia parasites in images acquired from peripheral blood samples. Simulation result achieves high percentages of sensitivity, specificity, positive prediction and negative prediction values. And the extraction of red blood cells achieves a reliable performance and the actual classification of infected cells.
REFERENCES
[1] FauziahKasmin, Anton SatriaPrabuwono, Azizi Abdullah, “Detection Of Leukemia in Human Blood Sample Based on Microscopis Images: A Study,” Journal Of Theoretical and Applied Information Technology, vol. 46 no 2, 2012.
[2] High White Blood Cell Count [Online]. http://www.buzzle.com/articles/high-white-blood-cell-count.html [3] Ruggero DonidaLabati, Vincenzo Piuri, Fabio Scotti, “The Acute Lymphoblastic Leukemia Image Database for
Image Processing,” UniversitaDegliStudi Di Milano, 10.1109/ICIP.2011.6115881, 2011.
[4] RaymondH.chan,chung-waHo and Mila nikolova, “Salt and pepper noise reduction by mediantype noise detections and detail-preserving Regulation”, IEEE Transaction on image processing, Vol.14,No.10,October 2005
[5] S.Jagadeesh, Dr.E.Nagabhooshanam, Dr.S.Venkatachalam, “Image Processing Based Approach to Cancer Cell Prediction in Blood Samples, "International Journal of Technology and Engineering Sciences, vol.1, ISSN: 2320-8007, 2013
[6] TheEncyclopedia of Surgery [Online]. : http://www.surgeryencyclopedia.com/Ce-Fi/Complete-Blood-Count.html
[7] C.R., Valencio, M.N., Tronco, A.C.B.,Domingos, C.R.B., “Knowledge Extraction Using Visualization of Hemoglobin Parameters to Identify Thalassemia”,Proceedings of the 17th IEE Symposium onComputer Based Medical Systems, 2004, pp.1-6.
[8] R., Adollah, M.Y., Mashor, N.F.M, Nasir, H.,Rosline, H., Mahsin, H., Adilah, “Blood CellImage Segmentation: A Review”, Biomed 2008, Proceedings 21, 2008, pp. 141-144.
[9] N., Ritter, J., Cooper, “Segmentation andBorder Identification of Cells in Images of Peripheral Blood Smear Slides”, 30th
Australasian Computer Science Conference,Conference in Research and Practice in Information Technology, Vol. 62, 2007, pp. 161-169.
[10] D.M.U., Sabino, L.D.F., Costa, L.D.F., E.G., Rizzatti, M.A., Zago, “A Texture Approach to Leukocyte Recognition”, Real Time Imaging, Vol. 10, 2004, pp. 205-206.
[11] M.C., Colunga, O.S., Siordia, S.J., Maybank, “Leukocyte Recognition Using EMAlgorithm”, MICAI 2009, LNAI 5845, Springer Verlag Berlin Heidelberg, 2009, pp. 545-555.
390 400 410 420 430 440 450 460 470 480
220
240
260
280
300
ISSN(E): 2277-128X, ISSN(P): 2277-6451, pp. 61-67
[12] K.S., Srinivisan, D., Lakshmi, H., Ranganathan, N., Gunasekaran, “Non Invasive Estimation of Hemoglobin in Blood Using Color Analysis”, 1st International Conference on Industrial and Information System, ICIIS 2006, Sri Lanka, 8 – 11 August 2006, pp 547-549.
[13] W., Shitong, W., Min, “A new Detection Algorithm (NDA) Based on Fuzzy Cellular Neural Networks for White Blood Cell Detection”, IEEE Transactions on Information Technology in Biomedicine, Vol. 10, No. 1, January 2006, pp. 5-10.
[14] H., Shin, M.K., Markey, “A Machine Learning Perspective on the Development of Clinical Decision Support System Utilizing Mass Spectra of Blood Samples”, Journal of Biomedical Informatics 39. 2006, pp. 227-248. [15] M., Chitsaz, C., S., Woo, “Software Agent with Reinforcement Learning Approach for Medical Image