A New Fuzzy Based Energy Management System with Storage
B.Maneesha & Kothuri Ramakrishna
1M.Tech, B. V Raju Institute Of Technology (Autonomous) Engineering College, Narsapur Affiliated to JNTUH, Hyderabad,
Telangana, India.
2Assistant Professor, B. V Raju Institute Of Technology(Autonomous) Engineering College, Narsapur Affliated to JNTUH,
Hyderabad, Telangana, India.
Abstract-Nowadays, energy management system is most important. Power electronics based energy management system used in this paper. This paper demonstrates the functionality of a power electronics based energy management system (EMS).The EMS includes batteries and a digitally controlled single-phase voltage source inverter (VSI), which can be controlled as a current source or a voltage source depending on the status of the ac grid and the user’s preference. In this project we are using the fuzzy controller compared to other controllers i.e. The fuzzy controller is the most suitable for the human decision-making mechanism, providing the operation of an electronic system with decisions of experts. The main Objectives of the system is 1) Peak shaving by tapping the energy storage system during high power demand. 2) Islanding or standalone mode of operation when the main AC grid is no longer available. The EMS guarantees that the critical loads are powered when the ac grid fails; in which case, the VSI is controlled as a voltage source. By using the fuzzy controller for a nonlinear system allows for a reduction of uncertain effects in the system control and improve the efficiency. The electricity cost savings accomplished by peak shaving are estimated.
Index Terms—Energy management systems (EMS), energy storage, peak power control, Fuzzy logic controller, voltage source inverters (VSI).
INTRODUCTION
In this paper, A Power-electronics-based energy management system (EMS) is presented to accomplish peak power control in a single-phase power system while guaranteeing continuous service to critical loads at the same time. In this paper, a power-electronics-based energy management system (EMS) is presented to accomplish peak power control in a single-phase power system while guaranteeing continuous service to critical loads at the same time. Peak power control, also known as peak shaving, is a method used to reduce the electricity charges for users with time of use (TOU) contracts and those who pay for the demand charges [1]. The power system does not need to be a microgrid, meaning that distributed generation (DG) does not need to be part of the power system. However, if DG units, such as photovoltaic panels or diesel generators, are part of the installation the EMS can manage these resources. The EMS proposed in this paper includes energy storage in the form of batteries in order to accomplish three main goals: 1) make electric power available to critical loads at all times with or without main grid service available, 2) reduce peak power consumption to lower electricity costs, and 3) store energy
produced by DG units or during the time in which electricity from the grid is least expensive.
The EMS functionality is demonstrated in this paper by simulation validation with a laboratory prototype. The following scenarios are discussed:
1) peak saving by tapping the energy storage system during high power demand;
2) islanding or stand alone mode of operation when the main ac grid is no longer available;
3) battery charging mode.
This paper while following along the same line of research, introduces the prospective of continuous service to critical loads with peak power shaving. It also includes a simple economic analysis to demonstrate the advantages of the peak power shaving method.
EMS ARCHITECTURE AND FUNCTIONALITY
The EMS presented in this paper includes batteries and a three-leg power module controlled by a field programmable gate array (FPGA). The schematic in Fig. 1 depicts the EMS architecture.
Fig.1.EMS architecture.
A three-phase IGBT power module is controlled to achieve buck and boost power flow from one leg of the module and single-phase voltage source operation (H-bridge inverter) from the other two legs of the module. The H-bridge inverter, thus, formed is connected to an output LC filter to produce the sinusoidal voltage for the ac loads.
because they are critical to the mission. Noncritical loads are connected in parallel to vac, however, they can be shed when necessary using a thyristor switch. This increases the control of the power that can be directed to the critical loads when necessary. The ac grid can also be disconnected from vac if needed to island the operation of the EMS. Typically islanding mode occurs when the ac grid fails. In this mode of operation, power to critical loads is guaranteed by drawing energy from the battery pack.
In this case, the EMS can manage the energy stored and energy drawn from the grid to reduce consumption when the power rates are higher. This technique is known as load leveling [4] or retail energy time shift [25] and it achieves electricity cost reduction for the user.
Fig.2.EMS logic flowchart. Run, Charge, SC and CT are inputs from the operator or secondary controller. The EMS control algorithm was developed with the following goals, listed here in order of priority:
1) power must be available to the critical loads at all times; 2) reduce the peak power absorbed by the microgrid by using battery power and by noncritical load shedding; 3) maximize the state of charge of the battery; 4) make power available to non critical loads.
EMS CONTROL SYSTEMS
The primary control system includes the power converter module controllers, which generate the gate drive signals given reference voltages and currents. This paper focuses on the primary control system. Fig. 2 shows the EMS primary controller logic flowchart, which is a detailed visualization of the ―EMS Logic‖ block in Fig. 1. The operator or the secondary controller inputs four distinct logical commands; Run, Charge, Source Connect (SC), and Current Threshold (CT). CT is the load current level when the EMS will begin peak shaving.
These four commands coming from the secondary controller can be set based on several factors. The secondary control system will set the charging command and the peak shaving thresholds in order to achieve the best performance. The information that will be used by the higher level controller will include state-of charge, time of day, cost of electricity, and other factors.
Ems control in islanding mode
Islanding or stand-alone mode occurs when the ac grid is de-energized or the EMS is disconnected from the ac grid. The control algorithm for this mode of operation is shown in Fig. 3.
Fig.3.Control algorithm for islanding mode.
The amplitude of the ac voltage, vac∗, is set to 110 Vrms.
The electrical angle, θ, is defined by integrating the angular frequency, which is set to 60 Hz. Uni-polar pulse width modulation (PWM) is used to drive the H-bridge IGBTs. This open-loop control algorithm does not compensate for RMS output voltage deviations or provide any active damping but these capabilities are easily implemented as required.
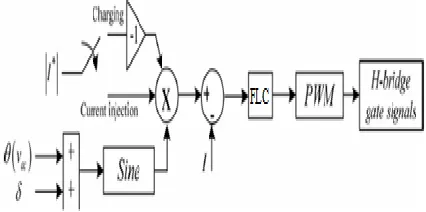
EMS Control in Current Injection Mode
The EMS can provide several valuable grid support functions when the EMS is connected to an active ac grid. These modes of operation operate the EMS as a current source. Two current injection modes of operation are shown in Fig. 4.
Fig. 4. Control algorithm for current injection. If the desired action is charging the batteries, then a reference current, I∗, defines the amplitude of the current to be drawn from the grid to charge the batteries. The electrical angle, θ (vac), is derived from the grid voltage using zero crossing detection of the EMS voltage, vac. The current drawn from the grid will typically be at unity power factor, which means that δ = 0 in this mode of operation.
scheduled. When δ = 0, the power factor is unity because θ (vac) is synchronized to the electrical angle of vac.
Dc-bus control algorithm
The dc bus that powers the H-bridge and the buck–boost switches is controlled as shown in Fig. 5.
Fig. 5. DC-bus control algorithm.
This improves the efficiency compared to driving both switches all the time. Whenever battery charging mode is chosen, current is injected into the dc bus by the H-bridge and the dc-bus controller operates in buck mode to deliver the energy to the battery pack. When the EMS is in current injection mode, the power delivered to the ac bus is drawn from the dc bus and the dc-bus controller operates in boost mode to hold the dc bus up using battery power.
The IGBT module that is being used has charge pumps to provide energy to the IGBT gate drives. This is a significant simplification and cost saving feature of the power module.
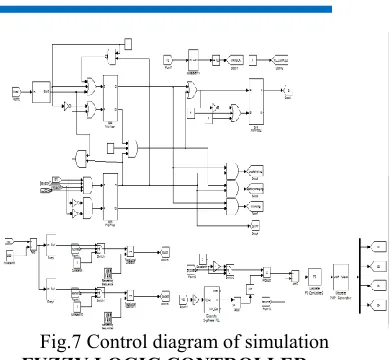
Fig.6 Block diagram of simulation
Fig.7 Control diagram of simulation
FUZZY LOGIC CONTROLLER
In FLC, basic control action is determined by a set of linguistic rules. These rules are determined by the system. Since the numerical variables are converted into linguistic variables, mathematical modeling of the system is not required in FC.
Fig.8.Fuzzy logic controller
The FLC comprises of three parts: fuzzification, interference engine and defuzzification. The FC is characterized as i. seven fuzzy sets for each input and output. ii. Triangular membership functions for simplicity. iii. Fuzzification using continuous universe of discourse. iv. Implication using Mamdani‘s, ‗min‘ operator. v. De-fuzzification using the height method.
TABLE I: Fuzzy Rules
adapt the shape up to appropriate system. The value of input error and change in error are normalized by an input scaling factor.In this system the input scaling factor has been designed such that input values are between -1 and +1. The triangular shape of the membership function of this arrangement presumes that for any particular E(k) input there is only one dominant fuzzy subset. The input error for the FLC is given as
E(k) = Pp h (k )−Pp h (k −1)
Vp h (k )−Vp h (k −1) (1)
CE(k) = E(k) – E(k-1) (2)
Inference Method: Several composition methods such as Max–Min and Max-Dot have been proposed in the literature. In this paper Min method is used. The output membership function of each rule is given by the minimum operator and maximum operator. Table 1 shows rule base of the FLC.
De-fuzzification: As a plant usually requires a non-fuzzy value of control, a de-fuzzification stage is needed. To compute the output of the FLC, „height‟ method is used and the FLC output modifies the control output. Further, the output of FLC controls the switch in the inverter. In UPQC, the active power, reactive power, terminal voltage of the line and capacitor voltage are required to be maintained. In order to control these parameters, they are sensed and compared with the reference values. To achieve this, the membership functions of FC are: error, change in error and output
The set of FC rules are derived from
u=-[α E + (1-α)*C] (3)
Fig 9 input error as membership functions
Fig 10 change as error membership functions
Fig.11 output variable Membership functions Where α is self-adjustable factor which can regulate the whole operation. E is the error of the system, C is the change in error and u is the control variable.
Fig 12.fuzzy logic controller in simulation
SIMULATION RESULTS
The circuit shown in Fig. 1 was built in the laboratory to demonstrate the EMS functionality.
Peak Shaving and Battery Charging With the AC Grid Connected
Residential and commercial TOU electricity rates include different rates at different time of the day (such as on-peak and off-peak) and also demand charges.
Peak shaving is achieved by controlling the RMS current in the load, which is related to the source current. A threshold is set for the load current, such that when the load RMS current exceeds this threshold, the EMS supplies some of the load current. This keeps the peak current drawn from the ac grid below a set limit.
Fig.13. Peak saving with the EMS providing some of the load current from the battery pack when the load increases.
Load 2 steps from 600 to 80 Ω (A), and then, the EMS turns ON (B). All the loads are linear.
Load conditions for the simulation measurements in grid-connected mode
Fig. 14. Peak shaving with the EMS providing some of the load current from the battery pack when the load increases. Load 2 steps from 1200 to 85.7 Ω (A), and then, the EMS
turns ON (B). The load includes a diode rectifier. Figs. 12 through 14 include the simulation waveforms obtained in ac grid-connected mode. Table I displays the values of the different loads used to create the waveforms in these figures.
Fig. 15. EMS turning ON at t = 0 to charge the battery pack.
A step change in the load is implemented by changing ―Load 2‖ in Figs. 13 and 14 as recorded in Table I. The only difference between the two sets of waveforms is that the diode rectifier is included in the load in Fig. 14, while it is not part of the load in Fig. 13. The diode rectifier is excluded from the circuit by making the variable resistor labeled as ―Load 1‖ very large, indicated as Table I.
EMS Powering Critical Loads When the AC Grid Fails—Islanding Mode of Operation
In order to provide power to critical loads when the ac grid fails, the EMS detects grid failure and acts as a voltage source for the critical loads. In this mode of operation, noncritical loads can be shed depending on the state of charge of the batteries and other factors determined by the user or by the secondary control system. The secondary
control system determines if the EMS should try to reconnect to the ac grid or not.
Fig.16. RMS voltage monitoring system block diagram. This is another programmable feature that can be managed by a higher level controller. There is a delay in the detection of the loss of the source due to a low-pass filter used in the detection algorithm. The detection algorithm is shown in Fig. 16.
Fig. 17.Simulation waveforms showing ac grid failure (A) and the EMS taking the loads into islanding mode
(B).α=20π.
Fig.18. Simulation waveforms showing the ac grid being restored att=0
Fig.19. Simulation waveforms showing ac grid failure (A) and the EMS taking the loads into islanding mode
(B).α=60π
VII APPLICATION AND ECONOMIC CONSIDERATIONS
electricity by implementing peak shaving as described in this paper. It involves storing electrical energy when the cost of energy is low and utilizing the stored energy when the cost of energy is high.
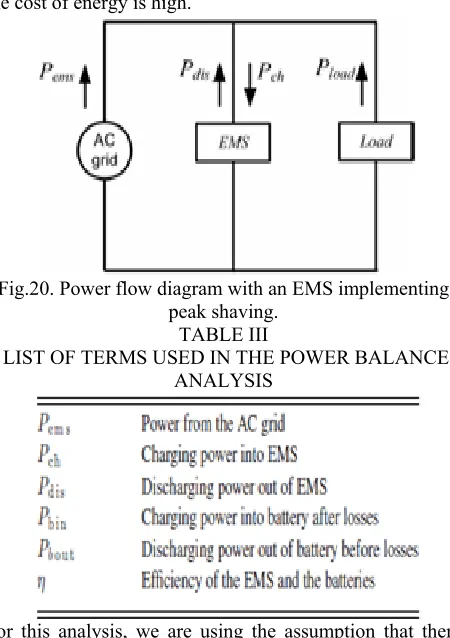
Fig.20. Power flow diagram with an EMS implementing peak shaving.
TABLE III
LIST OF TERMS USED IN THE POWER BALANCE ANALYSIS
For this analysis, we are using the assumption that there are two TOU rates: peak and off peak, neglecting the ―partial peak‖ rates in order to simplify the analysis. The goal is to show the advantage of using an EMS to reduce electricity expenses in facilities where typical buildings have medium to large commercial TOU electricity contracts.
It must be pointed out that the EMS system cost is not estimated in this paper, therefore, the return on investment is not computed. The battery pack is included in the EMS block; the battery power stored and later used is included in this analysis and the EMS/battery efficiency is considered in the performance
𝑃𝑒𝑚𝑠 = 𝑃𝑐ℎ− 𝑃𝑑𝑖𝑠+ 𝑃𝑙𝑜𝑎𝑑 (1) where Pch = Pb in η and Pdis = Pbout · η. Fig.20 shows an example of how the EMS can be used to reduce the power drawn from the ac grid during peak hours, when the rates are higher. The TOU rates, in pu, are represented by the continuous line. The dashed line is the power consumed by the loads without the EMS, while the dashed-dotted line
Fig.21. TOU rates and power consumption with and without EMS.
represents the power drawn from the ac grid when the EMS is functioning. Thus, the sum of the areas below the charging curves (off peak hours) plus the losses is equal to the area above the discharging curve (peak hours).
The daily cost of electricity can be quantified as a function of the cost for electricity and the instantaneous power consumption
$
𝑑𝑎𝑦= $𝑘𝑊ℎ 𝑡 . 𝑝(𝑡)𝑑𝑡
24ℎ𝑜𝑢𝑟𝑠
0 (2)
where $/day is the cost of electricity per day, $/kWh(t) is the cost per kWh as a function of time and p(t)is the power consumed by the load and EMS.
$ 𝑑𝑎𝑦.
$𝑎𝑐𝑡𝑢𝑎𝑙
𝑘𝑊ℎ . 𝑃𝑟𝑎𝑡𝑒𝑑 −𝑙𝑜𝑎𝑑 = $𝑎𝑐𝑡𝑢𝑎𝑙
𝑑𝑎𝑦 (3)
where $actual/kWh is the actual cost of electricity per kWh and Prated load is the rated power
CONCLUSION
REFERENCES
[1] G. M. Masters, Renewable and Efficient Electric Power Systems. New York, NY, USA: Wiley 2004.
[2] IEEE Standard for Interconnecting Distributed Resources With Electric Power Systems, IEEE Std. 1547, 2003.
[3] J. Rocabert, A. Luna, F. Blaabjerg, and P. Rodriguez, ―Control of power converters in AC microgrids,‖ IEEE Trans. Power Electron., vol. 27, no. 11, pp. 4734–4749, Nov. 2012.
[4] S. Vazquez, S. M. Lukic, E. Galvan, L. G. Franquelo, and J. M. Carrasco, ―Energy storage systems for transport and grid applications,‖ IEEE Trans. Ind. Electron., vol. 57, no. 12, pp. 3881–3895, Dec. 2010.
[5] F. Wang, J. L. Duarte, and M. A. M. Hendrix, ―Grid-Interfacing converter systems with enhanced voltage quality for microgrid application— Concept and implementation,‖ IEEE Trans. Power Electron., vol. 26, no. 12, pp. 3501–3513, Dec. 2011.
[6] E. Barklund, N. Pogaku, M. Prodanovic, C. Hernandez-Aramburo, and T. C. Green, ―Energy management in autonomous microgrid using stability-constrained droop control of inverters,‖ IEEE Trans. Power Electron., vol. 23, no. 5, pp. 2346–2352, Sep. 2008.
[7] S. Chakraborty, M. D. Weiss, and M. G. Sim˜oes, ―Distributed intelligent energy management system for a single-phase high-frequency AC microgrid,‖ IEEE Trans. Ind. Electron., vol. 54, no. 1, pp. 97–109, Feb. 2007. [8] Y. Chen, Y. Wu, C. Song, and Y. Chen, ―Design and implementation of energy management system with fuzzy control forDCmicrogrid systems,‖ IEEE Trans. Power Electron., vol. 28, no. 4, pp. 1563–1570, Apr. 2013. [9] B. I. Rani, G. S. Ilango, and C. Nagamani, ―Control strategy for power flow management in a PV system supplying DC loads,‖ IEEE Trans. Ind. Electron., vol. 60, no. 8, pp. 3185–3194, Aug. 2013.
[10] J. M. Carrasco, L. G. Franquelo, J. T. Bialasiewicz, E. Galvan, R. C. P. Guisado, M. A. M. Prats, J. I. Leon, and N. Moreno-Alfonso, ―Power-electronic systems for the grid integration of renewable energy sources: A survey,‖ IEEE Trans. Ind. Electron., vol. 53, no. 4, pp. 1002–1016, Aug. 2006.
B.MANEESHA
Completed B.Tech in Electrical & Electronics Engineering in 2013 from MALLAREDDY INSTITUTE OF ENGINEERING AND TECHNOLOGY, HYDERABAD
and Pursuing M.Tech form B. V Raju Institute Of Technology (Autonomous) Engineering College Affiliated to JNTUH, Hyderabad, Telangana, India. Area of interest includes Power engineering and energy management systems.
E-mail id: [email protected]
KOTHURI RAMAKRISHNA
Completed B.E in Electrical &Electronics Engineering in 1998 from Vijayanagar Engineering College, Gulbarga University and M.Tech in 2001 from ITPE Affiliated to JNTUH, Hyderabad. Working as Assistant Professor at B. V Raju Engineering & Techonology, Hyderabad, Telangana, India. Area of interest includes Power System Distribution.