24 Int. J. Adv. Biol. Biom. Res, 2015; 3 (1), 24-34
*Corresponding Author: Seyed Masoud Monavari, Faculty Environment and Energy, Science and Research Branch, Islamic Azad
University,Tehran,Iran ([email protected]) A R T I C L E I N F O A B S T R A C T
Article history:
Received: 03 Dec, 2014 Revised: 29 Jan, 2015 Accepted: 28 Feb, 2015 ePublished: 30 Mar, 2015
Key words:
Shahr-e-Babak Heavy metals Soil pollution Index
Mining
1.INTRODUCTION
Mining, processing, and smelting activities considered as one of the main anthropogenic source of metal contamination in the environment (Chopin and Alloway, 2007; Chen et al., 2007; Alloway and Ayres, 1997; Valery and Eugene, 1998). During the smelting of metalliferous ores, toxic metals such as Cu, Pb, Hg, Ni, As, Cd, Cr, Co, and Zn and metalloids could be potentially released into the soil (Selinus, 2005; Khorasanipour and Aftabi, 2011). Anthropogenic inputs especially as a result of smelting of ores may lead to exceed metals concentration from natural background in soil (Siegel 2004; Callender 2005; Khorasanipour and Aftabi, 2011). Thus, superficial soil and vegetation usually contain high metals content compared with their background value in areas affected by mining activities (Liu et al., 2006; Dudka and Adriano
1997). Soil can purify only slowly and partially that leads to toxic metal pollutants tend to be accumulated in soil (Lim et al. 2005; Luo et al. 2005; Meers et al. 2005; Khorasanipour and Aftabi, 2011). Therefore, metal pollution in soil and plants affected by mining and smelting activities and their environmental impacts have been investigated by many researchers due to importance of food safety and human health (Chen 1988; Selim and Sparks 2001; Callender 2005; Selinus 2005; Adriano 1986; Chuan et al. 1996; Cambier 1997; Dijkstra 1998; Sheppard et al. 2000; Cezary and Bal Ram 2001; Burt et al. 2003; Soylak and Turkoglu 1999; Saracoglu et al. 2009).
Heavy metals accumulated in soil could easily enter the food chain and make serious health problem when physical-chemical properties of soil change into a suitable state for metals release (Saeedi et al., 2013; Calmano et al., 1993; Jamshidi-Zanjani et al., 2014). Thus,
IJABBR- 2014- eISSN: 2322-4827
International Journal of Advanced Biological and Biomedical Research
Journal homepage: www.ijabbr.com
Original Article
Metal Pollution Assessment in Soil Samples of Mining Area, Shahr-E-Babak, Iran
Abbas Ali Damangir1, Akbar Baghvand2, Seyed Masoud Monavari*1, Faramarz Moattar1 1Faculty Environment and Energy, Science and Research Branch, Islamic Azad University,Tehran,Iran 2Graduate Faculty of Environment, University of Tehran, P.O.Box14135-6135,Tehran,Iran
investigation of potential risk of release of heavy metals considered as crucial issue. However, total metal content is not suitable indicative of risk of release. Determinations of different metals fraction in soil provide deeper insight about potential risk of release of metals (Maiz et al, 2000; Wang et al, 2003). In other words, metal partitioning using the sequential extraction method (SEM) affect their availability and uptake by organisms (Gue et al, 2006).
Different metal quality indexes are the appropriate tools to assess metals pollution state in soil samples. Some of them calculate metal pollution state based on total metal content such as enrichment factor (EF) and geo-accumulation index (Igeo), and some others like risk assessment code (RAC) and pollution index (Ipoll) include metal partitioning to estimate their pollution state (Jamshidi-Zanjani and Saeedi, 2013; Karbassi, 2008). In the present study, metal pollution state in soil samples of Shahr-e-Babak using different quality indexes was investigated. Moreover, metal fractionation study applied on selected samples according to Tessier et al. (1979) to assess potential risk of release of toxic metals. A new index based on background values of metal and their toxicity degree is introduced to assess metal pollution state in the study area.
2. MATERIALS AND METHODS
2.1. Study area
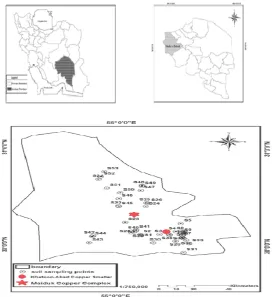
The Shahre-e-Babak covers an area of 13572 km2 in the north-western part of Kerman Province, south part of Iran. The Shahre-e-Babak is located between approximately N54º23' to 55º48' and E29º49' to 31º10'. There are major anthropogenic sources of metals such as Maiduk Copper Complex and Khatoon-Abad Copper Smelter in the central and south-eastern part of the study area, respectively. They enter toxic metals from mining activities to their adjacent environment which has adverse effect on soil, plants, animals, and public health. It should be mentioned that, agricultural activities and animal breading are the main job of the people in the study area. These anthropogenic sources of metals not only affect public health, but also have adverse effect on economic state of the residents due to interference with their activities. Although the Shahr-e-Baback receives considerable amount of toxic metals, there are not any deep studies about metal pollution state in the study area.
2.2. Soil sampling and chemical analysis
Fifty three surfacial soil samples (0-5 cm) were collected on May 2012 from Shahr-e-Babak (Fig.1). Most of samples were collected adjacent to Khatoon-Abad Copper Smelter and Maiduk Copper Complexes. Also, some samples were collected from unpolluted sites (far from the major anthropogenic sources) to determine metals background. Collected samples were transferred
to the laboratory in plastic bags then were passed through a 63µm sieve. Samples were then digested with HNO3/HCL/H2O2 according to U.S.EPA 3050B test method to determination of total metals (Cu, Pb, Ni, Cr, Cd, Zn, Mn, and Fe) concentrations (U.S.EPA, 1986).
Fig. 1. Soil sampling points in Shahr-e-Babak
The five step sequential extraction methods proposed by Tessier et al. (1979) was applied on selected samples (10 of 53) to study metal partitioning.
F1. Exchangeable fraction: The weakly bound extraction procedure was conducted using 10 ml of 1M MgCl2 (pH=7) for 1h at room temperature.
F2. Carbonate bound fraction: 10 ml of 1M sodium acetate added to residue obtained from the first step (F1) and adjusted with acetic acid to pH=5 then the mixture was shaken for 5h.
F3. Fe-Mn Oxide bound fraction: the residue obtained from the second step (F2) refluxed at 100ºC with 20 ml of 0.04M NH2OH.HCl in 25% (v/v) acetic acid for 6h. F4. Organic bound fraction: 3ml of 0.02M HNO3 and 5ml of 30% H2O2 were added to the residue obtained from the third step (F3) (at pH=2 with HNO3), refluxed at 100ºC for 2h. Then 3ml of 30% H2O2 was added and the mixture was refluxed for 3h. To prevent adsorption of extracted metals onto oxidized soil, 5ml of 3.2M ammonium acetate in 20% (v/v) HNO3 was added and the mixture was shaken for 2h.
Metals (Cd, Cu, Cr, Ni, Pb, Zn) content in digested soil samples were then determined using Atomic Absorption Spectrometry (Bulck Scientific 210VGP).
2.3. Quality control
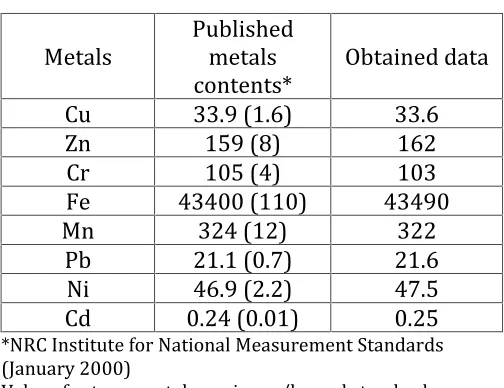
Marine sediment reference materials (MESS-3), analysis of blanks and duplicates were run with the samples to confirm validation of provided data and quality assurance of the laboratory analyses. Analysis of MESS-3 revealed satisfactory agreement with the reported data (Table 1).
Table 1.
Published and obtained data for MESS-3
Metals
Published
metals
contents*
Obtained data
Cu
33.9 (1.6)
33.6
Zn
159 (8)
162
Cr
105 (4)
103
Fe
43400 (110)
43490
Mn
324 (12)
322
Pb
21.1 (0.7)
21.6
Ni
46.9 (2.2)
47.5
Cd
0.24 (0.01)
0.25
*NRC Institute for National Measurement Standards (January 2000)
Values for trace metals are in mg/kg and standard deviations are given within parentheses.
2.4. Enrichment factor
Enrichment factor (EF) is a prevalent index to determine the degree of anthropogenic metals pollution and enrichment (Jamshidi-Zanjani and Saeedi, 2013). EF is calculated using equation 1.
d )backgroun C
C (
)sample C C ( EF
b s
b s
(1
Where, ) C C (
b s
Cs and Cb are the concentration of a given metal and reference metal, respectively. In the present study Mn and Fe content in earth crust was selected as references metals based on the literature review (Jamshidi-Zanjani and Saeedi, 2013; Abrahim and Parker, 2008). The EF value greater than unit indicate that the sample is being enriched under the effect of either anthropogenic or natural sources (Glasby and Szefer, 1998).
2.5. Geo-accumulation index
Geo-accumulation index (Igeo) firstly proposed by Muller (1969) was applied on soil samples according to equation 2.
)
B
/1.5
(C
log
I
geo
2 n
n (2Where, Cn and Bn are metal concentration in sample and background such as shale, respectively. There are seven categories of state of pollution based on Igeo calculation (Table 2).
Table 2.
Classification of pollution using Igeo (Muller, 1969)
Calculated Igeo Igeo Index State of
Pollution
>5 6 Extremely
Polluted
>4-5 5 Highly
Polluted- Extremely Polluted
>3-4 4 Highly
Polluted
>2-3 3 Moderately
Polluted-Highly Polluted
>1-2 2 Moderately
Polluted
>0-1 1 Unpolluted-
Moderately Polluted
<0 0 Unpolluted
2.6. Pollution index (Ipoll)
A newly developed index called Ipoll by Karbassi et al. (2008) used to assess metals pollution intensity according to equation 3.
)
/L
(B
Log
I
POLL
2 c p (3partitioning analysis. The pollution state in a given sample based on Ipoll is categorized as same as Igeo classification.
2.7. Risk assessment code (RAC)
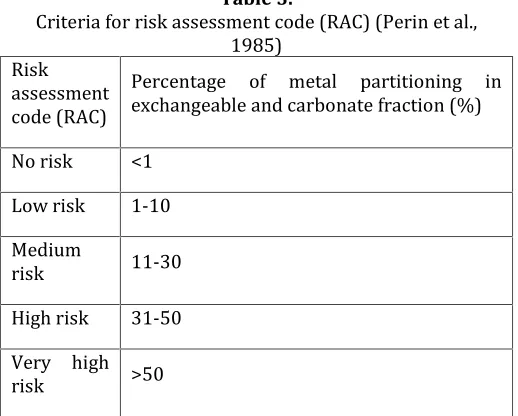
Risk assessment code (RAC) firstly proposed by Perin et al. (1985) to assess potential risk of release of metals. The risk is evaluated based on the metal fractionation study and the presence of metal in weakly bound. In other words, the percentage of metal partitioning in exchangeable and carbonate fraction makes the RAC criteria. The higher metal partitioning in weakly bounds (summation of exchangeable and carbonate fractions), reveals higher risk of release (Jain, 2004; Rath et al., 2009). The criteria and classification of RAC are presented in Table 3.
Table 3.
Criteria for risk assessment code (RAC) (Perin et al., 1985)
Risk assessment code (RAC)
Percentage of metal partitioning in exchangeable and carbonate fraction (%)
No risk <1
Low risk 1-10
Medium
risk 11-30
High risk 31-50
Very high
risk >50
2.8. Background level
There are different approaches to calculate background values of elements. The 4ó-outlier test, iterative 2ó -outlier test are prevalent approaches to determine background level based on remove outlier data among collected data. In 4ó-outlier method, mean and standard deviation (ó) are determined for the original data set then outlier data are removed according to mean ± 4ó. The mean+2ó is upper limit of background value in new data set. In iterative 2ó-outlier method, the calculated outlier data for the original data set are eliminated according to mean ± 2ó. This approach will be continued till no outliers are found in any generated data set. The mean+2ó is upper limit of background level (Matschullat et al., 2000).
3. RESULTS
3.1. Total metals content
Minimum, maximum, mean and standard deviation of metals concentration (Cu, Zn, Cr, Fe, Mn, Pb, Ni, Cd) of Shahr-e-Babak soil in totally 53 samples are presented in Table 4. Mean concentrations of Cu, Zn, Pb, and Cd are much higher than those of earth's crust. In case of Pb, and Cd the minimum contents are also higher than earth's crust content. In general, the minimum contents of metals were detected in samples from the north and north-eastern part of the study area where there is no main anthropogenic sources of pollution. The maximum metal content were detected in soil samples from south-eastern parts of the Shahr-e-Babak where is close to Khatoon-Abad Copper Smelter. Also, samples where is collected beside Maiduk Copper Complex reveal high amount of metal concentration. For example, results of chemical analysis of sample 4 reveals Cu (1707.7 mg/Kg), Zn (513.3 mg/Kg), Pb (33.4 mg/Kg), and Cd (11.2 mg/Kg) which are much higher than earth's crust contents. It seems that these parts of the study area (south-eastern and near central) are heavily affected by Khatoon-Abad Copper Smelter and Maiduk Copper Complex.
Table 4.
Metals content (mg/Kg) in soil samples of Shahr-e-Babak, Iran (n=53).
arameter Cu Zn Cr Fe Mn Pb Ni Cd
Mean 205.00 98.71 82.09 6237.31 377.57 45.96 28.04 3.60
Minimum 12.18 20.70 6.20 5809.70 190.00 20.10 2.40 0.34
Maximum 1707.70 513.30 162.20 6876.13 873.00 152.80 60.86 11.20
Std. Deviation 304.68 70.20 47.36 263.92 112.51 17.22 12.72 1.94
Median 85.66 82.10 99.83 6176.20 365.30 43.97 24.27 3.59
Geometric Mean 80.37 86.74 62.24 6231.87 363.01 44.07 24.78 3.06
Kurtosis 10.66 23.83 -1.40 -0.74 6.01 29.24 0.51 3.20
Skewness 2.84 4.36 -0.18 0.26 1.61 4.73 0.72 1.18
Earth crust
content 50 75 100 41000 950 14 80 0.2
3.2. Metal fractionation
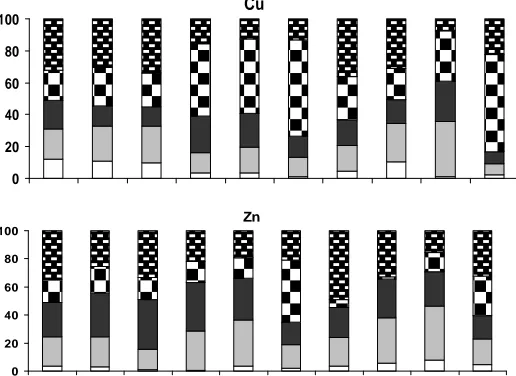
Ten soil samples were selected to study metal partitioning. The bar graph of metal partitioning in five factions is presented in Fig. 2. Based on Fig.2, geochemical fractions for Cu rank in order F4>F5>F2>F3>F1. On one hand, the higher partitioning of Cu in strong fractions (residual and organic fraction) in soil samples of Shahr-e-Babak was detected. On the other hand, partitioning of Cu in carbonate fraction is considerable. Generally, it could be concluded although residual and organic fractions are considered as the main sink of Cu, contribution of Cu in carbonate fraction may lead to considerable risk of release of Cu.
Cu
0 20 40 60 80 100
Zn
0 20 40 60 80 100
Cr
0 20 40 60 80 100
Pb
0 20 40 60 80 100
Ni
Cd
0 20 40 60 80 100
1 2 5 7 10 13 18 21 25 28
Fig. 2. Bargraph of metal partitioning in soil samples of Shahr-e-Babak
Contribution of Zn in different geochemical phase rank in order F5>F3>F2>F4>F1 indicates that residual phase and Fe-Mn oxides are the main sink of Zn in soil samples of the study area. However, portioning of Zn in carbonate fraction with the mean percent of 24.3% reveals considerable risk of release of Zn in surfacial soil samples of Shahr-e-Babak. According to Fig. 2, residual fraction is considered as the main sink of Cr in soil samples. Partitioning of Cr with the different geochemical fractions rank in order F5>F4>F2>F1>F3. It should be mentioned that, considerable amount of Cr was associated in loosely bounds (exchangeable and carbonate fractions) may indicates considerable potential risk of release of Cr in soil samples.
Contribution of Pb in different geochemical phase is in the rank of F1>F4>F5>F2>F3. Exchangeable fraction is considered as the main sick of Pb in soil samples. Besides, contribution of Pb in carbonate fraction with the mean percent of 17.3% revealed significant potential risk of release of Pb in the study area.
Results revealed that geochemical fractions for Ni rank in order F5>F2>F4>F3>F1. Although residual fraction is the main sink of Ni in soil samples, considerable partitioning of Ni in carbonate fraction with the mean percent of 33.5% indicates significant potential risk of release of Ni in the study area. According to Fig. 2, contribution of Cd in weakly bounds was quite considerable. The association of Cd with the different geochemical fractions rank in order F2>F1>F3>F5>F4. The high association of Cd with exchangeable and carbonate fractions revealed high potential risk of release of Cd in soil samples by change in physical-chemical properties (pH, redox potential) of the study area.
Generally, results of metal partitioning in soil samples of Shahr-e-Babak revealed significant contribution of analyzed metals specially Cd and Pb in loosely bounds. Thus, investigation of potential risk of release of analyzed metals could be necessary.
3.3. Clustering analysis
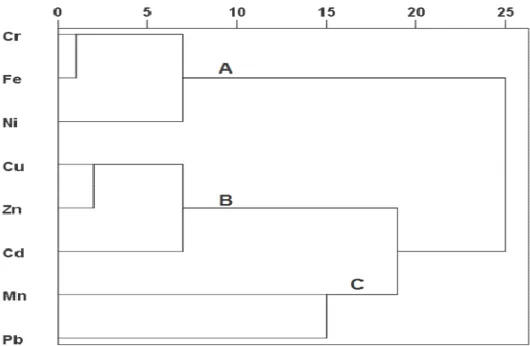
The cluster analysis (CA) was conducted to all analyzed metals content in soil samples of Shahr-e-Babak. The dendrogram of CA of variables based on Pearson Coefficient is presented in Fig. 3. According to Fig. 3 three main clusters are identified: A) Cr-Fe-Ni; B) Cu-Zn-Cd; C) Pb-Mn based on their similarities. The main cluster A contains heavy metals (Cr, Fe, and Ni) may indicates common natural sources of these elements. On the other hand, cluster B including toxic metals (Cu, Zn, and Cd) may reveals their common anthropogenic sources. Cluster C contains Pb and Mn may indicative of natural sources of Pb in the soil samples of the Shahr-e-Babak. Overall, according to CA it may be concluded that metals such as Cu, Zn, and Cd may be derived from anthropogenic sources in the study area. However, natural sources may be more effective to enrichment of metals including Cr, Ni, and Pb compared with anthropogenic sources.
Fig. 3. Dendogram of variables in soil samples of Shahr-e-Babak
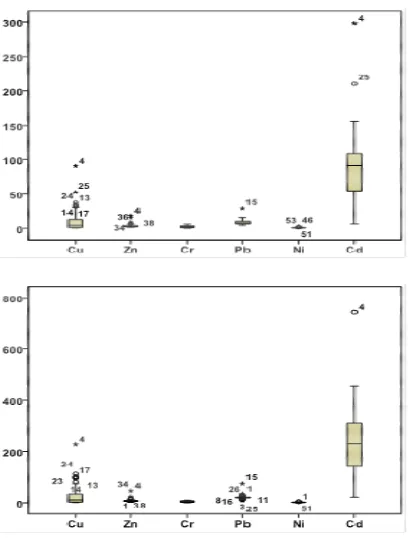
3.4. Enrichment factor (EF)
Fig. 4. Boxplot of EFs in soil samples of Shahr-e-Babak
When Mn is used as reference metal the range of EF values of toxic metals in soil samples of Shahr-e-Babak are: Cu (0.64-90.86), Zn (1.38-18.21), Cr (0.12-6.06), Pb (4.43-28.38), Ni (0.07-1.97), and Cd (6.37-297.96). On the other hand, when Fe is applied as reference metal reveals EF values in the fallowing ranges: Cu (1.56-226.87), Zn (1.85-45.46), Cr (0.41-10.2), Pb (10.08-73.56), Ni (0.2-4.73), and Cd (21.12-743.98).
Regardless of difference between EF values based on selection of Mn and Fe as reference metal, higher
enrichment of Cd, Pb, and Cu in
Shahr-e-Babak soil samples is detected. Results revealed that soil samples in south-eastern and central part of the study area where is close to Khatoon-abad Copper Smelter and Maiduk Copper Complex, respectively have higher enrichment degree than the other soil samples. Soil samples are located in north-eastern part of the study area where there is no significant anthropogenic sources, have the minimum EF values for all analyzed metals. This fact reveals the adverse effect of anthropogenic sources (Khatoon-abad Copper Smelter and Maiduk Copper Complex) in the study area in aspect of metal pollution state.
3.5. Geo-accumulation index (Igeo)
The boxplot of calculated Igeo in soil samples of the study area is depicted in Fig. 5.
Fig. 5. Boxplot of Igeo in soil samples of Shahr-e-Babak
The Igeo values vary in the following rang: Cu (-2.26_4.87), Zn 3.12_1.51), Cr 3.24_1.47), Pb 0.78_2.15), Ni (-5.41_-0.74), and Cd (0.04_5.08). Results revealed that Cd, Pb, and Cu have higher degree of pollution according to Igeo values. This fact is in accordance with EF values for analyzed metals in soil samples of Shahr-e-Babak. Also, soil samples beside the mentioned anthropogenic sources have the higher degree of pollution compared with other samples.
3.6. Risk assessment code (RAC) and pollution index (Ipoll)
Fig. 6. Boxplot of RAC and Ipoll in soil samples of Shahr-e-Babak
Overall, despite of difference between RAC and Ipoll values metals such as Cd, Pb, and Ni have the highest degree of pollution risk. According to RAC values, Cd in all soil samples categorized as very high risk which is indicated very high potential risk of release of Cd in the study area. Also, Pb and Ni have high potential risk of release. It could be concluded that Cd, Pb, and Ni may be easily released from soil in Shahr-e-Babak and be available for plant uptake. Moreover, soil samples where are closed to anthropogenic sources show higher risk of release for all analyzed metals compared with other samples. Generally, order of the potential risk of release for analyzed metals in soil samples of the study area according to mean RAC values are as: Cd>Ni>Pb>Zn>Cr>Cu. According to Ipoll values, Cd is categorized in moderately-high pollution degree in most soil samples of the study area. Moreover, Pb, Ni, and Zn are categorized as moderately pollution degree in most of the soil samples in Shahr-e-Babak.
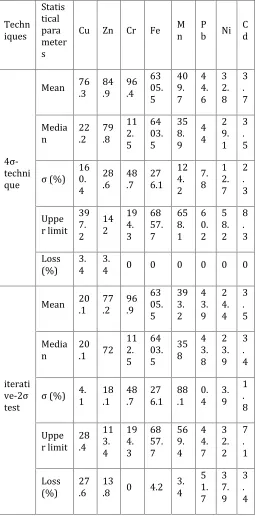
3.7. Background
Results of determination of metal background level based on 4ó-technique and iterative-2ó method in soil samples of Shahr-e-Babak are presented in Table 5. The heavily polluted samples (very close to Khatoon-Abad Copper Smelter area) were removed to calculate metal background values in a acceptably manner.
According to Table 5, there is not any significant difference between mean and median values of calculated metal background in soil samples of the study area except for Cu and Zn. According to Roca et al. (2012) the mean background value calculated based on iterative-2ó method is considered as the metal background value in Shahr-e-Babak soil samples.
Table 5.
Determination of background level soil samples of Shahr-e-Babak Techn iques Statis tical para meter s
Cu Zn Cr Fe M
n P b Ni
C d
4ó -techni que
Mean 76
.3 84 .9 96 .4 63 05. 5 40 9. 7 4 4. 6 3 2. 8 3 . 7 Media n 22 .2 79 .8 11 2. 5 64 03. 5 35 8. 9 4 4 2 9. 1 3 . 5 ó (%) 16 0. 4 28 .6 48 .7 27 6.1 12 4. 2 7. 8 1 2. 7 2 . 3 Uppe r limit 39 7. 2 14 2 19 4. 3 68 57. 7 65 8. 1 6 0. 2 5 8. 2 8 . 3 Loss (%) 3. 4 3.
4 0 0 0 0 0 0
iterati ve-2ó
test
Mean 20
.1 77 .2 96 .9 63 05. 5 39 3. 2 4 3. 9 2 4. 4 3 . 5 Media n 20 .1 72
11 2. 5 64 03. 5 35 8 4 3. 8 2 3. 9 3 . 4
ó (%) 4. 1 18 .1 48 .7 27 6.1 88 .1 0. 4 3. 9 1 . 8 Uppe r limit 28 .4 11 3. 4 19 4. 3 68 57. 7 56 9. 4 4 4. 7 3 2. 2 7 . 1 Loss (%) 27 .6 13
.8 0 4.2
3.8. New index
In the present study a new aggregative index to calculate metal pollution state called index of industrial pollution (Iind) is introduced. Where, Wi, Ci, and Bi are toxicity factor, metal concentration, and background value of a given metal in study area, respectively. The toxicity factor for a given metal is presented by Hakanson (1980). The values of Wi for Cd, Cu, Pb, Zn, and Cr are 30, 5, 5, 1 and 2, respectively (Hakanson, 1980). The proposed pollution category is as same as Ipoll and Igeo ones which is presented in Table 2.
)
W
)
B
C
(
W
(
Log
I
1 i n
1
i i
i i
2 ind
ni
(4
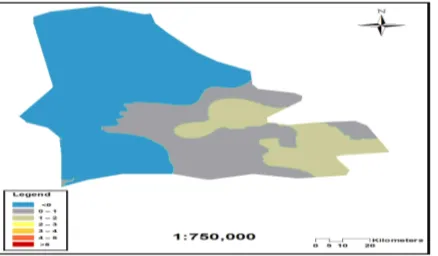
The distribution pattern of calculated Iind in soil samples of Shahr-e-Babak is depicted in Fig. 6.
Fig. 6. Distribution of calculated Iind in soil samples of Shahr-e-Babak
As depicted in Fig. 6 south-eastern and central part of the Sahr-e-Babak exhibited higher degree of metal pollution than the other part. As mentioned before, these parts are close to main anthropogenic sources of toxic metal (Khatoon-Abad Copper Smelter and Maiduk Copper Complex) and revealed higher amount of metal concentration in soil samples. Thus, higher degree of metal pollution based on calculated Iind is in accordance with the results of metal content in the study area. However, west and north part of the study area which has no main anthropogenic sources revealed unpolluted degree of metal pollution.
CONCLUSION
In the present study, the metal content in soil samples of Shahr-e-Babak has been studied. Sequential extraction method was conducted on selected soil samples to study metal fractionation and their risk of release. Enrichment factor, Geo-accumulation index, Pollution index, and risk assessment code were applied to assess soil pollution. A new index (Iind) was proposed to assess metal pollution
state in industrial area based on metal background values and their toxicity degree.
Results of EFs revealed high degree of enrichment of Cd, Pb, and Cu in soil samples of Shahr-e-Babak. Results of Igeo and EF were in agreement indicating higher degree of metal pollution in south-eastern part of the study area.
Results of metal fractionation revealed that contribution of Cd, Pb and Ni in weakly bounds is high that may lead to high risk of release of these metals in soil samples. This fact is totally in agreement with the results of risk assessment code and pollution index in the study area.
Results of new index (Iind) revealed more metal pollution in south-eastern and central part of the Shahr-e-Babak compared with other part of the study area.
Based on application of different indexes, it could be concluded that the main anthropogenic sources of metals including Khatoon-Abad Copper smelter and Maiduk Copper Complex had adverse effect on metal pollution in soil samples of the study area.
REFERENCES
Adriano DC: Trace elements in the terrestrial environment. Springer, New York press; 2001.
Abrahim GMS., Parker RJ: Assessment of heavy metal enrichment factors and the degree of contamination in marine sediments from Tamaki Estuary, Aukland, New Zealand. Environ Monit Assess 2008, 136:227-238.
Alloway B.J., Ayres D.C.,: Chemical principles of environmental pollution. CRC press; 2000.
Burt K., Wilson M.A., Keck T.J., Dougherty D.D., Strom D.E., Lindahl J.A. Trace element speciation in selected smelter-contaminated soils in Anaconda and Deer Lodge Valley, Montana, USA. Adv Environ Res 2003, 8: 51–67.
Callender G. Heavy metals in the environment, historical Trend. Treatise on Geochemistry 2003, 9: 67–105.
Calmano W., Hong J., Förstner U. Binding and mobilization of heavy metals in contaminated sediments affected by pH and redox potential. Water Sci Technol 1993, 28: 223–235.
Cambier P.Evaluation of the mobility of toxic elements in contaminated soils. Anal Mag 1997, 25: 35–38.
Chen Q. Prevention and control of environmental pollution in agriculture. Agro-Env Protection 2003, 6: 14–19.
Chen S., Zhou Q.X., Sun L.n., Sun T.H., Chao L. Speciation of cadmium and lead in soils as affected by metal loading quantity and aging time. Bull Environ Contam Toxicol 2007, 78: 184-187.
Chopin E.I., Alloway B.J. Distribution and mobility of trace elements in soils and vegetation around the mining and smelting areas of Tharsis, Riotinto and Huelva, Iberian Pyrite Belt, Sw Spain. Water Air Soil Pollut 2007,182: 245-251.
Chuan M.C., Shu G.Y., Liu J.C.Solubility of heavy metals in a contaminated soil: effects of redox potential and pH. Water Air Soil Pollut 1996, 90: 543–556.
Dijkstra E. A micromorphological study on the development of humus profiles in heavy metal polluted and non-polluted forest soils under Scots Pine. Geoderma 1998, 82: 341–358.
Din TB. Use of aluminum to normalize heavy metal data from estuarine and coastal sediments of straits of Melaka. Mar Pollut Bull 1992, 24: 484-491
Dudka S., Adriano D.C. Environmental impacts of metal ore mining and processing: a review. J Environ Qual 1997, 26:590–602.
Glasby G.P., Szefer P. Marine Pollution in Gdansk Bay, Puck Bay and the Vistula Lagoon, Poland: An Overview. Sci Total Environ 1998, 212:49-57.
Guo GL., Zhou Q.X., Koval P.V., Belogolova G.A. Speciation distribution of Cd, Pb, Cu and Zn in contaminated Phaeozem: north-east China using single and sequential extraction procedure. Aust J Soil Res 2006, 44: 135-142.
Hakanson L. Ecological risk index for aquatic pollution control, a sedimentological approach. Water Res 1980, 14: 975–1001.
Jain C.K., Metal fractionation study on bed sediments of River Yamuna, India. Water Res 2004, 38(3): 569–578.
Jamshidi-Zanjani A., Saeedi M., Li LY: A risk assessment index for bioavailability of metals in sediments: Anzali International Wetland case study. Environ Earth Sci, in press.
Jamshidi-Zanjani A., Saeedi M. Metal pollution assessment and multivariate analysis in sediment of Anzali international wetland. Environ Earth Sci 2013, 70: 1791–1808.
Karbassi A.R., Monavari S.M., Nabi Bidhendi Gh.R., Nouri J., Nematpour K. Metal pollution assessment of sediment
and water in the Shur River. Environ Monit Assess 2008, 147: 107–116.
Khorasanipour M., Aftabi A. Environmental geochemistry of toxic heavy metals in soils around Sarcheshmeh porphyry copper mine smelter plant, Rafsanjan, Kerman, Iran. Environ Earth Sci 2011, 62: 449–465.
Lim T.T., Chui P.C., Goh K.H. Process evaluation for optimization of EDTA use and recovery for heavy metal removal from a contaminated soil. Chemosphere 2005, 58: 1031–1040.
Liu J., Zhong XM., Liang YP., Luo YP., Zhu YN., Zhang XH. Fractionation of heavy metals in paddy soils contaminated by electroplating wastewater in Chinese. J Agro Environ Sci 2006, 25: 60-63.
Loring DH. Normalization of heavy-metal data from estuarine and coastal sediments. ICES J Mar Sci 2003, 48: 101-115.
Luo C., Shen Z., Li X. Enhanced phytoextraction of Cu, Pb, Zn and Cd with EDTA and EDDS. Chemosphere 2005, 59: 1–11.
Lu X., Wang L., Li LY., Lei K., Huang L., Kang D. Multivariate statistical analysis of heavy metals in street dust of Baoji, NW China. J Hazard Mater 2010, 173(1-3):744-749.
Maiz I., Arambarri I., Garcia R., Millán E. Evaluation of heavy metal availability in polluted soils by two sequential extraction procedures using factor analysis. Environ Pollut 2000, 110: 3-9.
Matschullat J., Ottenstein R., Reimann C. Geochemical background — can we calculate it? Environ Geol 2000, 39(9): 990–1000.
Meers E., Ruttens A., Hopgood MJ., Samson D., Tack EMG. Comparison of EDTA and EDDS as potential soil amendments for enhanced phytoextraction of heavy metals. Chemosphere 2005, 58: 1011–1022.
Merain E., Anke M., Inant M., Stoeppler M. Elements and their compound in the environment. Wiley-VCH VERLAG GMBH & CO, KGA, Weinheim, 2004.
Müller G., Index of geoaccumulation in the sediments of the Rhine River. Geojournal 2008, 2: 108–118.
Niencheski L.F.H., Baraj B., Franca R.G., Mirlean N. Lithium as a normalizer for the assessment of anthropogenic metal contamination of sediments of the southern area of Patos Lagoon. Aquat Ecosyst Health 2002, 5(4): 473-483.
statistical technique for quantifying metal pollution in highly polluted aquatic sediments-a case study: Brahmani and Nandira Rivers, India. J Hazard Mater 2009, 163(2–3): 632–644.
Ravichandran M., Baskaran M., Santschi P.H., Bianchi T. History of trace metal pollution in Sabine-Neches Estuary, Beaumont, Texas. Environ Sci Technol 1995, 29: 1495-1503.
Roca N., Pazos M.S., Bech J. Background levels of potentially toxic elements in soils: A case study in Catamarca (a semiarid region in Argentina). Catena 2000, 92: 55-66.
Saeedi M., Li LY., Karbassi A.R., Zanjani A.J. Sorbed metals fractionation and risk assessment of release in river sediment and particulate matter. Environ Monit Assess 1993, 185: 1737–1754.
Saracoglu S., Soylak M., Elci L. Extractable trace metals contents of dusts of air filters from vehicles by sequential extraction procedure. J AOAC Int 2009, 92: 1196–1202.
Selim H.M., Sparks D.L. Heavy metals release in Soils. CRC Press; 2001.
Selinus O. Essential of medical geology, impacts of the natural environment of public health. Amsterdam: Elsevier; 2005.
Siegel F.R. Environmental geochemistry of potentially toxic metals. Springer, Heidelberg; 2004.
Sheppard D.S., Claridge GGC, Campbell IB: Metal contamination of soils at Scott base, Antarctica. Appl Geochem 2000, 15: 513–530.
Soylak M., Turkoglu O. Trace metal accumulation caused by traffic in agricultural soil near a motorway in Kayseri-Turkey. J Trace Microprobe Tech 1999, 17:209–217.
Stewart C.Spatial and temporal trends in trace metal deposition in Canterbury, New Zealand. Ph.D. thesis, University of Canterbury, Christchurch, NewZealand; 1989.
Tumuklu A., Yalcin M.G., Sonmez M. Detection of heavy metal concentrations in soil caused by Nigde City Garbage Dump. Polish. J Environ Stud 2007, 16:651–658.
US EPA., Test Methods for Evaluating Solid Waste Physical/chemical Methods, SW-846. 2010.
Valery B., Eugene K. Soil surface geochemical anomaly around the copper–nickel metallurgical smelter. Water Air Soil Pollut 1998, 103: 197–218.