ESTIMATING INFORMAL TRADE STATISTICS USING RATIO ESTIMATION
METHOD: A CASE STUDY OF KENYA
Anthony Makau*, William L. EtwasiStatistician*
*Macroeconomic Statistics, Kenya National Bureau of Statistics, Nairobi, Kenya
Keywords: Informal Cross Border Trade (ICBT), Macroeconomic statistics, External trade statistics, Ratio estimation, Up-rating, Auxiliary information
Abstract
Informal Cross Border Trade (ICBT), macroeconomic statistics in nature, forms bulk of the unrecorded economy. Unrecorded ICBT statistics leads to incomplete macroeconomic statistics despite the international best practices recommendations that compilation of macroeconomic statistics should be comprehensive and complete. ICBT has a positive social impact such as job creation and poverty alleviation especially to the rural population and has the potential to support Africa’s on-going efforts of poverty eradication, if properly harnessed. This study aimed at determining the magnitude of unrecorded trade between Kenya and her neighbours, in a bid to derive an estimator which will be able to estimate informal trade statistics. These estimates will be used to adjust the formal external trade statistics resulting to a comprehensive, reliable, consistent and complete external trade statistics. A series of cross border surveys conducted by Kenya National Bureau of Statistics on selected border station for the years 2011 to 2016 informed our data source. Preliminary results showed that most of Kenya’s informal exports were destined to Tanzania and Ethiopia through Isebania, Mandera and Moyale border stations. These commodities were mainly industrial in nature such as cooking fats and oils, wheat flour, cement and paraffin. Informal imports on the other hand were sourced from Uganda and Tanzania through Busia, Isebania and Malaba. These were mainly agricultural such as dry maize, bananas, beans, fish and fruits. All these were mainly transported by bicycles, push/hand carts and motor cycles. The ratio estimator of formal and informal trade between the Kenya and her neighbours was computed. Since a positive correlation exists between the two trade types and given the reliability and consistency of the formal trade, the value of informal export or import can be estimated as a function of the estimator and the respective formal trade at any given period. This estimation method will have minimized the seasonality effects and the inclusion of these estimates will narrow the completeness and comprehensiveness gap of the country’s economy.
Introduction
Background of the study
Comprehensive coverage of a country’s economy, often hindered by gaps in the recording of economic activity of the so called unrecorded economy, is one of the significant requirements in compilation of macroeconomic statistics according to the international best practices. Informal Cross Border Trade (ICBT), which is macroeconomic in nature, forms bulk of the unrecorded economy. The evolution of formal cross-border trade is a reflection of trade and economic integration policies, whereas informal cross-border trade reflects longstanding relationships between neighbouring countries and communities at the border points. The dynamics in trade patterns often explain economic situations and trade facilitation among trading partners during a particular period.
Review of previous studies on the subject of study
the informal sector, strengthens regional integration and relationships. Despite the economic benefits reaped from ICBT such as poverty eradication, Nyatangaet. al., (2000) also observed that ICBT contributes to increased cases of prostitution, divorce and single parent families. In their study, Mupedziswa and Gumbo (2001) found that informal cross border activities strengthened family relations as traders’ extended financial assistance to their relatives and spouses. Study by Nyatangaet. al., (2000) acknowledged the role of ICBT especially to the rural Africa population in providing employment, supplementing other incomes and on improving food security. This is despite the worsening macro-economic environment in Zimbabwe, which just like other developing countries in Africa, face a huge unemployment rate. Gaidzanwa (1997) study on “Cross Border Trade in Southern Africa: “A Gendered perspective”, the author argues about the hypothesis that ICBT cannot be secluded from the gender roles. Her study revealed that women traders are so creative in trading and the formal traders have a lot to learn from the operations of their female counterparts.
Statement of the problem
Trade information is useful for monitoring performance of the trade sector to inform formulation of sound trade policies necessary for economic development and regional economic integration. Lack of data on informal trade implies incomplete external trade statistics to inform these policies. Preliminary analysis of the data collected for the first four cycles of ICBT shows that there exists a lot of cross-border trade between Kenya and her neighbours which remains largely unrecorded. Therefore, the need for comprehensive, reliable, consistent and complete trade statistics cannot be overemphasized.
Significance of the Study
The study will generate reliable adjustment ratios on informal trade transactions which will be appropriate in improving the coverage and completeness of external trade statistics. The study will highlight the economic interdependence between the regional states, help review export performance of the country in terms of the product basket, growth of leading informal export products and the dynamics of international demand for these products.
Objectives
Overall objectiveDetermine the magnitude of unrecorded trade between Kenya and her neighbours in a bid to derive an estimator which will be able to estimate yearly informal trade statistics.
Specific objectives
Estimate the magnitude of unrecorded trade
Determine the composition and direction of unrecorded trade
Provide a comparative analysis of recorded and unrecorded trade
Derive a ratio estimator which will be able to estimate yearly informal trade statistics given the formal trade statistics
Study limitations
Estimation depends on data collected for two weeks instead of four weeks in a month which affects the proper estimation of total trade as business activities may not be homogeneous for the entire month. Thus the estimates derived from this sample may be affected by sampling and non-sampling errors.
Not all trade activities were captured due to the open stretch and time at which the cross border transactions took place. Moreover, data may have coverage errors due to security and logistical challenges of some border points such as Liboi and Lamu. Consequently, the data might not be included despite its significant contribution in the estimation of the total trade.
Methodology
IntroductionThis chapter highlights an overview of the ratio estimation theory, the up-rating model and how the model will apply the ratio estimation to estimate the informal trade given the formal trade.
Ratio estimation theory
The ratio between two population values is a population parameter. If 𝑦𝑖 is the value of the 𝑖𝑡ℎ unit in the sample and 𝑥𝑖 is the auxiliary information for the 𝑖𝑡ℎ unit in the sample, then, the ratio between the two can be used to estimate the total value of the 𝑖𝑡ℎ unit in the population once the auxiliary information for the 𝑖𝑡ℎ unit in the population is known. Thus,
𝑟𝑖= 𝑦𝑖 𝑥𝑖
𝑟̅ =1 𝑛∑ ri
i=1 =1
𝑛∑ yi xi i=1
𝑅̂𝑛= ∑𝑛𝑖=1𝑦𝑖 ∑𝑛𝑖=1𝑥𝑖
𝑌 = 𝑅̂𝑛𝑋(2) 𝑅̂𝑛is the Ratio estimator of the population value and the product of 𝑅̂𝑛 and X provides an estimation of the population value Y. One of the significance of using the ratio estimation method is to increase the precision of the estimated population value, especially, if there exist a positive correlation between 𝑋 and 𝑌. Moreover, it corrects possible variances introduced through sampling (sampling errors) if 𝑋 is known.
Estimation of the total Informal Trade using ratio estimation method Up-rating model
Up-rating of the results will be necessary in order to generate yearly estimates from the two weeks of data collection.
The model will be based on the following assumptions:
Informal trade data was collected for two weeks for each of the selected border on randomly selected months for each year.
The supply and demand of trade commodities from either side of the border remain the same for that particular month of data collection.
The informal trade assumes the trend of the formal trade throughout the year.
Under assumption (ii) above, if N is the number of all commodities traded informally in all border points and
ωij is the daily value of the ithcommodity traded during the jth day of data collection period, then the total value of all products traded in the jth day of the survey period can be expressed as:
μj= ∑ ωij N
i=1
, for j = 1,2, … ,14(3)
The total value of informal trade αt up-rated for all the products in a particular month t of data collection can be expressed as;
αt= δ ∑ μj 14
j=1 (4)
Whereδ = {
2.21, 𝑖𝑓 the month has 31 days 2.14, 𝑖𝑓 the month has 30 days 2.07, 𝑖𝑓 the month has 29 days 2.00, 𝑖𝑓 the month has 28 days
This will be the up-rating factor from the value recorded in the two weeks of data collection to the total estimate value of informal trade for that particular month.
To get the estimated value of informal trade 𝜃 for the year under assumption (iii), the up-rated monthly informal trade data for each border station 𝛼𝑡 is summed up to the country level 𝛼𝑇. Formal trade data for that particular month by particular border stations 𝜋𝑡 is similarly summed up to the country level 𝜋𝑇 and the two values are compared to generate a ratio as follows:
𝑟𝑡= ∑ 𝛼𝑡 𝑡 ∑ 𝜋𝑡 𝑡
=𝛼𝑇 𝜋𝑇
= 𝑟𝑇(5)
Where 𝐸(𝑟𝑇) = 𝑅̂𝑇
𝜃̂ = 𝑅̂𝑇𝜑(6)
The estimated value of informal trade will be used to adjust the formal external trade statistics resulting to comprehensive, reliable, consistent and complete external trade statistics.
Results and discussion
IntroductionThis chapter highlights the source of data used in the study, sample size used and the results, and discussions of the study.
Data source
The study used secondary data derived from a series of Informal Cross Border Trade surveys conducted by Kenya National Bureau of Statistics on selected border stations between Kenya and her neighbours for the years 2011 to 2016. However, the study was not conducted in 2013 and as a result an estimate was imputed.
Study design
Data from 12 sampled border stations was used; 3 along Kenya-Uganda border, 6 along Kenya-Tanzania border, 1 along Kenya-South Sudan border, 1 along Kenya-Ethiopia border and 1 along Kenya-Ethiopia and Somalia. Preliminary analysis
Magnitude informal trade
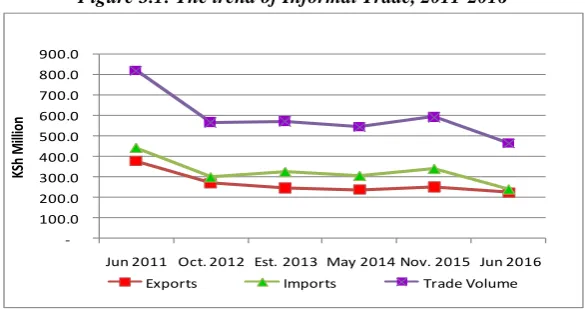
Table 3.1: Summary of Informal Trade, 2011-2016 KSh Million
Trade Flow Jun 2011 Oct. 2012 Est. 2013 May 2014 Nov. 2015 Jun 2016
Exports 375.67 268.52 246.94 238.13 252.70 225.79
Imports 442.41 298.04 324.44 305.34 339.29 238.96
Trade Volume 818.08 566.56 571.38 543.47 591.99 464.75 Trade Balance (66.75) (29.53) (77.50) (67.21) (86.60) (13.17)
Cover Ratio 84.91 90.09 76.11 77.99 74.48 94.49
The trend of informal trade has been on the decline, with the highest volume of informal trade recorded during the periods 2011 to 2016 being in June 2011, with informal imports accounting for 54.1 per cent of total informal trade. During the review period, Kenya recorded an informal trade balance deficit, with the highest deficit of KSh 86.6 million being recorded in November 2015 following the high demand of agricultural informal imports.
Figure 3.1: The trend of Informal Trade, 2011-2016
-100.0 200.0 300.0 400.0 500.0 600.0 700.0 800.0 900.0
Jun 2011 Oct. 2012 Est. 2013 May 2014 Nov. 2015 Jun 2016
KS
h
M
ill
ion
Exports Imports Trade Volume
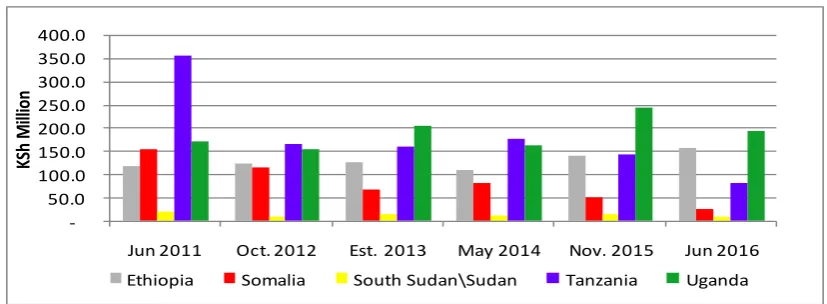
Table 3.2: Informal Trade Flow by Country, 2011-2016 KSh Million
Jun 2011 Oct. 2012 Est. 2013 May 2014 Nov. 2015 Jun 2016
Exports Imports Exports Imports Exports Imports Exports Imports Exports Imports Exports Imports
Ethiopia 65.14 52.64 73.17 51.25 78.18 47.58 84.11 25.58 71.56 68.34 105.79 51.04
Somalia 43.36 111.26 25.22 88.59 5.57 61.53 5.78 76.57 5.31 46.29 25.20 0.12 South
Sudan
18.42 0.04 7.39 0.09 12.67 0.66 11.43 0.26 13.72 1.03 7.09 0.15
Tanzania 175.97 180.40 109.22 57.14 75.67 84.30 75.06 101.86 75.41 66.36 51.99 30.24 Uganda 72.76 98.08 53.52 100.98 74.85 130.37 61.75 101.06 86.69 157.27 35.72 157.40
Total 375.67 442.41 268.52 298.04 246.94 324.44 238.13 305.34 252.70 339.29 225.79 238.96
There seems to exist a shift of destination of the country’s informal exports from Tanzania in June 2011 and October 2012 to Uganda in November 2015 and to Ethiopia in June 2016, respectively. For instance, Ethiopia was the single largest destination of informal exports valued at KSh 105.8 million, representing 46.9 per cent of total informal exports. In June 2011, Tanzania and Somalia were the major sources of informal imports, with the value of informal imports from Tanzania standing at KSh 180.4 million, whereas, the value of the informal imports from Somalia was KSh 111.3 million. Similarly, in November 2015 and June 2016 the highest value of imports was from Uganda at KSh 157.3 million and KSh 157.4 million, respectively.
Figure 3.2: The trend of Informal Trade by Country, 2011-2016
-50.0 100.0 150.0 200.0 250.0 300.0 350.0 400.0
Jun 2011 Oct. 2012 Est. 2013 May 2014 Nov. 2015 Jun 2016
KS
h
M
ill
io
n
Ethiopia Somalia South Sudan\Sudan Tanzania Uganda
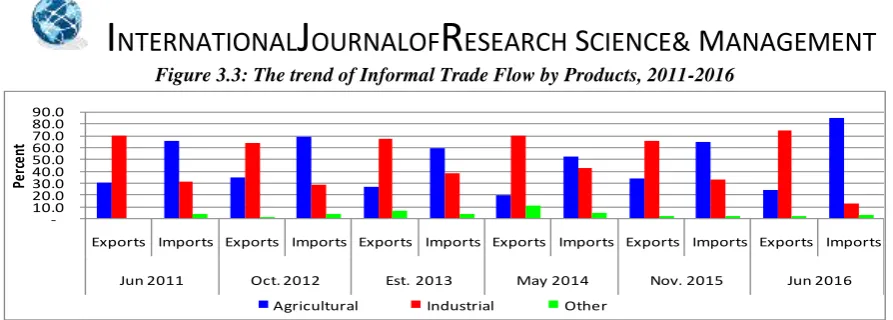
Composition of informal trade
Industrial products constituted the bulk of total informal exports for the periods 2011 to 2016, with the highest value of industrial commodities exported through informal trade being recorded in June 2016, with a share of 74.2 per cent of total informal exports as shown in Table 3.3 and Figure 3.3. Agricultural products dominated informal imports accounting for 84.8 per cent of total informal imports recorded in June 2016. Most of the industrial products exported included fertilizer, wheat flour and cooking oil, while the agricultural informal imports were mainly maize, beans, fish, ground nuts and oranges.Other commodities included charcoal, firewood and water.
Table 3.3: Percentage of Informal Trade Flow by Product, 2011-2016
Jun 2011 Oct. 2012 Est. 2013 May 2014 Nov. 2015 Jun 2016
Commodit y
Export s
Import s
Export s
Import s
Export s
Import s
Export s
Import s
Export s
Import s
Export s
Imports
Agricultural 30.0 64.9 34.8 68.6 26.5 58.8 19.3 52.1 33.1 64.7 24.0 84.8
Industrial 69.6 30.8 63.7 27.8 67.3 37.5 69.9 42.7 65.0 33.0 74.2 12.1
Other 0.4 4.3 1.6 3.5 6.1 3.6 10.8 5.2 1.9 2.3 1.7 3.1
Figure 3.3: The trend of Informal Trade Flow by Products, 2011-2016
-10.0 20.0 30.0 40.0 50.0 60.0 70.0 80.0 90.0
Exports Imports Exports Imports Exports Imports Exports Imports Exports Imports Exports Imports
Jun 2011 Oct. 2012 Est. 2013 May 2014 Nov. 2015 Jun 2016
Pe
rc
en
t
Agricultural Industrial Other
Composition, direction and magnitude of informal trade
Generally, Ethiopia and Tanzania were the leading destinations of Kenya’s industrial products, collectively accounting for 76.9 per cent of the country’s total value of industrial products, during the month of June 2016. Uganda was the main source of agricultural products during the review period, with the value of informal agricultural imports from Uganda amounting to KSh 143.7 million, representing 70.9 per cent of total informal agricultural imports.
Composition, direction and magnitude of informal trade by
border station
The highest transactions of informal trade were recorded in Busia, Mandera, Moyale and Isebania, jointly accounting for more than 69 per cent of the total informal trade volume in June 2016. Most of informal exports were through Mandera and Isebania accounting for 23.5 per cent and 17.7 per cent of the total informal exports on average during the entire period under study.
Figure 3.4: The trend in Informal Exports by border station, 2011-2016
-5.0 10.0 15.0 20.0 25.0 30.0 35.0 40.0
Jun 2011 Oct. 2012 Est. 2013 May 2014 Nov. 2015 Jun 2016
Pe
rc
en
t
Busia Moyale Malaba Mandera Taveta Namanga Isebania Others*
On the other hand, during the review period, value of informal imports through Mandera and Busia jointly accounted for 57.0 per cent of the total informal import bill on average. The main informal exports through Mandera border were khat (miraa), tea leaves and spices, while wheat flour and sugar were the leading informal imports. Busia border was a major point of entry of fish, beans and oranges.
Figure 3.5: The trend in Informal Imports by border station, 2011-2016
-10.0 20.0 30.0 40.0 50.0 60.0
Jun 2011 Oct. 2012 Est. 2013 May 2014 Nov. 2015 Jun 2016
P
e
rc
e
n
t
Busia
Moyale Malaba
Mandera Taveta
Namanga Isebania
Others*
Bicycles, push/hand cart and motorcycles were the most preferred mode of transportation for the informal trade. In June 2016, 53.7 per cent of the total volume of informal trade was transported using bicycles and push/hand carts, as presented in Table 3.4 and Figure 3.6.
Table 3.4: The Magnitude of Informal Trade by Mode of Transport, 2011-2016 KSh Million
Mode of Transport Jun 2011 Oct. 2012 Est. 2013 May 2014 Nov. 2015 Jun 2016 Animal 55.89 0.78 36.24 65.89 1.84 13.18 Bicycle 218.52 223.57 184.79 142.10 229.97 135.68 Boat/Canoe 53.04 .. 57.50 51.16 63.38 13.04 Head/ Hand 161.56 27.49 27.82 29.28 25.72 33.82 Push Cart/Hand Cart 169.75 77.73 111.03 120.53 97.63 113.73 Vehicle 56.93 105.76 58.18 48.99 67.54 66.85 Motor cycle/ TukTuk 78.38 130.13 93.39 81.65 105.17 82.94 Wheel Barrow 24.02 1.11 2.43 3.87 0.75 5.51 Total 818.08 566.56 571.38 543.47 591.99 464.75
Figure 3.6: The Informal Trade by mode of Transport, June 2016
Animal 3% Bicycle 29% Boat/Canoe 3% Head/ Hand 7% Push Cart/Hand Cart 25% Vehicle 14%
Motor cycle/ Tuk Tuk 18%
Wheel Barrow 1%
Comparative analysis of recorded and unrecorded trade
Both formal and informal exports between Kenya and her neighbours showed declining trend during the period under study, as shown in Table 3.5. Formal imports showed mixed performances while informal imports showed an upward trend after a decline in October 2012.
Table 3.5: A comparison Table of the Formal and Informal Trade, 2011 – 2016 KSh Million
Jun 2011 Oct. 2012 May 2014 Nov. 2015 Jun 2016
Trade Type Imports Exports Imports Exports Imports Exports Imports Exports Imports Exports
Formal Trade 3,920.81 14,012.94 2,695.95 13,410.02 2,576.48 12,250.76 3,741.59 11,029.73 2,996.48 10,795.70 Informal Trade 442.41 375.67 298.04 268.52 305.34 238.13 339.29 252.70 238.96 225.79 Total Trade 4,363.22 14,388.61 2,993.99 13,678.54 2,881.82 12,488.89 4,080.89 11,282.43 3,235.44 11,021.49
Informal to
Formal (%) 11.28 2.68 11.06 2.00 11.85 1.94 9.07 2.29 7.97 2.09
Kenya’s informal exports accounting for 43.1 per cent of the country’s informal exports in November 2015, as presented in Table 3.6.
Table 3.6: Share of Formal and Informal Trade by Country, 2011-2016
Imports Exports
Jun 2011
Oct. 2012
May 2014
Nov. 2015
Jun 2016
Jun 2011
Oct. 2012
May 2014
Nov. 2015
Jun 2016
Ethiopia Formal 1.2 1.2 1.3 1.1 0.9 3.8 2.1 6.1 4.9 6.5
Informal 11.9 17.2 8.4 20.1 21.4 17.3 27.2 35.3 28.3 46.9
Somalia Formal 0.0 0.0 0.2 0.1 0.0 9.0 13.1 8.4 11.2 12.0
Informal 25.1 29.7 25.1 13.6 0.1 11.5 9.4 2.4 2.1 11.2 South Sudan Formal 0.0 0.0 0.0 0.0 0.0 15.7 11.4 10.9 9.9 12.7
Informal 0.0 0.0 0.1 0.3 0.1 4.9 2.8 4.8 5.4 3.1
Tanzania Formal 68.0 44.2 70.8 23.3 42.4 23.1 32.4 34.9 30.9 25.6 Informal 40.8 19.2 33.4 19.6 12.7 46.8 40.7 31.5 29.8 23.0 Uganda Formal 30.9 54.6 27.6 75.5 56.6 48.3 41.0 39.7 43.1 43.2 Informal 22.2 33.9 33.1 46.4 65.9 19.4 19.9 25.9 34.3 15.8
The study showed that, the bulk of formal export was through Malaba accounting for more than 20 per cent of the total formal exports on average during the review period, while informal export was mainly through Mandera accounting for 27.0 per cent and 37.0 per cent of the total informal exports in November 2015 and June 2016, respectively. Busia and Namanga were the key entry stations of the country’s formal imports jointly accounting for 50.5 per cent and 71.3 per cent of the total formal imports in November 2015 and June 2016, respectively. However, during the review period there was a shift in border station through which high volumes of informal imports entered the country. Mandera was leading in the first three study periods by 32.1 per cent on average and Busia leading in the last two research periods by 36.5 per cent and 53.1 per cent in November 2015 and June 2016, respectively.
Notably, informal trade through Mandera was more significant as compared to the formal trade mainly due to the movement of livestock across the border.
Informal trade statistics ratio estimator
The ratio between the formal and informal trade of Kenya and her neighbours was computed. During the period 2011 to 2016, formal exports were significantly higher as compared to the informal exports with the latter accounting for 2 per cent of the formal exports on average for the five countries.
Table 3.7: Ratio Estimator of Informal to Formal Exports, 2011-2016
Jun 2011 Oct. 2012 May 2014 Nov 2015 Jun 2016
Ethiopia 12.3 25.8 11.2 13.3 15.0
Somalia 3.4 1.4 0.6 0.4 1.9
South Sudan 0.8 0.5 0.9 1.3 0.5
Tanzania 5.43 2.51 1.75 2.21 1.88
Uganda 1.07 0.97 1.27 1.83 0.77
Total 2.68 2.00 1.94 2.29 2.09
During the review period, both formal and informal trade exhibited mixed performance with either type of trade being higher than the other simultaneously for Ethiopia, Somalia and South Sudan. On average, informal imports could only account for 10.2 per cent of the formal imports taking into account the five neighbour countries.
Table 3.8: Ratio of Informal to Formal Imports, 2011-2016
Jun 2011 Oct. 2012 May 2014 Nov 2015 Jun 2016
Ethiopia 116.1 164.6 77.3 167.6 190.2
South Sudan 34.1 38.5 21.7 .. 34.0
Tanzania 6.77 4.79 5.58 7.62 2.38
Uganda 8.10 6.86 14.21 5.56 9.28
Total 11.28 11.06 11.85 9.07 7.97
respective formal trade at a given period. This will have minimized the seasonality effects and the inclusion of these estimates will narrow the complete and comprehensive gap of the country’s economy.
Conclusion
From the analysis results, it is evident that informal cross border trade between Kenya and her neighbours is significant. However, seasonality effect due to rainfall patterns affects the constant flow in agricultural products. Ratio estimation of informal trade will minimize the seasonality effects and the inclusion of the informal trade estimates will narrow the completeness and comprehensiveness gap of the external trade statistics, Balance of Payment statistics and the country’s economy. This will go a long way in policy formulation regarding regional economic integration and settling trade disputes among others.
References
[1] A. M. Bloem,and M. L. Shrestha, Comprehensive measures of GDP and the unrecorded economy, New York, USA. (2000).
[2] Gaidzanwa, R. (1997). Cross Border Trade in Southern Africa: A Gendered perspective. SAPES Books: Harare.
[3] Kachere, W. (2011). Informal Cross border Trade and Poverty Reduction in Southern Africa: Informal Crossborder Trade and Poverty Reduction in Southern Africa Development Community (SADC). The Case of Zimbabwe, Lap Lambert Academic Publishing GmbH KG.
[4] Lohr, S. L., (2010). Sampling: Design and Analysis, 2nd Edition, Arizona State University
[5] Mupedziswa, R. and Gumbo, P. (2001) Women Informal Traders in Harare and the Struggle for Survival in an Environment of Economic Reforms, Elanders Digital tryck Ab, Göteborg, Sweden. [6] Mwaniki, J. (1998). The Impact of Informal Cross Border Trade on Regional Integration in SADC and
Implication for Wealth Creation. IRED-ESA.
[7] Nyatanga, P., Mpofu, S., Tekere, M., (2000). Informal Cross-border Trade: Salient Features and Impact on Welfare: Case Studies of Beitbridge and Chirundu Border Posts and Selected Households in Chitungwiza. Harare: Friedrich-Ebert-Stiftung/Trade & Development Studies Centre.