Nevin, Owen and Gilbert, Barrie K. (2000) Evaluation of a model bear viewing programme at Glendale River with policy recommendations. Department of Fisheries & Wildlife, Utah State University, Utah, US. (Unpublished)
Downloaded from: http://insight.cumbria.ac.uk/id/eprint/878/
Usage of any items from the University of Cumbria’s institutional repository ‘Insight’ must conform to the following fair usage guidelines.
Any item and its associated metadata held in the University of Cumbria’s institutional repository Insight (unless stated otherwise on the metadata record) may be copied, displayed or performed, and stored in line with the JISC fair dealing guidelines (available here) for educational and notforprofit activities
provided that
• the authors, title and full bibliographic details of the item are cited clearly when any part of the work is referred to verbally or in the written form
• a hyperlink/URL to the original Insight record of that item is included in any citations of the work
• the content is not changed in any way
• all files required for usage of the item are kept together with the main item file.
You may not
• sell any part of an item
• refer to any part of an item without citation
• amend any item or contextualise it in a way that will impugn the creator’s reputation
• remove or alter the copyright statement on an item.
The full policy can be found here.
Evaluation of a model bear viewing program
at Glendale River with policy recommendations
Funded By:
Grizzly Bear Trust Fund
Knight Inlet Resort
Department of Fisheries & Wildlife
Utah State University
5210 Old Main Hill
Logan, Utah, USA
84322-5210
Prepared by:
Owen T Nevin and Barrie K Gilbert, Ph.D.
Contents
Tables ... 4
Figures... 4
1. Introduction ... 5
2. Methods ... 6
3. Summary of Results... 7
4. Human Activity Patterns ... 7
4.1. Daily and Seasonal Patterns... 7
4.1.1. Bear Viewing... 7
4.1.2. Fisheries Management... 8
4.1.3. Hunting... 9
4.2. Other Bear Viewing Sites ... 9
4.2.1. Behavioral Response ... 9
4.2.2. Proximity of Viewers to Bears ... 10
4.2.3. Wildlife Professionals ... 10
5. Bear Activity Patterns... 11
5.1. Age/Sex Class Distribution of Population ... 11
5.2. Time Spent Fishing ... 12
5.2.1. Analysis by Age/Sex Class ... 12
5.2.2. Analysis for all Bears ... 13
5.3. Fish Capture Rates ... 13
5.4. Spatial Distribution of Bears Approaching and Leaving the Weir ... 13
5.5. Effects of Bear Viewing Tours on Adult Social Behavior ... 14
5.6. Bio-Energetic Effects of Disturbance on Bears ... 14
6. Safety ... 14
6.1. Visitor Accommodation... 15
6.2. Attractants ... 15
6.3. Supervision of Visitors ... 15
6.4. Habituation and the Potential for Problem Bears ... 16
7. Management and Policy Options... 16
7.1. Options For British Columbia... 17
7.1.1. Option 1... 17
7.1.2. Option 2... 17
8. Recommendations ... 18
8.1. Knight Inlet ... 18
8.1.1. Viewing Infrastructure ... 18
8.1.2. Management of Viewing... 19
8.1.2.1. Setting and controlling viewing periods... 19
8.1.2.2. Training of guides... 19
8.1.2.3. MELP review/visitation... 20
8.1.3. Hunting... 20
8.1.4. Research ... 20
8.1.4.1. Home ranges of bears using this area ... 20
8.1.4.2. Availability of alternative feeding sites... 20
8.2. British Columbia Coast... 21
8.2.1. Management of Viewing Locations ... 21
8.2.2. Hunting... 21
8.2.3. Research ... 21
9. References ... 22
Tables
Table 5.1.1: Identified Bears ... 11Table 5.1.2: Age/Sex Class Distributions ... 12
Table 5.2.1: Time Spent Fishing ... 12
Table 5.2.2: Time Spent Fishing ... 13
Table 5.3.1: Fish Capture Rates ... 13
Figures
Figure 2.1: Site Map... 25Figure 4.1.1: Comparing Viewing Periods for Different User Groups... 26
Figure 4.2.2.1: Bear Viewing at Brooks River... 27
Figure 4.2.2.2: Bear Viewing at Anan Creek... 28
Figure 5.1.1: Population of Identified Bears ... 30
Figure 5.1.2: Proportion of Observed Bear Minutes by Age/Sex Class - Tours Absent .. 31
Figure 5.1.3: Proportion of Observed Bear Minutes by Age/Sex Class - Tours Present .. 32
Figure 5.2.1: Mean Time Spent Fishing by Age/Sex Class - Tours Absent ... 33
Figure 5.2.2: Mean Time Spent Fishing by Age/Sex Class - Tours Present... 34
Figure 5.2.4: Maximum Observed Time Spent Fishing - Regression... 35
Figure 5.4.1: Arrival Distribution - Tours Absent ... 36
Figure 5.4.2: Departure Distribution - Tours Absent ... 37
Figure 5.4.3: Arrival Distribution - Tours Present ... 38
Figure 5.4.4: Departure Distribution - Tours Present... 39
Figure 5.6.1: Bio-Energetic Effects of Disturbance... 40
Figure 8.1.1.1: Access Ramp ... 41
Figure 8.1.1.2: Roadway ... 42
Figure 8.1.1.3: Raised Walkway ... 43
1.
Introduction
The Pacific mid-coast region of British Columbia has a mild, hypermaritime climate that places its biological productivity in the range of tropical rainforests. The low elevation river valleys are characterized by rich alluvial soils, further enriched annually by
upstream nutrients flooding over the stream banks of the floodplains and distributing rich silt to the roots of giant Sitka spruce and Western hemlock forests.
Unique to Canada's rivers flowing into the Pacific (but not north into the Mackenzie River, for example) are the massive contributions of nutrients from the bodies of 5 species of anadromous salmonids. This flux of organic matter has long been recognized as essential to the production of young salmon but the additional fertility increment to riparian and upland forests is currently under intense investigation (Bilby et al. 1996; Cederholm et al. 1989; Willson et al. 1998). The role of migratory salmon in supporting dense populations of grizzly bears has recently been demonstrated for a large sample of coastal bears in Alaska (Miller et al 1997). A strong statistical correlation between the per cent of meat, mainly salmon, in the diet and bear density (Hilderbrand et al 1999) confirmed earlier speculation by Miller et al. (1997) that Alaskan's most dense bear populations also had high salmon diets and were among the most dense on a world-wide basis.
Grizzly or brown bears on the coast of British Columbia and Alaska are the same species as the grizzly bears of the Rocky Mountains. However they are much bigger and have higher population densities because of abundant of salmon (Hilderbrand et al. 1999). Alaska population densities vary from a maximum of 550 bears /1000 sq. km in Katmai National Park where salmon are seasonally available to less than 5 for mountain bears of the eastern Brooks Range on a marginal food base (Miller et al. 1997).
Coastal Alaskan bears forage widely for fish. At Brooks River in Katmai National Park & Preserve bears feed on sockeye salmon starting in late June as soon as they enter rivers to spawn. Hundreds of bears have daily access to salmon when the salmon are rich in fat, a fuel used to ascend rivers, build redds, mate and defend their nests against others. Bears feed on these fish which have 50% of their caloric value in fat. From Katmai's Brooks falls bears migrate with the fish to their spawning beds and, later, back to the stream mouths where the dying fish are again consumed in prodigious numbers. The end result of this movement is a pattern of deposition of fish pieces and feces over the
Many of the Alaskan sites with the highest bear densities have become popular, and profitable, tourist destinations. More recently a bear viewing/eco-tourist industry has begun to develop in British Columbia.
In March 1998 bear viewing policy and guidelines were presented in which the
government expressed support for the use of bears for tourism. This study addresses the impacts of viewing on bears and presents recommendations for further research and the sustainable development of bear viewing in the province.
2.
Methods
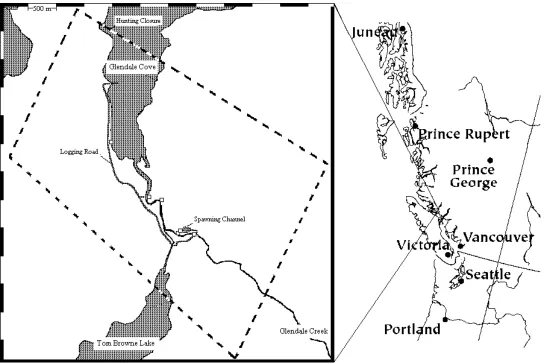
This study was performed in the Glendale Cove area of Knight Inlet, British Columbia, Canada (Figure 2.1).
The research design followed established field techniques (Chi 1999, Chi and Gilbert 1995, Olson et al. 1990). Data was collected in a rigorous sampling design on:
bear numbers - bear identification - age/sex class - time budgets -
fish capture -
arrival/departure directions - social/aggressive interactions - human caused disturbance -
scan sampling photo-identification photo-identification
scan sampling and continuous focal animal sampling
continuous observation and continuous focal animal sampling
continuous observational mapping continuous observation
continuous observation
As with Olson (1993), no significant difference was found between time budgets estimated by scan sampling and those recorded by continuous focal animal sampling.
3.
Summary of Results
Through spring and summer the bears in Glendale Cove spend much time foraging on the estuary and in dense berry growth in the red alder stands in the Glendale Valley. Many bears also search for marine invertebrates (mollusks, isopods, crabs, etc.) in the inter-tidal zone. When salmon first became available in late August, bears concentrated their fishing activities in shallow pools in the mouth of the Glendale River at low tide.
Bears were observed searching for fish at the weir as early as August 23. Low numbers of bears were seen consistently at the weir from this date onwards. No bears were
observed catching fish, however. Prior to the start of active fishing at the weir, increasing numbers of bears were sighted each day on the estuary and in the inter-tidal zone. Once salmon numbers were sufficient, bears were observed, at the weir, fishing at all times of the day and night. Fishing continued through October 8, the end of the study period.
The following were observed; details are provided in section 5:
The population is highly skewed towards females with cubs.
During bear viewing tours representation of different age/sex classes did not differ significantly from their representation in the population.
When bear viewing tours were absent sightings of large males and lone females increased and sightings of females with cubs and other males declined.
The proportion of time that bears spend fishing declined when bear viewing tours were present. (This does not affect all age/sex classes equally [see section 5.2.1.]) Fish capture rates were not affected by the presence of bear viewing tours.
Arrival and departure directions used by the bears were unaffected by current viewing structures, either while in use or while empty.
The presence of bear viewing tours seems to suppress social interactions between adults.
4.
Human Activity Patterns
4.1.Daily and Seasonal Patterns
4.1.1. Bear Viewing
During the 1999 season, viewing of bears at the weir began on September 1, within days of the first observed catch, and continued beyond the end of the study (October 8).
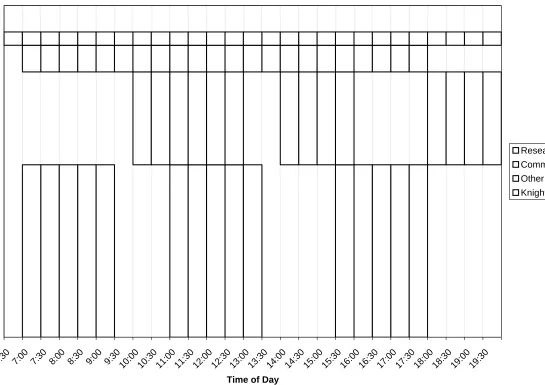
The daily viewing periods for different groups using the site are illustrated in Figure 4.1.1. This illustration shows the periods during which different user groups typically view the bears and is not representative of viewing on any one day, although these viewing periods were all used and even exceeded on some days in the 1999 season. KIL has been separated from other operators in this illustration because of the consistent daily schedule of their viewing activities as compared to the periodic schedule of use by other operators. The category "Commercial" refers to professional photographers and film crews who, while guests of KIL, operate in small numbers (1-3 people) on a different schedule from other bear viewing tours.
It can be clearly seen from Figure 4.1.1 that while individual operators may strive to leave 40-50% of daylight hours free of viewing this is not happening. Since each operator faces different constraints on their viewing periods it is difficult to see how multiple operators can function together without strict regulation of viewing periods. If the presence of bear viewing tours is having a significant impact on the bears the question of how much viewing can be allowed must be addressed.
4.1.2. Fisheries Management
The Department of Fisheries and Oceans operates the spawning channel on the Glendale River. The management and maintenance of the system requires that DFO employees visit the site several times each year. While these activities are clearly important to the maintenance of the salmon run and the physical structures associated with the spawning channel, visits during the spawning season can have a great impact on the bears.
The impacts of these visits are clearly illustrated by the following example. On September 8 1999 the DFO came to the spawning channel to collect fish samples. During the 6 hours that they were on the site their helicopter made no less than 5 very low passes or landings at the weir, 2 bear bangers were discharged and numerous rocks were thrown at passing bears. In the days leading up to the visit consistently high, and even increasing, numbers of bears had been observed fishing at the weir. In the days immediately following the visit 50% fewer bears were seen.
4.1.3. Hunting
There is currently a 17.5 km2 hunting closure around the Glendale River spawning channel. This includes the valley bottom from the estuary upstream to the spawning channel and continues upstream towards Glendale lake.
The fall brown bear hunting season in this part of British Columbia runs from October 1 to November 15; the spring season runs from April 1 to May 31. Both of these seasons overlap with the bear viewing season. By October, bears in the Glendale Valley have been encountering non-threatening humans regularly for 5 months and, if they have been fishing at the weir, they have been coming into close daily contact with non-threatening humans for at least a month. This makes these bears extremely vulnerable to hunters when they move outside the small closure around the spawning channel.
As has already been mentioned in Section 3 that age/sex class distribution of this
population is skewed towards females with cubs. This may be indicative of heavy losses of large males to hunting or poaching and is addressed in more detail in Section 5.1.
4.2.Other Bear Viewing Sites
Some concerns have been expressed that viewing stands, vehicles and people are all too close to bears as they approach the fish weir to feed. How do KI bear tours compare with long-established bear viewing sites in Alaska in regard to distances between public viewing platforms and feeding bears? The following points are based on one of the author's (BKG) experience during behavioral research over 10 years at Brooks River in Katmai NP, Anan Creek, Tongass NF and Fish Creek, near Hyder Alaska. We also have reviewed the extensive literature on other bear viewing sites at McNeil River State Game Refuge, Stan Price State Wildlife Sanctuary (Chichagof Island) and O'Malley Creek Observatory on Kodiak Island.
4.2.1. Behavioral Response
The data presented here suggest that a threshold is being passed when about 15 people are present (See Section 5.2.). Similar signs of intolerance and avoidance of groups by some bears was documented at Brooks and Anan.
4.2.2. Proximity of Viewers to Bears
The positioning of one of the KIL viewing structures within 20m of the weir give guests on this stand an intimate experience of bears feeding on salmon. Some concern has been expressed about the placement of this stand. Our data show no impact of the current viewing structures on the spatial distribution of bears at the site (Section 5.4.).
While there may be some aesthetic impacts on the experience of viewers at other
locations and some bears may be wary, there is nothing extraordinary about the proximity of bears and people at KI in our observations and experience (Figures 4.2.2.1 - 4.2.2.2).
It seems inappropriate to us to compare viewing from stands at the highly modified landscape of KI with bear viewing protocols and standards of "etiquette" toward bears at Kutzemateen River estuary. There the bears are foraging on dispersed summer foods in an unmodified, pristine surrounding and may be more vulnerable to harassment.
We also speculate that KI bears have more "watchdogs" looking after them and thus may be less likely to be exposed to illegal hunting or vandal harassment. We expect that this would build trust toward people over time in the KI bears and increase their ability to safely intermingle with people.
4.2.3. Wildlife Professionals
It is our experience that biologists, bear managers and fisheries technicians without direct, up-close experience with brown bears on a regular basis often persist in harboring negative stereotypes of risks from bears. These attitudes may be accentuated by ill-conceived training by people who hate bears or who only believe in the use of
overwhelming force to deal with them. Well-trained and knowledgeable biologists in British Columbia have little opportunity to gain personal experience with bear viewing. Furthermore, there has been little tradition of tolerance among provincial wildlife managers, as there is in Alaska, of bear viewing as an important use of the resource. This, fortunately, is changing. Further progress and understanding could occur if
5.
Bear Activity Patterns
Analysis of behavioral and activity patterns is based on more than 8200 minutes of observations at the Glendale River artificial spawning channel. All observations were made from the Knight Inlet Lodge viewing structure nearest to the weir. Cubs were excluded from this analysis since they replicate their mother's activity patterns. A small number of bears could not be assigned to an age/sex class because their sex was not determined. These bears were categorized as "Unknown", this class was very small however and so the observations for these bears were grouped with those for the age/sex class "Other Males", the class to which they were most similar, for analysis.
5.1.Age/Sex Class Distribution of Population
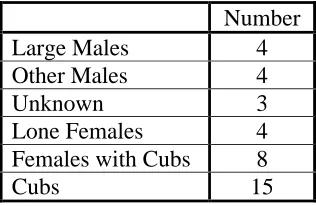
In 1999 38 bears were identified in the Glendale Cove area on Knight Inlet, BC (Table 5.1.1, Figure 5.1.1).
Table 5.1.1: Identified Bears
Number Large Males 4 Other Males 4
Unknown 3
Lone Females 4 Females with Cubs 8
Cubs 15
36% of the adult bears identified in this study were females with cubs. When compared to other studies (Darling 1987, Dean 1976, Martinka 1974, Murie 1981, Olson et al. 1990, Olson and Squibb 1990), the proportion of the population made up of females with cubs exceeds all similar sites. This could indicate that:
the population is still growing
large males are avoiding all contact with humans and so are underrepresented in our population estimate
hunting pressure has suppressed the number of large males in the population some combination of the above factors is acting on the population
Table 5.1.2: Age/Sex Class Distributions
Population Tours Absent Tours Present % % of observed
bear minutes
+/- % of observed bear minutes
+/-**
Large Males 17 33 + 20 0
Other Males 17 23* -* 23* 0*
Unknown 13 * * * *
Lone Females 17 26 + 23 0
Females with Cubs 36 18 - 34 0
*Individuals of unknown age sex class were included in "Other Male" for analysis ** No significant change at = 0.05
The number of bears present is not significantly different between viewing and non-viewing periods.
It can be seen (Table 5.1.2, Figures 5.1.2 - 5.1.3) that when bear viewing tours were present each age/sex class was observed with a frequency which did not differ
significantly ( =0.05) from its representation in the population. Large increases in the activity of bears in the large male age/sex class were observed during periods when tours were absent.
Large males dominate good feeding sites therefore females with cubs, and sub adults, avoid these sites. By suppressing the activity of the dominant age/sex classes, the presence of tours allows subordinate age/sex classes to take advantage of these sites, a refuge effect.
5.2.Time Spent Fishing
5.2.1. Analysis by Age/Sex Class
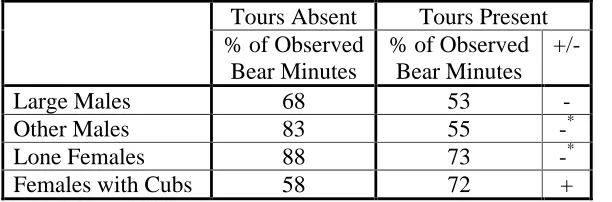
Table 5.2.1: Time Spent Fishing
Tours Absent Tours Present % of Observed
Bear Minutes
% of Observed Bear Minutes
+/-Large Males 68 53 -
Other Males 83 55 -*
Lone Females 88 73 -*
Females with Cubs 58 72 +
5.2.2. Analysis for all Bears
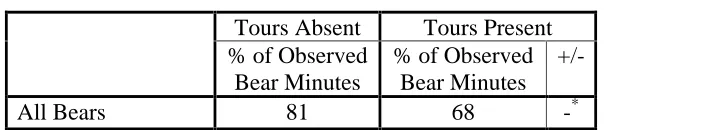
Table 5.2.2: Time Spent Fishing
Tours Absent Tours Present % of Observed
Bear Minutes
% of Observed Bear Minutes
+/-All Bears 81 68 -*
* Significant at = 0.05
With multiple operators, tours were, at times, present for periods extending to almost 100% of daylight hours (Figure 4.1.1). Given the reduced feeding observed while tours were present, this equates to a loss of more than 16% of daylight feeding at this site (See also Figure 5.6.1). As has been seen (Section 5.2.1.) that this loss of feeding time is not distributed evenly across the population (Figures 5.2.1 - 5.2.2).
Figure 5.2.4 shows that disturbance increases as viewing densities increase. It is unclear whether the step function (a), or the inverse-square relationship (y = 1-8x2*10-4) (b), best describes the relationship. It is clear however that at higher viewing densities the level of disturbance begins to increase rapidly.
5.3.Fish Capture Rates
Table 5.3.1: Fish Capture Rates
Tours Absent Tours Present
Rate rate +/- Fish caught per bear minute 0.21 0.16 - Fish caught per bear fishing minute 0.26 0.24 0
Viewing does not appear to effect the efficiency with which bears capture fish while fishing. The reduction in the number of fish caught per bear minute is rather a reflection of the behavioral changes outlined above.
5.4.Spatial Distribution of Bears Approaching and Leaving the Weir
5.5.Effects of Bear Viewing Tours on Adult Social Behavior
While tours were present social and aggressive behaviors among adults were never observed. However these behaviors were observed among large males and lone females during periods when tours were absent. These observations support the hypothesis that these age/sex classes, especially large males, are less tolerant of human presence.
5.6.Bio-Energetic Effects of Disturbance on Bears
Figure 5.6.1 illustrates the potential impact on available fishing time at different levels of viewing. In this illustration the effects outlined above are combined with the number of viewers kept constant.
Population density of brown bears is directly related to the level of meat consumption (Hilderbrand et al. 1999). The correlation Hilderbrand describes suggests a highly significant direct relationship between access to and ingestion of a high quality source of nutrition (in this case animal tissues) and population density. It is not only the
availability of high quality food resources that effects population density but also the timing of its seasonal availability. The availability of highly digestible meat resources, such as spawning salmon, in late summer and fall improves population productivity by providing the resources required for reproduction (Gilbert and Lanner 1995). Strong positive relationships between dietary meat and mean litter size and mean female mass were also found by Hilderbrand et al. (1999).
As viewing periods are increased the opportunities for fishing at the weir decrease. It is not known if, or how well, bears can substitute fishing at other locations on the Glendale River for opportunities lost at the weir. It is known, however, that reducing the
availability of salmon by removing fishing opportunities will have negative impacts on the population density, size and reproductive output of KI bears.
6.
Safety
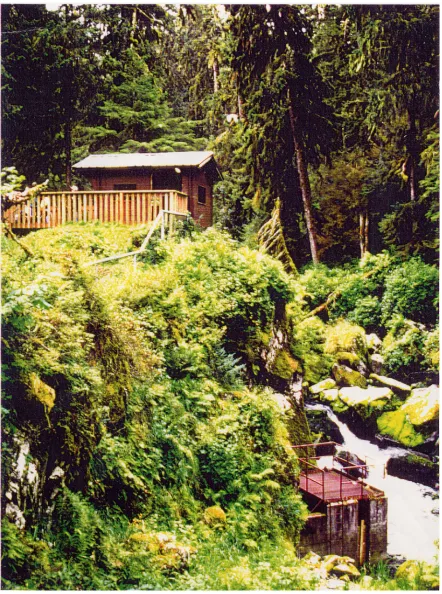
6.1.Visitor Accommodation
KIL is the only provider of multi-day tours to the site. Accommodation, food and other facilities are located across the cove from the bears and are situated on floats. This separation provides a significant advantage for safety and the protection of bears since no food, sewage or other attractants are accessible to bears.
6.2.Attractants
No garbage, food storage or sewage leach fields are situated near the spawning channel. There is therefore negligible risk of bears becoming food-conditioned, leading to property destruction or injuries. No food or drinks are permitted at the viewing site by KIL, nor was any eating by KIL guests observed. On one occasion however, a walking tour operated by Discovery tours was observed eating at the weir. At Anan Creek
independent visitors from near by towns occasionally brought coolers, including beer, to the observation platform. This was contrary to regulations but no approaches or breaking into containers was observed, perhaps because bears are totally focused on superabundant live fish. The current level of monitoring of strict rules about food should eliminate any risk at the KI site.
6.3.Supervision of Visitors
The nature of the KIL operation, and the constraints of a single day trip offered by other operators, ensure total withdrawal from the viewing site at day's end. At the Brooks River (Katmai NP) viewing site, when rangers go off duty and off the river at 5pm, the public is free to interact with bears in and along the river, unmonitored. Thus KI is safer and poses fewer risks to bears at the weir. When the last tour leaves, KI bears are not disturbed by people, a distinct benefit for bear conservation and public safety.
6.4.Habituation and the Potential for Problem Bears
The degree of habituation of Glendale bears to people is not of concern in regards to predisposition to food-conditioning. This is so far for two reasons:
bears are separated from food sources across the marine inlet.
unlike food-stressed mountain grizzlies, coastal brown bears with ample salmon and other foods seem uninterested in aggressively searching for foods near people.
In summary, we would emphasize that the assumed generality about the danger of habituation and food-conditioned learning in bears seems not to apply to coastal bears in BC and Alaska.
7.
Management and Policy Options
According to a major study by Miller and McCollum (1999), demand for wildlife viewing in Alaska "is significant and expected to increase". An estimated 23.6 million Americans took trips with wildlife viewing as the primary emphasis (1996 National Survey of Fishing, Hunting and Wildlife-Associated Recreation). In the Pacific region, which includes British Columbia and Alaska, wildlife viewing, as the primary trip goal, will experience the highest rate of increase and rates of participation in wildlife viewing will exceed the rate of population growth (Cordell et al. 1999).
In a recent publication that asked if eco-tourism is sustainable, Wall (1997) proposed three criteria:
"If tourism is to contribute to sustainable development, then it must be economically viable, ecologically sensitive and culturally appropriate"
Based on their extensive study, Alaska Voters: Their Wildlife Viewing Trips and
Economics (Alaska Dept. of Fish and Game 1994)), McCollum and Miller concluded that wildlife viewing meets all three criteria.
In their 1999 paper, Miller and McCollum found that:
"the greater wildlife viewing was a motivating factor for the trip, the greater were the in-state expenditures; the greater was the likelihood that the trip lasted longer than one week"
They concluded that Alaska could increase economic benefits by marketing wildlife viewing to fewer people who spend more money in different places in Alaska.
7.1.Options For British Columbia
While the demand, marketing and economics of bear viewing were not part of this study, and would be a legitimate and crucial next step by qualified resource economists, we offer the following suggestions based on bear behavior, a successful BC bear viewing business and direct experience of Alaskan viewing programs managed by U.S. government agencies.
7.1.1. Option 1
Expand opportunities for bear viewing in BC on salmon streams and estuary
concentration sites. These areas or eco-centers are already being targeted for greater protection (no-hunting zones, limited permitted viewing (e.g. Kutzemateen estuary)). It is becoming widely recognized that such protection from hunting is consistent with the principles of professional population management as well as ethical consideration of fair chase.
Because coastal brown bears in BC, as elsewhere, have special requirements of safety and minimizing disturbance, who will be the responsible manager is uncertain at present. Wildlife managers could designate employees, seasonal guides or volunteers to live onsite. Where an established business has the requisite experience and an accepted written plan, revocable permits seem appropriate. It seems quite clear that unlimited access by inexperienced private operators is inappropriate with bears as it is proving to be for ocean observation of whales. While there are many considerate, ethical operators, it appears that the lure of business returns and competition to "excel" with provision of "experiences" has a high probability of unacceptable impacts on the animals.
7.1.2. Option 2
Bear viewing could continue to be subordinated to traditional trophy hunting interests in the context of provincial management. This is not consistent with the public's attitudes in general, nor even necessarily with other hunters' attitudes. For example, in the study cited above (McCollum and Miller 1994), even among hunting residents in Alaska, the majority of them were not in favor of trophy bear hunting. One might predict that this would be true in BC, especially of the highly mechanized, easy access type of BC coastal brown bear hunting recently witnessed and reported (Horesji et al. 1998, McAllister 1997).
home range size of females congregating on spawning channels will help rationalize the extent of zone closures. Further, population modeling based on a population of
individually recognizable bears (e.g. Glendale) could provide predictions of the benefits of increased recruitment to the population resulting from increased access to salmon and other concentrated foods as a consequence of protection (site specific habituation to people)vs. aversion from hunting. The most serious impacts to populations would occur where the hunting season overlaps the peak period of hyperphagic salmon eating.
If BC decides to better exploit the international markets for wildlife viewing (specifically coastal species, focusing on bears), the steps recommended in the following quote from Miller and McCollum (1999) are helpful:
The goals of the [province's] tourism policies must be articulated. A marketing strategy to maximize instate spending will be very different from one designed to maximize the number of visitors
A benefit segmentation study of [BC's] visitor market should be conducted to identify specific benefit that we seek. [Miller and McCollum 1999] revealed a significant benefit segment, that of wildlife viewing; it was not intended to analyze other aspects of the visitor industry
a better segmentation of the specific wildlife viewing experience sought by both visitors and residents is needed. More wildlife viewing opportunities offering a variety of benefits and experiences need to be developed and marketed.
Wildlife management policies for wildlife viewing need to be articulated. Creating wildlife viewing opportunities requires coordinated efforts among wildlife managers, land managers, and the visitor industry.
8.
Recommendations
8.1.Knight Inlet
8.1.1. Viewing Infrastructure
Until further study has been completed on the substitutability of other fishing sites, it is our recommendation that there be no further development of new viewing locations at fishing sites on the Glendale River.
Reduction of vehicular traffic close to the weir will be an important step in the process of reducing the impacts of viewing. The simplest reduction in vehicular impact can be achieved by stopping the use of the slope between the KIL stand and the weir for turning buses. A simple ramp, as illustrated in Figure 8.1.1.1, would eliminate the need to walk guests across open ground between the bus and this stand and ease access to this viewing structure.
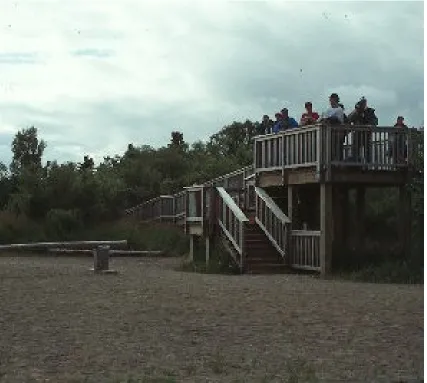
If vehicles are to be removed entirely from the ground close to the weir alternative methods of accessing the current viewing structures must be considered. Given the fact that bears cross and travel along the roadway regularly and the nature of the steep sided causeway upon which the road is situated (Figure 8.1.1.2), surprise encounters between bears and groups of visitors on foot are likely. At both Brooks and McNeil such
encounters are a regular occurrence. However, unlike these sites where safe alternative routs are available for both parties, at the Glendale spawning channel no such alternative exists. Creation of a raised walkway for visitors on the slope of the causeway (Figures 8.1.1.3 - 8.1.1.4) would circumvent this problem by creating an alternative route for human use only. Raising the walkway and placing it to the side of the roadway not only separates guests and bears but also allows bears to pass unobstructed beneath it and leaves the road available for maintenance and other DFO activities.
The removal of the earliest and/or latest viewing periods would provide significantly more undisturbed time for the bears with little impact on tour operators schedules.
8.1.2. Management of Viewing
8.1.2.1. Setting and controlling viewing periods
If multiple tour operators are to be allowed to bring bear viewing tours to the Glendale area of KI, viewing periods must be carefully regulated. It is not sufficient that each operator proposes a schedule that provides adequate undisturbed time for the bears, these schedules must be coordinated (Figure 4.1.1). Alternatively, a single operator could propose a simple, easily regulated viewing timetable.
8.1.2.2. Training of guides
Staff guiding the visiting public should have a consistent basis in knowledge of bear behavior ecology and human-bear interactions. Guests should expect not only to be safe but to enjoy a superior wild experience without anxiety.
8.1.2.3. MELP review/visitation
Both the regulation of viewing periods and the training of staff will require MELP review and/or site visitation to ensure parity between operators.
8.1.3. Hunting
By substantially extending the current hunting closure in the Glendale area of KI this area can become a resource not only for the eco-tourism industry but also for the conservation, and even the strengthening, of brown bear populations on this area of the BC coast. By protecting an area of high productivity, such as this, we provide a source of dispersing bears which serves to counterbalance losses in surrounding areas of low productivity and high mortality.
8.1.4. Research
8.1.4.1. Home ranges of bears using this area
Begin immediately to identify home ranges and access routes (mountain passes) of resident bears. Bears marked with adhering materials (rub tree delivery in mountain passes) may be targeted for micro-chip ID. It is of the utmost importance to the conservation and management of this population that we have an understanding of the home ranges of its members.
8.1.4.2. Availability of alternative feeding sites
To effectively manage bear viewing on this site we must not only have an understanding of the impacts at viewing sites, we must also have an awareness of the availability and substitutability of alternative feeding sites.
8.1.4.3. Age/sex structure of the population - stability
8.2.British Columbia Coast
8.2.1. Management of Viewing Locations
It is recommended that the management of viewing KI become the model for other similar sites on the BC coast. Access should be controlled by either only permitting one viewing operator or appointing an on site observer.
If locations for viewing are carefully selected using population models based on the salmon density - bear density relationship, a network of reserves can be established along the coast. By closing these reserves to hunting and logging they will become source populations for bears and centers of bio-diversity preservation. Yet, unlike many
proposed reserves, these areas will have great economic value because of their use in eco-tourism.
Coordinated efforts to create wildlife viewing opportunities must be initiated among wildlife, land and tourism managers (Miller and McCollum 1999).
8.2.2. Hunting
For the reasons stated in sections 4.1.3., 5.1., 7.1.1., 7.1.2., 8.1.3. and 8.2.1. hunting closures must be established around viewing locations.
8.2.3. Research
Pursue research on modeling of the salmon density-bear density relationship. This is important for the province of BC so that rates of increase can be predicted, providing refined information for extrapolation coast-wide. It should be done at Glendale to benefit from the known, individually recognizable bears at this site.
Analyze economic returns of bear viewing compared to hunting of bears in BC. A case history of total trip expenditures for KIL clients would be especially instructive. A survey of sought after viewing experience by guests at KIL would facilitate
9.
References
Bilby et al. (1996). Incorporation of nitrogen and carbon from spawning coho salmon into the trophic system of small streams: evidence from stable isotopes. Canadian Journal of Fisheries and Aquatic Science 53: 64-173.
Cederholm, C.J. and D.B. Houston. (1992) Fate of coho salmon (Onchorhynchus kisutch) carcasses in spawning streams. Canadian Journal of Fisheries and Aquatic Science 46:1347-1355.
Chi, D. K. (1999) Effects of salmon availability, social dynamics, and people on black bear (Ursus americanus) fishing behavior on an Alaskan salmon stream. PhD
dissertation, Utah State University, Logan.
Chi, D. K. and Gilbert, B. K. (1995) Responses of black bears to manipulated levels of human disturbance at Anan Creek, Tongass N. F. Alaska. In Human-black bear
interactions: Proc. 5th western black bear workshop. J. Aulgur and H. L. Black, eds. Brigham Young University Press, Provo Utah.
Darling, L. M. (1987) Grizzly bear nursery habitat in Denali National Park Alaska. M.S. Thesis, University of Alaska, Fairbanks
Dean, F. C. (1976) Aspects of grizzly bear population ecology in Mount McKinley National Park. International Conference on Bear Research and Management 3:111-119
Gilbert, B. K. and Lanner, R. M. (1996) Energy, diet and restoration of brown bear populations. Proceedings of the 9th International Conference on Bear Research and Management. Pp. 231-240
Hilderbrand, G. V., Schwartz, C. C., Robbins, C. T., Jacoby, M. E., Hanley, T. A., Arthur, S. M. and Servheen, C. (1999) Importance of Meat to Population Productivity and Conservation of North American Brown Bears. Canadian Journal of Zoology
77:132-138
Hilderbrand, G.V., C.T. Farley, C.T. Robbins, T.A. Hanley, K. Titus, & C. Servheen, (1996) Use of isotopes to determine diets of living and extinct bears. Canadian Journal of Zoology 74:2080-2088.
Miller, S.D., White, G.C., Sellers,R.A., Reynolds, H.V., Schoen, J.W., Titus, K., Barnes, V.G., Nelson, RR.,Ballard, W.B., & Schwartz,CC. (1997) Brown and black bear density in Alaska using radiotelemetry and replicated mark-resight techniques. Wildlife
Monographs 133. January 1997
Olson, T. L. (1993) Resource partitioning among brown bears in Katami National Park. MSc thesis, Utah State University, Logan
Olson, T. L. and Squibb, R. C. (1990) Brown bear behavior at Brooks River, 1990. Report. USDI-NPS-KATM, King Salmon. 48pp + app
Olson, T. L., Gilbert, B. K. and Fitkin, S. H. (1990) Brown bear behavior and human activity at salmon streams in Katmai National Park, Alaska. Report. USDI-NPS-ARO, Anchorage. 123pp
Rayleigh (1919) On problems of random variations in flights in one, two, and three dimensions. Philosophical Magazine 37:321-347
Willson, M.F., S.M. Gende, and B.H. Marston. 1998. Fishes and the Forest. BioScience
48:455-462.
Figure 4.1.1: Comparing Viewing Periods for Different User Groups
Viewing Periods
6:30 7:00 7:30 8:00 8:30 9:00 9:30 :0 0
:30 :00 :30 :00 :30 :00 :30 :00 :30 :00 :30 :00 :30 :00 :30 :00 :30 :00 :30
Figure 5.1.1: Population of Identified Bears
Age/Sex Classes (All Identified Bears)
Other Males 17% Females with Cubs
36%
Unknown* 13% Lone Females
17%
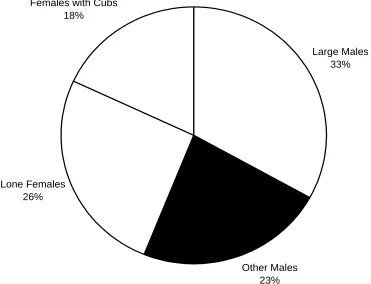
Figure 5.1.2: Proportion of Observed Bear Minutes by Age/Sex Class - Tours Absent
Age/Sex Classes (Tours Absent)
Other Males 23% Lone Females
26%
Large Males 33% Females with Cubs
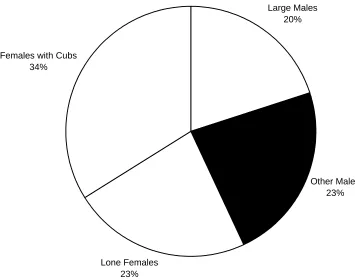
Figure 5.1.3: Proportion of Observed Bear Minutes by Age/Sex Class - Tours Present
Age/Sex Classes (Tours Present)
Other Males 23%
Lone Females 23% Females with Cubs
34%
Figure 5.2.1: Mean Time Spent Fishing by Age/Sex Class - Tours Absent
0 0.1 0.2 0.3 0.4 0.5 0.6 0.7 0.8 0.9 1
Proportion of Observed Minutes
Mean Time Spent Fishing - Tours Absent
Figure 5.2.2: Mean Time Spent Fishing by Age/Sex Class - Tours Present
0 0.1 0.2 0.3 0.4 0.5 0.6 0.7 0.8 0.9 1
Proportion of Observed Minutes
Mean Time Spent Fishing - Tours Present
Figure 5.2.4: Maximum Observed Time Spent Fishing - Regression
Proportion of Observed Bear Minutes Spent Fishing vs. Number of People Present
0 0.1 0.2 0.3 0.4 0.5 0.6 0.7 0.8 0.9 1
0 5 10 15 20 25
Figure 5.4.1: Arrival Distribution - Tours Absent
Direction of Bear Arrival (Tours Absent)
5
0
4 2
6 7
12
2
0
1
45
2
90
3
135
4 5
225 6
270 7
315
Figure 5.4.2: Departure Distribution - Tours Absent
Direction of Bear Departure (Tours Absent)
4 1
7 1
4 10
7
3
0
1
45
2
90
3
135 225
6 270
7
315
Figure 5.4.3: Arrival Distribution - Tours Present
Direction of Bear Arrival (Tours Present)
8 6
19 0
7 6 15
7
0
1
45
2
90
3
135 225
6 270
7
315
Figure 5.4.4: Departure Distribution - Tours Present
Direction of Bear Departure (Tours Present)
8
5
12 5
7 9
13
11
0
1
45
2
90
3
135
4 5
225 6
270 7
315
Figure 5.6.1: Bio-Energetic Effects of Disturbance
Bio-Energetic Effects of Disturbance
0 10 20 30 40 50 60 70 80 U n it s o f F is h in g T im e A v a il a b le A t T h e V ie w in g S it e
100 90 80 70 60 50 40 30 20 10 0
% Time Tours Absent